Races in North Randall, Texas (TX) Detailed Stats
Ancestries, Foreign-born residents, place of birth
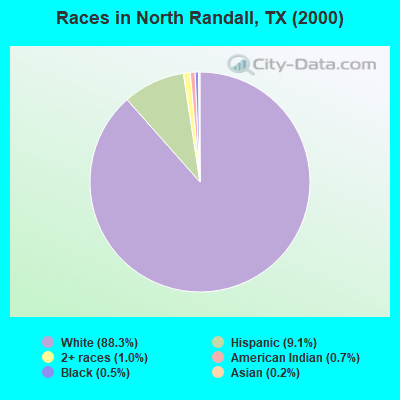
Race distribution in North Randall

- 12,31488.3%White alone
- 1,2749.1%Hispanic
- 1331.0%Two or more races
- 1010.7%American Indian alone
- 750.5%Black alone
- 330.2%Asian alone
- 110.08%Other race alone
- 20.01%Native Hawaiian and Other
Pacific Islander alone
2000
2022
-
- 10,933,31352.4%White alone
- 6,669,66632.0%Hispanic
- 2,364,25511.3%Black alone
- 554,4452.7%Asian alone
- 230,5671.1%Two or more races
- 68,8590.3%American Indian alone
- 19,9580.10%Other race alone
- 10,7570.05%Native Hawaiian and Other
Pacific Islander alone

-
- 12,070,64240.2%Hispanic
- 11,683,43038.9%White alone
- 3,508,70611.7%Black alone
- 1,608,1735.4%Asian alone
- 956,5603.2%Two or more races
- 125,7630.4%Other race alone
- 47,0230.2%American Indian alone
- 29,2750.10%Native Hawaiian and Other
Pacific Islander alone

Income and house value in North Randall
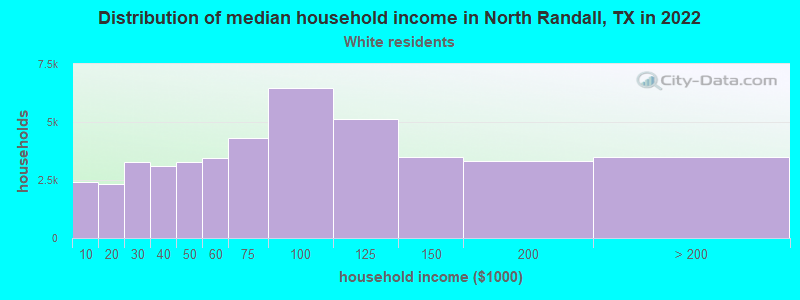
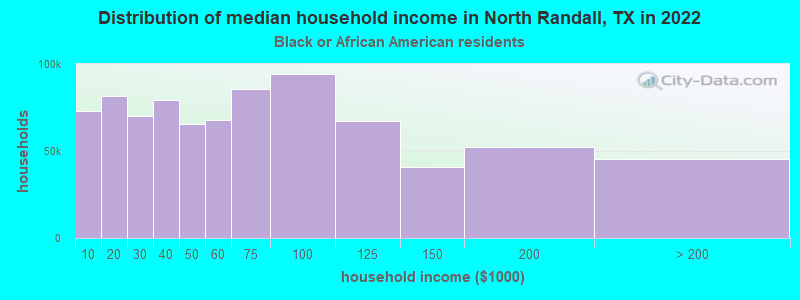
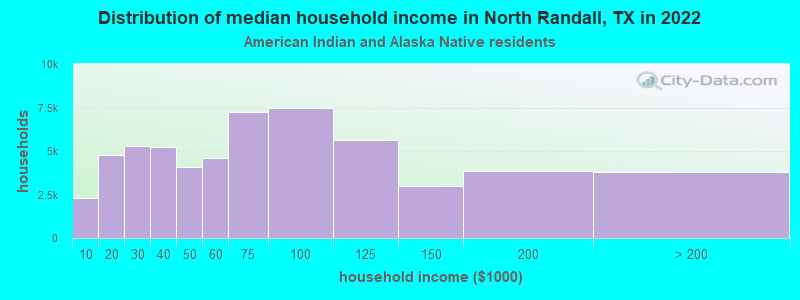
- Median household income in 2022
- $75,820White non-Hispanic householders
- $81,909Black householders
- $83,983American Indian and Alaska Native householders
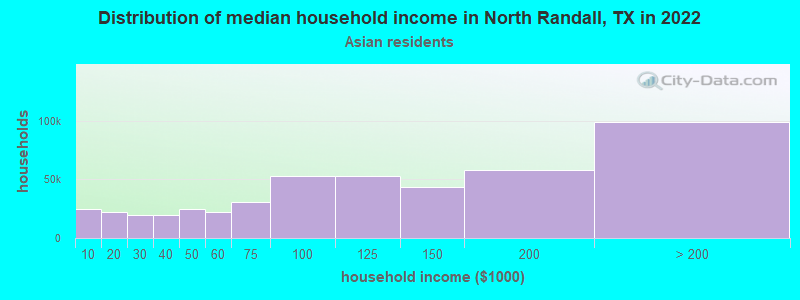
- over $200,000Asian householders
- over $200,000Some other race householders
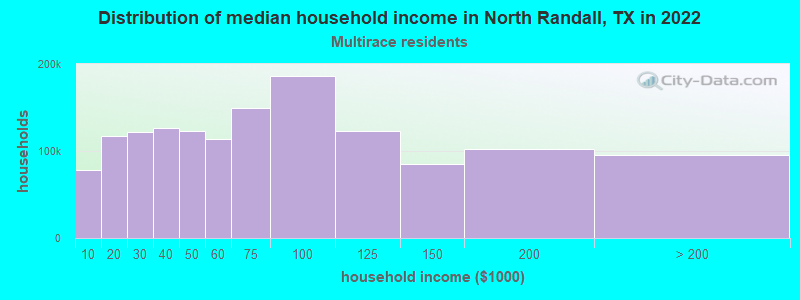
- $153,576Two or more races householders
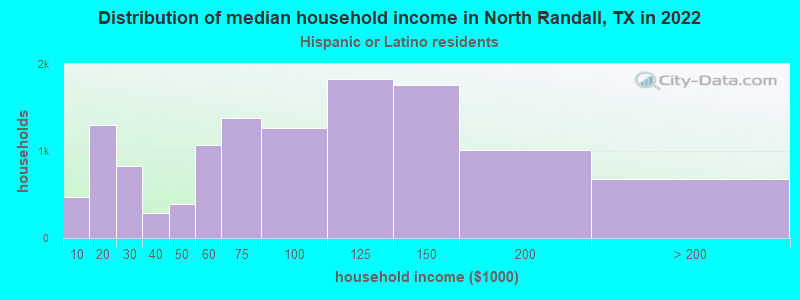
- $100,332Hispanic or Latino race householders
- Median 2022 house value
- $350,258White Non-Hispanic householders
- $174,860Black or African American householders
- $201,761American Indian or Alaska Native householders
- $571,658Asian householders
- $361,826Some other race householders
- $90,389Two or more races householders
- $377,967Hispanic or Latino householders
Household income for White non-Hispanic householders
Household income for Black householders
Household income for American Indian and Alaska Native householders
Household income for Asian householders
Household income for Two or more races householders
Household income for Hispanic or Latino race householders
Zip code: 79118