Races in North Ogden, Utah (UT) Detailed Stats
Data:
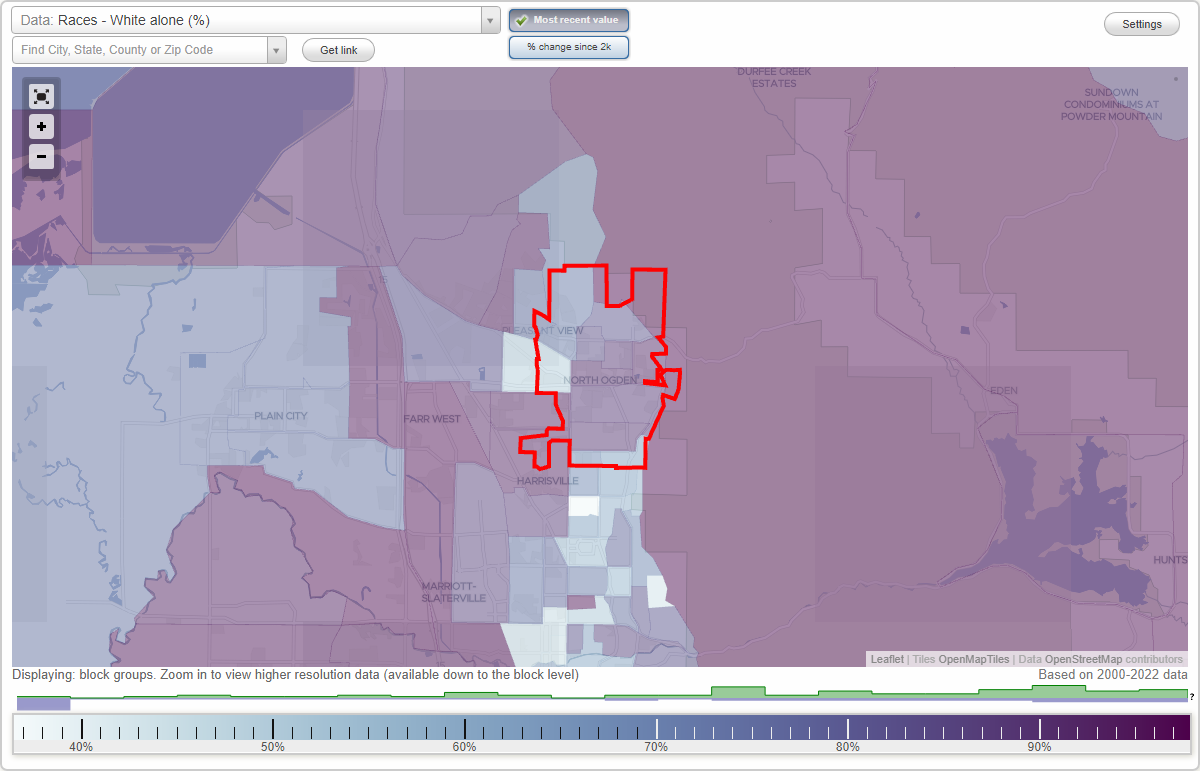
Races - White alone (%)
Races - White alone (% change since 2000)
Races - Black alone (%)
Races - Black alone (% change since 2000)
Races - American Indian alone (%)
Races - American Indian alone (% change since 2000)
Races - Asian alone (%)
Races - Asian alone (% change since 2000)
Races - Hispanic (%)
Races - Hispanic (% change since 2000)
Races - Native Hawaiian and Other Pacific Islander alone (%)
Races - Native Hawaiian and Other Pacific Islander alone (% change since 2000)
Races - Two or more races(%)
Races - Two or more races(% change since 2000)
Races - Other race alone (%)
Races - Other race alone (% change since 2000)
Racial diversity
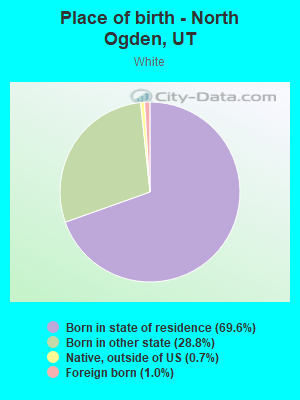
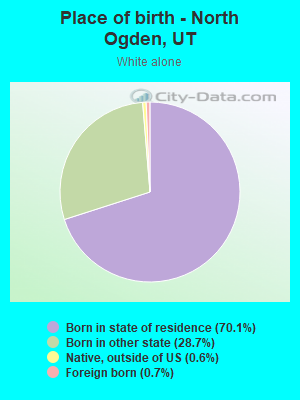
Place of birth - Born in state of residence (%)
Place of birth - Born in state of residence (%) - White
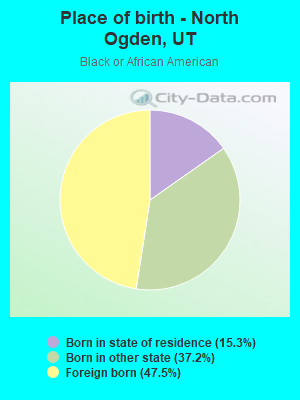
Place of birth - Born in state of residence (%) - Black or African American
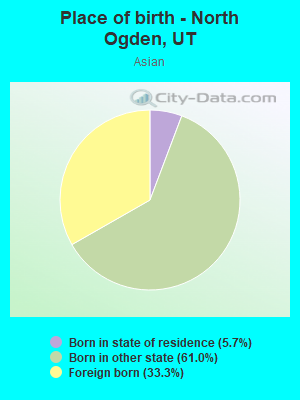
Place of birth - Born in state of residence (%) - Asian
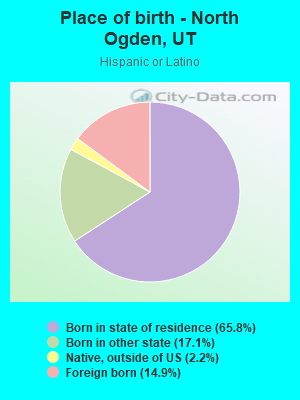
Place of birth - Born in state of residence (%) - Hispanic or Latino
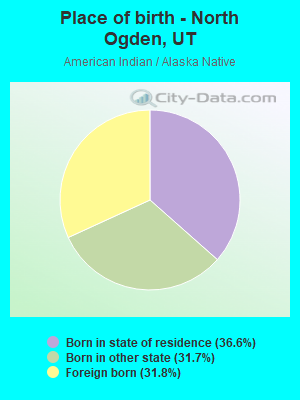
Place of birth - Born in state of residence (%) - American Indian and Alaska Native
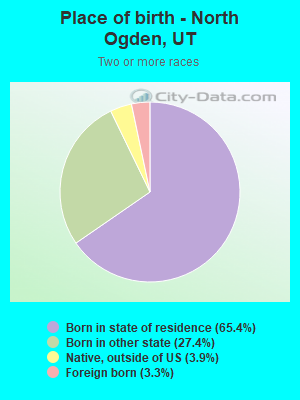
Place of birth - Born in state of residence (%) - Multirace
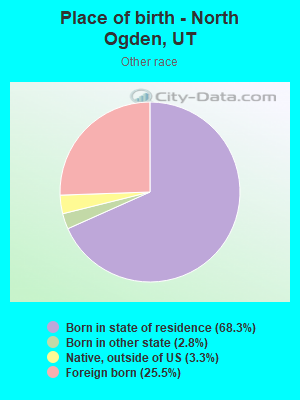
Place of birth - Born in state of residence (%) - Other Race
Place of birth - Born in other state (%)
Place of birth - Born in other state (%) - White
Place of birth - Born in other state (%) - Black or African American
Place of birth - Born in other state (%) - Asian
Place of birth - Born in other state (%) - Hispanic or Latino
Place of birth - Born in other state (%) - American Indian and Alaska Native
Place of birth - Born in other state (%) - Multirace
Place of birth - Born in other state (%) - Other Race
Place of birth - Native, outside of US (%)
Place of birth - Native, outside of US (%) - White
Place of birth - Native, outside of US (%) - Black or African American
Place of birth - Native, outside of US (%) - Asian
Place of birth - Native, outside of US (%) - Hispanic or Latino
Place of birth - Native, outside of US (%) - American Indian and Alaska Native
Place of birth - Native, outside of US (%) - Multirace
Place of birth - Native, outside of US (%) - Other Race
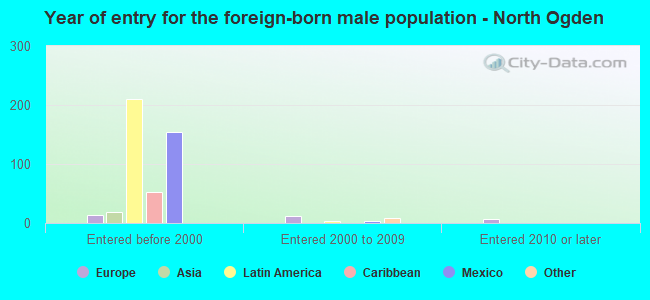
Place of birth - Foreign born (%)
Place of birth - Foreign born (%) - White
Place of birth - Foreign born (%) - Black or African American
Place of birth - Foreign born (%) - Asian
Place of birth - Foreign born (%) - Hispanic or Latino
Place of birth - Foreign born (%) - American Indian and Alaska Native
Place of birth - Foreign born (%) - Multirace
Place of birth - Foreign born (%) - Other Race
Residents speaking English at home (%)
Residents speaking English at home - Born in the United States (%)
Residents speaking English at home - Native, born elsewhere (%)
Residents speaking English at home - Foreign born (%)
Residents speaking Spanish at home (%)
Residents speaking Spanish at home - Born in the United States (%)
Residents speaking Spanish at home - Native, born elsewhere (%)
Residents speaking Spanish at home - Foreign born (%)
Residents speaking other language at home (%)
Residents speaking other language at home - Born in the United States (%)
Residents speaking other language at home - Native, born elsewhere (%)
Residents speaking other language at home - Foreign born (%)
Marital status - Never married (%)
Marital status - Now married (%)
Marital status - Separated (%)
Marital status - Widowed (%)
Marital status - Divorced (%)
Ancestries Reported - Arab (%)
Ancestries Reported - Czech (%)
Ancestries Reported - Danish (%)
Ancestries Reported - Dutch (%)
Ancestries Reported - English (%)
Ancestries Reported - French (%)
Ancestries Reported - French Canadian (%)
Ancestries Reported - German (%)
Ancestries Reported - Greek (%)
Ancestries Reported - Hungarian (%)
Ancestries Reported - Irish (%)
Ancestries Reported - Italian (%)
Ancestries Reported - Lithuanian (%)
Ancestries Reported - Norwegian (%)
Ancestries Reported - Polish (%)
Ancestries Reported - Portuguese (%)
Ancestries Reported - Russian (%)
Ancestries Reported - Scotch-Irish (%)
Ancestries Reported - Scottish (%)
Ancestries Reported - Slovak (%)
Ancestries Reported - Subsaharan African (%)
Ancestries Reported - Swedish (%)
Ancestries Reported - Swiss (%)
Ancestries Reported - Ukrainian (%)
Ancestries Reported - United States (%)
Ancestries Reported - Welsh (%)
Ancestries Reported - West Indian (%)
Ancestries Reported - Other (%)
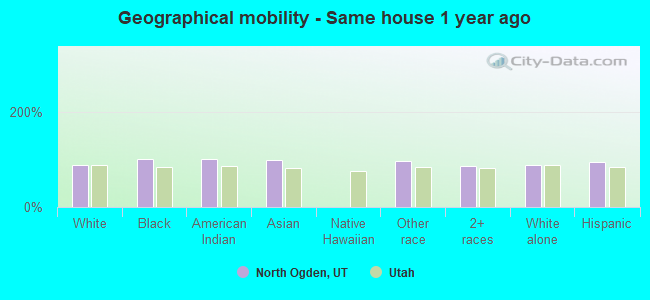
Geographical mobility - Same house 1 year ago (%)
Geographical mobility - Same house 1 year ago (%) - White
Geographical mobility - Same house 1 year ago (%) - Black or African American
Geographical mobility - Same house 1 year ago (%) - Asian
Geographical mobility - Same house 1 year ago (%) - Hispanic or Latino
Geographical mobility - Same house 1 year ago (%) - American Indian and Alaska Native
Geographical mobility - Same house 1 year ago (%) - Multirace
Geographical mobility - Same house 1 year ago (%) - Other Race
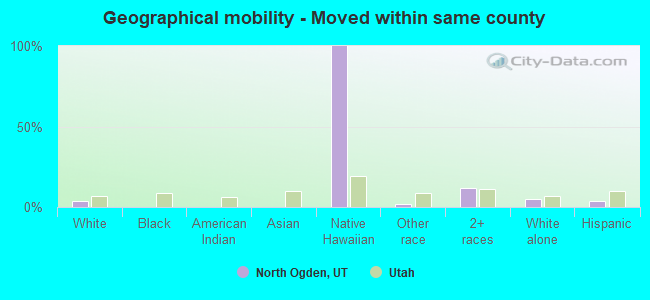
Geographical mobility - Moved within same county (%)
Geographical mobility - Moved within same county (%) - White
Geographical mobility - Moved within same county (%) - Black or African American
Geographical mobility - Moved within same county (%) - Asian
Geographical mobility - Moved within same county (%) - Hispanic or Latino
Geographical mobility - Moved within same county (%) - American Indian and Alaska Native
Geographical mobility - Moved within same county (%) - Multirace
Geographical mobility - Moved within same county (%) - Other Race
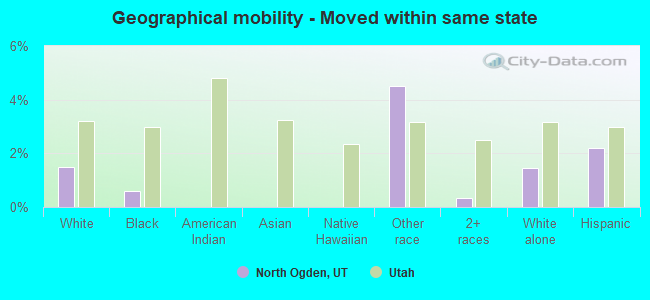
Geographical mobility - Moved from different county within same state (%)
Geographical mobility - Moved from different county within same state (%) - White
Geographical mobility - Moved from different county within same state (%) - Black or African American
Geographical mobility - Moved from different county within same state (%) - Asian
Geographical mobility - Moved from different county within same state (%) - Hispanic or Latino
Geographical mobility - Moved from different county within same state (%) - American Indian and Alaska Native
Geographical mobility - Moved from different county within same state (%) - Multirace
Geographical mobility - Moved from different county within same state (%) - Other Race
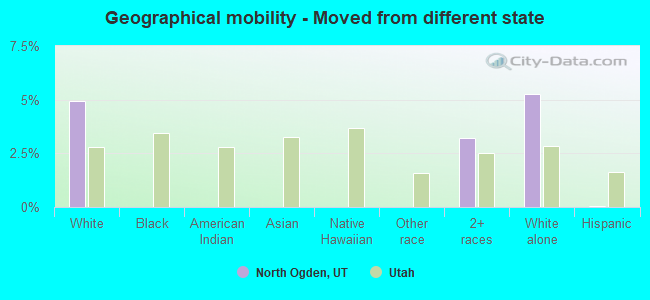
Geographical mobility - Moved from different state (%)
Geographical mobility - Moved from different state (%) - White
Geographical mobility - Moved from different state (%) - Black or African American
Geographical mobility - Moved from different state (%) - Asian
Geographical mobility - Moved from different state (%) - Hispanic or Latino
Geographical mobility - Moved from different state (%) - American Indian and Alaska Native
Geographical mobility - Moved from different state (%) - Multirace
Geographical mobility - Moved from different state (%) - Other Race
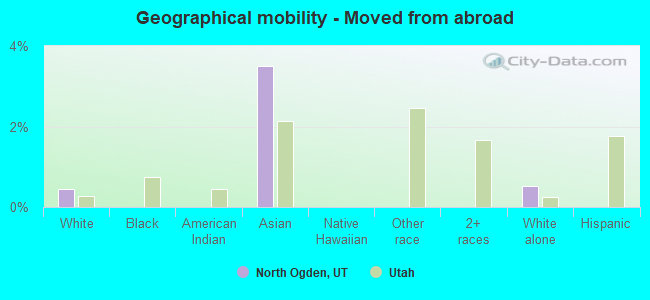
Geographical mobility - Moved from abroad (%)
Geographical mobility - Moved from abroad (%) - White
Geographical mobility - Moved from abroad (%) - Black or African American
Geographical mobility - Moved from abroad (%) - Asian
Geographical mobility - Moved from abroad (%) - Hispanic or Latino
Geographical mobility - Moved from abroad (%) - American Indian and Alaska Native
Geographical mobility - Moved from abroad (%) - Multirace
Geographical mobility - Moved from abroad (%) - Other Race
Place of birth for the foreign-born population - Ireland (%)
Place of birth for the foreign-born population - Denmark (%)
Place of birth for the foreign-born population - Norway (%)
Place of birth for the foreign-born population - Sweden (%)
Place of birth for the foreign-born population - United Kingdom (%)
Place of birth for the foreign-born population - England (%)
Place of birth for the foreign-born population - Scotland (%)
Place of birth for the foreign-born population - Other Northern Europe (%)
Place of birth for the foreign-born population - Austria (%)
Place of birth for the foreign-born population - Belgium (%)
Place of birth for the foreign-born population - France (%)
Place of birth for the foreign-born population - Germany (%)
Place of birth for the foreign-born population - Netherlands (%)
Place of birth for the foreign-born population - Switzerland (%)
Place of birth for the foreign-born population - Other Western Europe (%)
Place of birth for the foreign-born population - Greece (%)
Place of birth for the foreign-born population - Italy (%)
Place of birth for the foreign-born population - Portugal (%)
Place of birth for the foreign-born population - Spain (%)
Place of birth for the foreign-born population - Other Southern Europe (%)
Place of birth for the foreign-born population - Albania (%)
Place of birth for the foreign-born population - Belarus (%)
Place of birth for the foreign-born population - Bosnia and Herzegovina (%)
Place of birth for the foreign-born population - Bulgaria (%)
Place of birth for the foreign-born population - Croatia (%)
Place of birth for the foreign-born population - Czechoslovakia (%)
Place of birth for the foreign-born population - Hungary (%)
Place of birth for the foreign-born population - Latvia (%)
Place of birth for the foreign-born population - Lithuania (%)
Place of birth for the foreign-born population - North Macedonia (Macedonia) (%)
Place of birth for the foreign-born population - Moldova (%)
Place of birth for the foreign-born population - Poland (%)
Place of birth for the foreign-born population - Romania (%)
Place of birth for the foreign-born population - Russia (%)
Place of birth for the foreign-born population - Serbia (%)
Place of birth for the foreign-born population - Ukraine (%)
Place of birth for the foreign-born population - Other Eastern Europe (%)
Place of birth for the foreign-born population - China (%)
Place of birth for the foreign-born population - Hong Kong (%)
Place of birth for the foreign-born population - Taiwan (%)
Place of birth for the foreign-born population - Japan (%)
Place of birth for the foreign-born population - Korea (%)
Place of birth for the foreign-born population - Other Eastern Asia (%)
Place of birth for the foreign-born population - Afghanistan (%)
Place of birth for the foreign-born population - Bangladesh (%)
Place of birth for the foreign-born population - India (%)
Place of birth for the foreign-born population - Iran (%)
Place of birth for the foreign-born population - Kazakhstan (%)
Place of birth for the foreign-born population - Nepal (%)
Place of birth for the foreign-born population - Pakistan (%)
Place of birth for the foreign-born population - Sri Lanka (%)
Place of birth for the foreign-born population - Uzbekistan (%)
Place of birth for the foreign-born population - Other South Central Asia (%)
Place of birth for the foreign-born population - Burma (%)
Place of birth for the foreign-born population - Cambodia (%)
Place of birth for the foreign-born population - Indonesia (%)
Place of birth for the foreign-born population - Laos (%)
Place of birth for the foreign-born population - Malaysia (%)
Place of birth for the foreign-born population - Philippines (%)
Place of birth for the foreign-born population - Singapore (%)
Place of birth for the foreign-born population - Thailand (%)
Place of birth for the foreign-born population - Vietnam (%)
Place of birth for the foreign-born population - Other South Eastern Asia (%)
Place of birth for the foreign-born population - Armenia (%)
Place of birth for the foreign-born population - Iraq (%)
Place of birth for the foreign-born population - Israel (%)
Place of birth for the foreign-born population - Jordan (%)
Place of birth for the foreign-born population - Kuwait (%)
Place of birth for the foreign-born population - Lebanon (%)
Place of birth for the foreign-born population - Saudi Arabia (%)
Place of birth for the foreign-born population - Syria (%)
Place of birth for the foreign-born population - Turkey (%)
Place of birth for the foreign-born population - Yemen (%)
Place of birth for the foreign-born population - Other Western Asia (%)
Place of birth for the foreign-born population - Eritrea (%)
Place of birth for the foreign-born population - Ethiopia (%)
Place of birth for the foreign-born population - Kenya (%)
Place of birth for the foreign-born population - Somalia (%)
Place of birth for the foreign-born population - Uganda (%)
Place of birth for the foreign-born population - Zimbabwe (%)
Place of birth for the foreign-born population - Other Eastern Africa (%)
Place of birth for the foreign-born population - Cameroon (%)
Place of birth for the foreign-born population - Congo (%)
Place of birth for the foreign-born population - Democratic Republic of Congo (Zaire) (%)
Place of birth for the foreign-born population - Other Middle Africa (%)
Place of birth for the foreign-born population - Egypt (%)
Place of birth for the foreign-born population - Morocco (%)
Place of birth for the foreign-born population - Sudan (%)
Place of birth for the foreign-born population - Other Northern Africa (%)
Place of birth for the foreign-born population - South Africa (%)
Place of birth for the foreign-born population - Other Southern Africa (%)
Place of birth for the foreign-born population - Cabo Verde (%)
Place of birth for the foreign-born population - Ghana (%)
Place of birth for the foreign-born population - Liberia (%)
Place of birth for the foreign-born population - Nigeria (%)
Place of birth for the foreign-born population - Senegal (%)
Place of birth for the foreign-born population - Sierra Leone (%)
Place of birth for the foreign-born population - Other Western Africa (%)
Place of birth for the foreign-born population - Australia (%)
Place of birth for the foreign-born population - New Zealand (%)
Place of birth for the foreign-born population - Fiji (%)
Place of birth for the foreign-born population - Micronesia (%)
Place of birth for the foreign-born population - Bahamas (%)
Place of birth for the foreign-born population - Barbados (%)
Place of birth for the foreign-born population - Cuba (%)
Place of birth for the foreign-born population - Dominica (%)
Place of birth for the foreign-born population - Dominican Republic (%)
Place of birth for the foreign-born population - Grenada (%)
Place of birth for the foreign-born population - Haiti (%)
Place of birth for the foreign-born population - Jamaica (%)
Place of birth for the foreign-born population - St. Vincent and the Grenadines (%)
Place of birth for the foreign-born population - Trinidad and Tobago (%)
Place of birth for the foreign-born population - West Indies (%)
Place of birth for the foreign-born population - Other Caribbean (%)
Place of birth for the foreign-born population - Belize (%)
Place of birth for the foreign-born population - Costa Rica (%)
Place of birth for the foreign-born population - El Salvador (%)
Place of birth for the foreign-born population - Guatemala (%)
Place of birth for the foreign-born population - Honduras (%)
Place of birth for the foreign-born population - Mexico (%)
Place of birth for the foreign-born population - Nicaragua (%)
Place of birth for the foreign-born population - Panama (%)
Place of birth for the foreign-born population - Other Central America (%)
Place of birth for the foreign-born population - Argentina (%)
Place of birth for the foreign-born population - Bolivia (%)
Place of birth for the foreign-born population - Brazil (%)
Place of birth for the foreign-born population - Chile (%)
Place of birth for the foreign-born population - Colombia (%)
Place of birth for the foreign-born population - Ecuador (%)
Place of birth for the foreign-born population - Guyana (%)
Place of birth for the foreign-born population - Peru (%)
Place of birth for the foreign-born population - Uruguay (%)
Place of birth for the foreign-born population - Venezuela (%)
Place of birth for the foreign-born population - Other South America (%)
Place of birth for the foreign-born population - Canada (%)
Place of birth for the foreign-born population - Other Northern America (%)
Place of birth for the foreign-born population - Other (%)
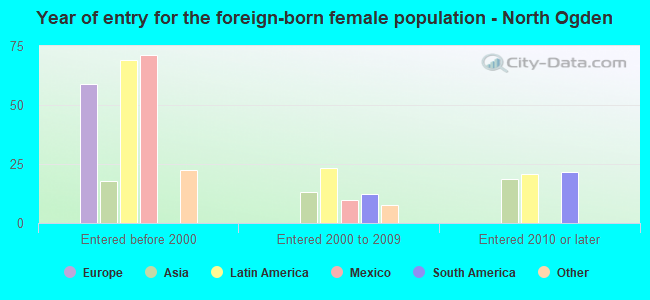
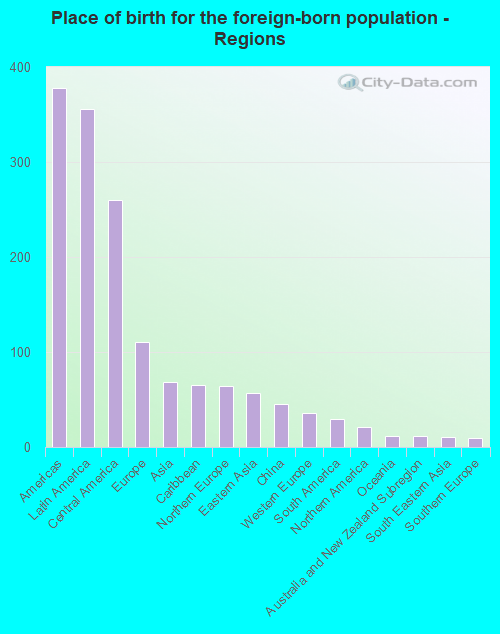
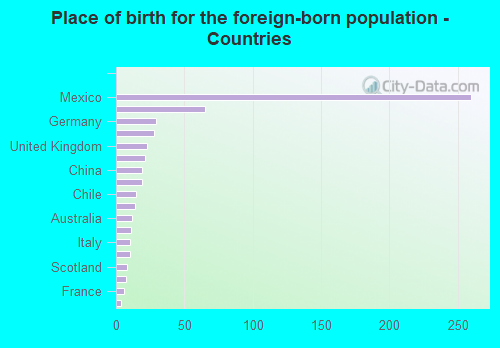
According to 2022 data, the most numerous races in North Ogden, UT are White alone (18,496 residents), Hispanic (1,856 residents), and Two or more races (642 residents). 94.5% of North Ogden residents speak English at home. 2.6% of North Ogden, UT residents are foreign-born (1.6% born in Latin America, 0.5% born in Europe, 0.3% born in Asia), which is 203.1% less than the foreign-born rate of 8.0% across the entire state of Utah.
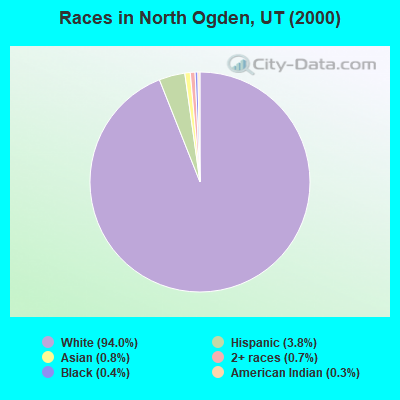
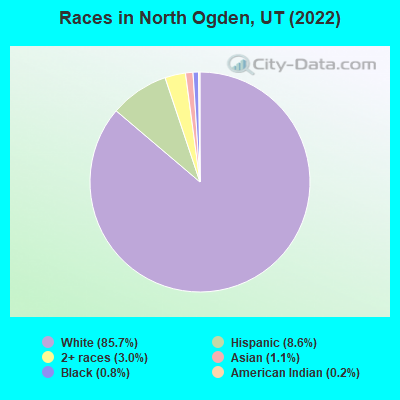
Race distribution in North Ogden
2000 2022
1,904,265 85.3% White alone 201,559 9.0% Hispanic 36,483 1.6% Asian alone 31,308 1.4% Two or more races 26,663 1.2% American Indian alone 14,806 0.7% Native Hawaiian and Other 16,137 0.7% Black alone 1,948 0.09% Other race alone
2,557,466 75.6% White alone 512,086 15.1% Hispanic 119,308 3.5% Two or more races 82,388 2.4% Asian alone 36,978 1.1% Native Hawaiian and Other 34,873 1.0% Black alone 22,803 0.7% American Indian alone 14,898 0.4% Other race alone
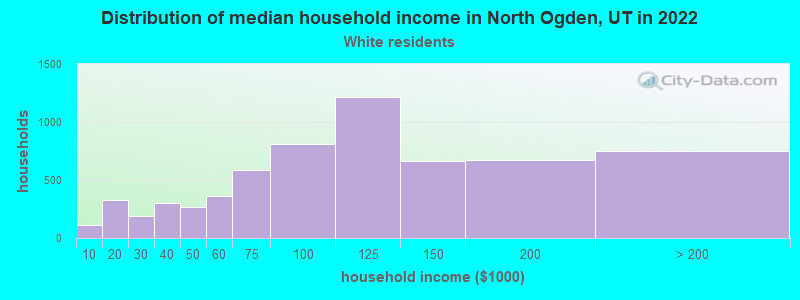
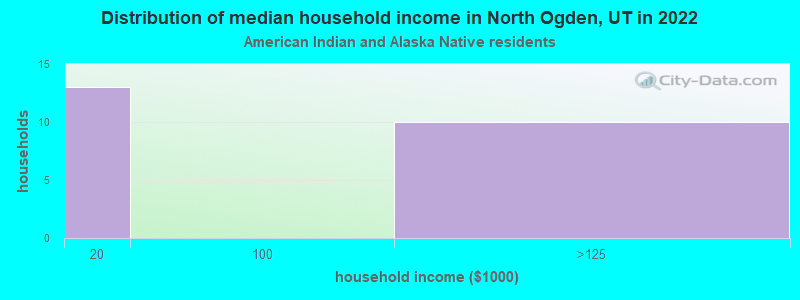
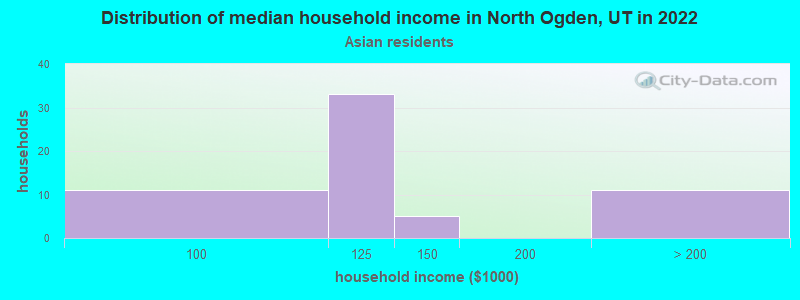
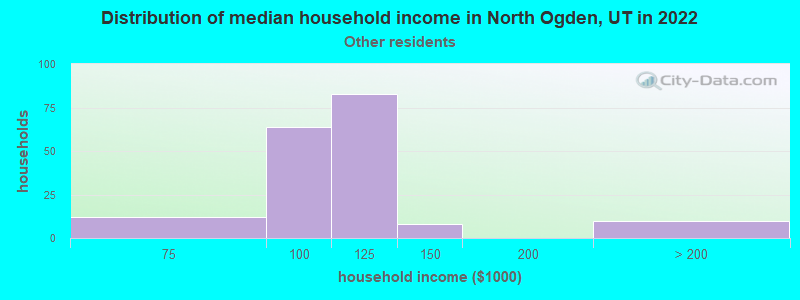
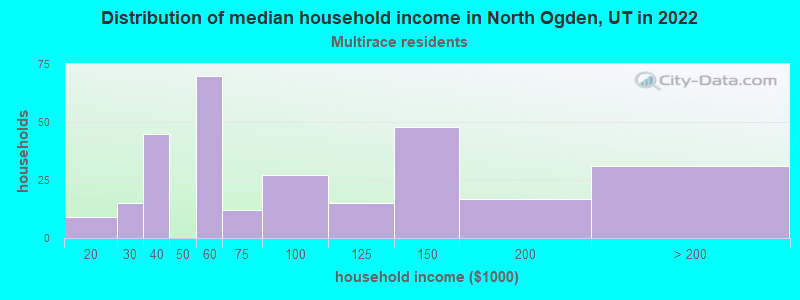
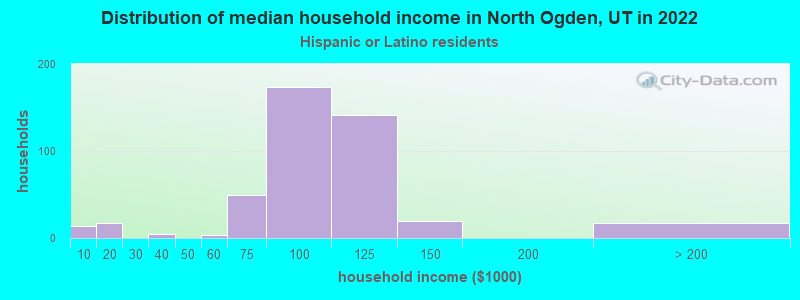
Income and house value in North Ogden Median household income in 2022 $103,721 White non-Hispanic householders$70,471 Asian householders$97,895 Some other race householders$95,268 Hispanic or Latino race householdersMedian 2022 house value $497,037 White Non-Hispanic householders$621,711 Black or African American householders$663,159 American Indian or Alaska Native householders $378,995 Asian householders$538,816 Native Hawaiian and other Pacific Islander householders$476,811 Some other race householders$571,974 Two or more races householders$501,680 Hispanic or Latino householders
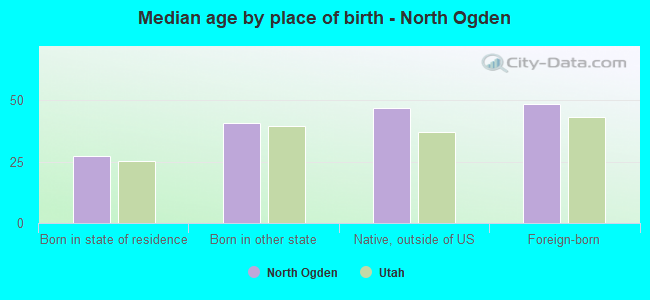
Median age by race in North Ogden
33.1 Median age for White residents34.3 32.2 59.5 Median age for Black or African American residents63.8 28.7 50.9 Median age for American Indian / Alaska Native residents-673,245,613.4 50.0 33.0 Median age for Asian residents21.0 36.8 -1,217,647,057.6 Median age for Native Hawaiian / Pacific Islander residents-1,563,046,190.7 -664,285,713.6 13.2 Median age for Other race residents27.1 12.8 31.8 Median age for Two or more races residents27.9 40.4 34.2 Median age for White alone residents35.3 33.4 23.1 Median age for Hispanic or Latino residents26.6 14.0
Owner/renter occupied households by race in North Ogden
House owners and renters - White residents 5,231 84.6% Owner occupied950 15.4% Renter occupiedHouse owners and renters - Black or African American residents 47 100.0% Renter occupiedHouse owners and renters - American Indian / Alaska Native residents 32 100.0% Owner occupiedHouse owners and renters - Asian residents 41 100.0% Owner occupiedHouse owners and renters - Other race residents 122 78.8% Owner occupied33 21.2% Renter occupiedHouse owners and renters - Two or more races residents 224 77.1% Owner occupied67 22.9% Renter occupiedHouse owners and renters - White alone residents 5,106 84.8% Owner occupied914 15.2% Renter occupiedHouse owners and renters - Hispanic or Latino residents 346 75.9% Owner occupied110 24.1% Renter occupied
Language usage in North Ogden
English speakers - Total 94.5% of residents of North Ogden speak English at home.
4.1% of residents speak Spanish at home 696 85.5% Speak English very well118 14.5% Speak English less than very well1.5% of residents speak other language at home 199 67.0% Speak English very well98 33.0% Speak English less than very well
English speakers - Born in the United States 95.8% of residents of North Ogden speak English at home.
3.1% of residents speak Spanish at home 158 84.5% Speak English very well29 15.5% Speak English less than very well1.4% of residents speak other language at home 86 100.0% Speak English very well
English speakers - Native, born elsewhere 74.8% of residents of North Ogden speak English at home.
9.4% of residents speak Spanish at home 19 100.0% Speak English very well5.9% of residents speak other language at home 12 100.0% Speak English very well
English speakers - Foreign-born 34.9% of residents of North Ogden speak English at home.
50.4% of residents speak Spanish at home 227 80.2% Speak English very well56 19.8% Speak English less than very well16.0% of residents speak other language at home 48 53.3% Speak English very well42 46.7% Speak English less than very well
White (Caucasian) - Speak only English Native:
96.7% (17,160)Foreign-born:
54.3% (102)
White (Caucasian) - Speak another language Native:
3.5% (628)Foreign-born:
56.5% (106)
Black or African American - Speak only English Native:
91.5% (91)Foreign-born:
100.0% (56)
Asian - Speak only English Native:
100.0% (94)Foreign-born:
18.2% (15)
Other race - Speak another language Native:
2.8% (11)Foreign-born:
99.0% (162)
Two or more races - Speak only English Native:
92.2% (877)Foreign-born:
38.8% (13)
Two or more races - Speak another language Native:
7.5% (71)Foreign-born:
51.8% (18)
White alone - Speak only English Native:
98.2% (16,842)Foreign-born:
95.3% (118)
White alone - Speak another language Native:
1.9% (333)Foreign-born:
19.9% (25)
Hispanic or Latino - Speak only English Native:
70.5% (898)Foreign-born:
0.2% (1)
Hispanic or Latino - Speak another language Native:
29.6% (376)Foreign-born:
100.0% (279)
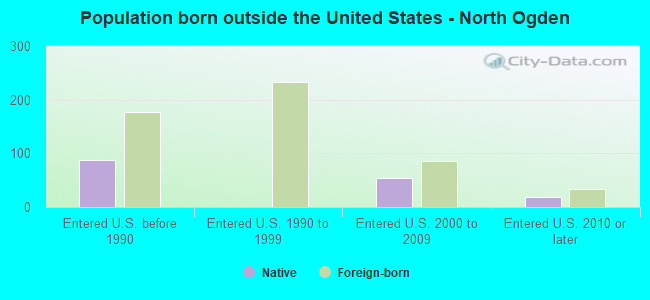
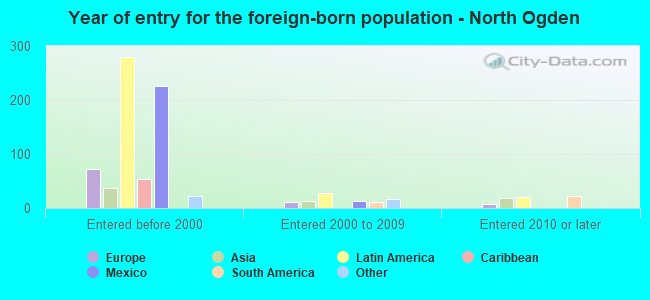
Foreign-born residents in North Ogden 570 residents are foreign born (1.6% Latin America , 0.5% Europe , 0.3% Asia ).
Marital status for residents in North Ogden Marital status - White (Caucasian) population 15 years and over
Males 31.0% Never married61.9% Now married0.1% Separated1.3% Widowed5.7% DivorcedFemales 25.7% Never married58.6% Now married1.4% Separated5.6% Widowed8.7% DivorcedWomen who gave birth in the past 12 months Now married:
91.3% (337)Unmarried:
8.7% (32)
Women who did not give birth in the past 12 months Now married:
49.0% (2,178)Unmarried:
51.0% (2,269)
Marital status - Black or African American population 15 years and over
Males 0.0% Never married98.6% Now married0.0% Separated0.0% Widowed1.4% DivorcedFemales 63.5% Never married36.5% Now married0.0% Separated0.0% Widowed0.0% DivorcedWomen who did not give birth in the past 12 months Now married:
0.0% (0)Unmarried:
100.0% (52)
Marital status - American Indian / Alaska Native population 15 years and over
Males 0.0% Never married100.0% Now married0.0% Separated0.0% Widowed0.0% DivorcedFemales 0.0% Never married73.1% Now married0.0% Separated0.0% Widowed26.9% DivorcedWomen who did not give birth in the past 12 months Now married:
61.1% (12)Unmarried:
38.9% (8)
Marital status - Asian population 15 years and over
Males 35.9% Never married64.1% Now married0.0% Separated0.0% Widowed0.0% DivorcedFemales 5.3% Never married86.8% Now married0.0% Separated0.0% Widowed7.9% DivorcedWomen who gave birth in the past 12 months Now married:
100.0% (4)Unmarried:
0.0% (0)
Women who did not give birth in the past 12 months Now married:
91.3% (47)Unmarried:
8.7% (4)
Marital status - Other race population 15 years and over
Males 9.7% Never married90.3% Now married0.0% Separated0.0% Widowed0.0% DivorcedFemales 3.0% Never married97.0% Now married0.0% Separated0.0% Widowed0.0% DivorcedWomen who gave birth in the past 12 months Now married:
100.0% (16)Unmarried:
0.0% (0)
Women who did not give birth in the past 12 months Now married:
95.7% (73)Unmarried:
4.3% (3)
Marital status - Two or more races population 15 years and over
Males 33.7% Never married37.3% Now married17.3% Separated0.0% Widowed11.6% DivorcedFemales 16.5% Never married60.4% Now married2.3% Separated16.9% Widowed3.8% DivorcedWomen who gave birth in the past 12 months Now married:
100.0% (13)Unmarried:
0.0% (0)
Women who did not give birth in the past 12 months Now married:
62.4% (105)Unmarried:
37.6% (64)
Marital status - White alone, not Hispanic / Latino population 15 years and over
Males 29.3% Never married63.9% Now married0.1% Separated0.8% Widowed5.9% DivorcedFemales 24.4% Never married59.7% Now married1.4% Separated5.8% Widowed8.7% DivorcedWomen who gave birth in the past 12 months Now married:
91.1% (336)Unmarried:
8.9% (33)
Women who did not give birth in the past 12 months Now married:
50.4% (2,129)Unmarried:
49.6% (2,100)
Marital status - Hispanic or Latino population 15 years and over
Males 46.7% Never married41.8% Now married0.0% Separated6.5% Widowed5.0% DivorcedFemales 42.2% Never married51.9% Now married1.3% Separated0.0% Widowed4.7% DivorcedWomen who gave birth in the past 12 months Now married:
100.0% (32)Unmarried:
0.0% (0)
Women who did not give birth in the past 12 months Now married:
42.4% (170)Unmarried:
57.6% (230)
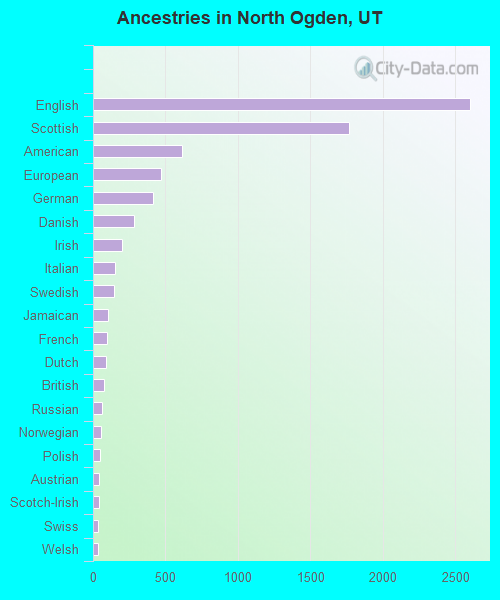
Ancestries in North Ogden
2,603 28.2% English1,770 19.2% Scottish613 6.6% American466 5.0% European413 4.5% German286 3.1% Danish202 2.2% Irish154 1.7% Italian146 1.6% Swedish101 1.1% Jamaican99 1.1% French89 1.0% Dutch77 0.8% British59 0.6% Russian56 0.6% Norwegian51 0.6% Polish39 0.4% Austrian38 0.4% Scotch-Irish35 0.4% Swiss35 0.4% Welsh21 0.2% Scandinavian7 0.08% French Canadian7 0.08% Hungarian4 0.04% Eastern European4 0.04% Slovene2 0.02% Czech
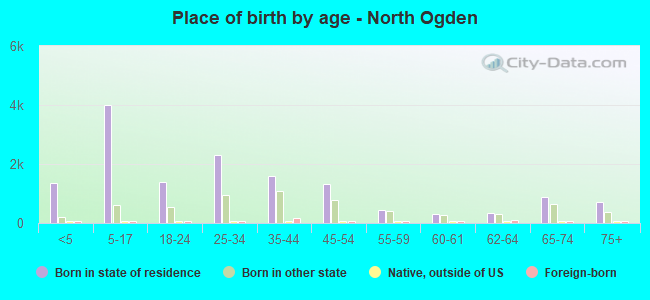
Children Nativity (place of birth) in North Ogden
Children under 6 years - Living with two parents Both parents native 1,314 100.0% NativeOne native, one foreign-born parent 50 100.0% NativeChildren under 6 years - Living with one parent Native parent 267 100.0% NativeForeign-born parent 86 100.0% NativeChildren 6 to 17 years - Living with two parents Both parents native 3,208 100.0% NativeBoth parents foreign-born 2 100.0% Foreign-bornOne native, one foreign-born parent 294 98.0% Native6 2.0% Foreign-bornChildren 6 to 17 years - Living with one parent Native parent 787 100.0% NativeForeign-born parent 61 47.3% Native68 52.7% Foreign-born
Grandparents responsible for own grandchildren in North Ogden
Grandparents (30 to 59 years) White / Caucasian 42 19.9% Responsible for grandchildren169 80.1% Not responsible for grandchildrenOther race 2 100.0% Not responsible for grandchildrenWhite alone, not Hispanic / Latino 40 20.3% Responsible for grandchildren158 79.7% Not responsible for grandchildrenHispanic or Latino 2 100.0% Not responsible for grandchildrenGrandparents (60 years and over) White / Caucasian 107 52.3% Responsible for grandchildren97 47.7% Not responsible for grandchildrenOther race 6 100.0% Not responsible for grandchildrenWhite alone, not Hispanic / Latino 108 49.8% Responsible for grandchildren109 50.2% Not responsible for grandchildrenHispanic or Latino 4 100.0% Not responsible for grandchildren