Races in North Myrtle Beach, South Carolina (SC) Detailed Stats
Ancestries, Foreign-born residents, place of birth
Settings
X


Recent posts about races in North Myrtle Beach, South Carolina on our local forum with over 2,400,000 registered users:
 | North Myrtle Beach vs. Myrtle Beach (11 replies) |
| Longs SC to Coastal Beach (7 replies) |
| Seafood Restaurants (2 replies) |
| Trying to Decide between MB or Tampa (11 replies) |
| New to the forum and will be new to SC soon (6 replies) |
| Retirees: Would you still relocate there? (7 replies) |
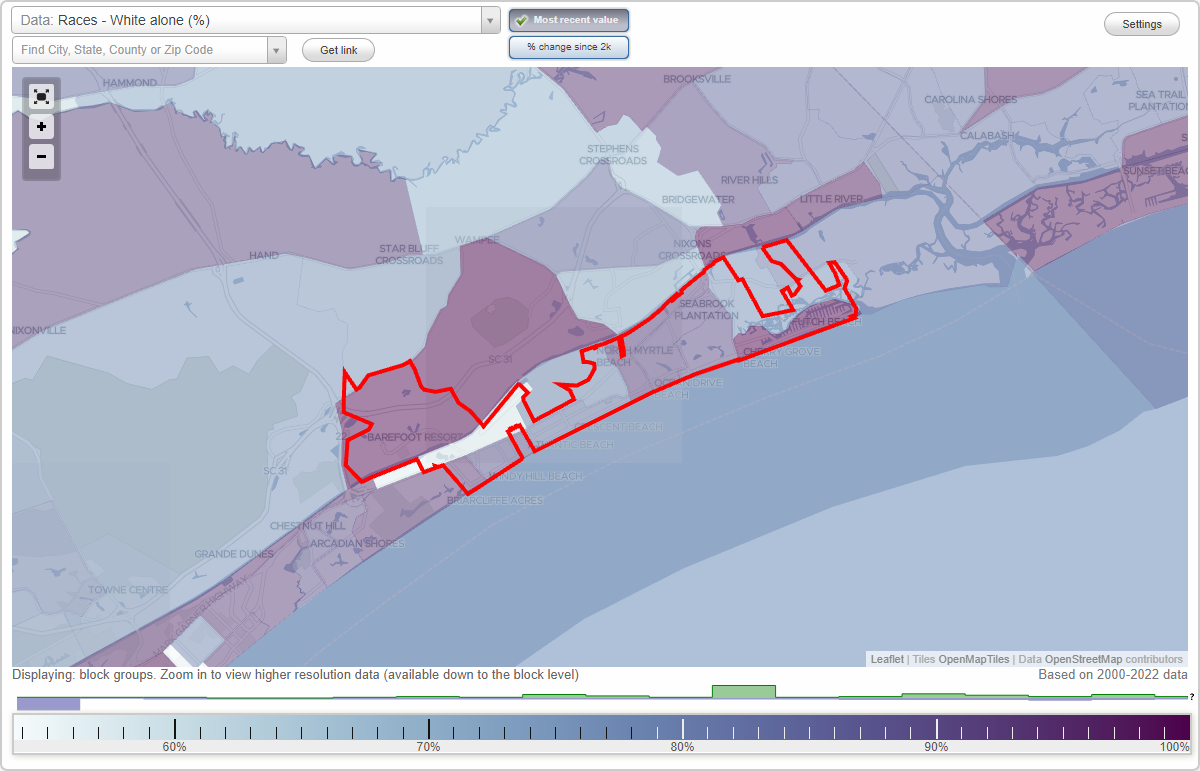
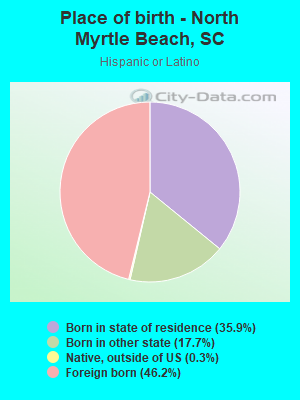
According to 2022 data, the most numerous races in North Myrtle Beach, SC are White alone (17,547 residents), Black alone (180 residents), and Hispanic (1,446 residents). 91.4% of North Myrtle Beach residents speak English at home. 7.3% of North Myrtle Beach, SC residents are foreign-born (4.0% born in Latin America, 1.7% born in Asia, 1.1% born in Europe), which is 31.4% greater than the foreign-born rate of 5.0% across the entire state of South Carolina.
Race distribution in North Myrtle Beach
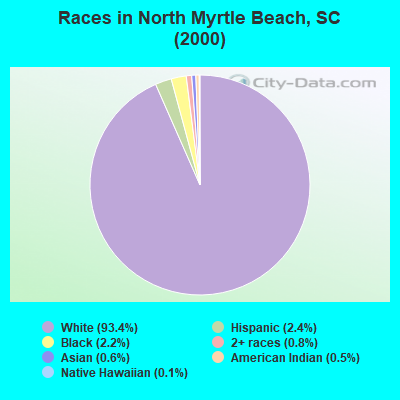
2000
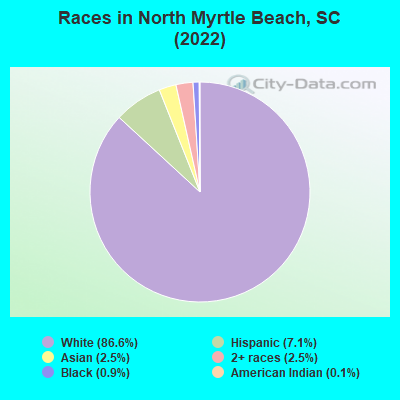
2022

- 10,24993.4%White alone
- 2592.4%Hispanic
- 2462.2%Black alone
- 830.8%Two or more races
- 670.6%Asian alone
- 520.5%American Indian alone
- 110.1%Native Hawaiian and Other
Pacific Islander alone - 70.06%Other race alone
-
- 17,54786.6%White alone
- 1,4467.1%Hispanic
- 5142.5%Two or more races
- 5152.5%Asian alone
- 1800.9%Black alone
- 280.1%American Indian alone
2000
2022
-
- 2,652,29166.1%White alone
- 1,178,48629.4%Black alone
- 95,0762.4%Hispanic
- 35,5680.9%Asian alone
- 33,2900.8%Two or more races
- 12,7650.3%American Indian alone
- 3,2660.08%Other race alone
- 1,2700.03%Native Hawaiian and Other
Pacific Islander alone

-
- 3,301,73962.5%White alone
- 1,313,29024.9%Black alone
- 343,7836.5%Hispanic
- 190,5083.6%Two or more races
- 89,8881.7%Asian alone
- 29,3900.6%Other race alone
- 12,1120.2%American Indian alone
- 1,9240.04%Native Hawaiian and Other
Pacific Islander alone

Income and house value in North Myrtle Beach
- Median household income in 2022
- $70,031White non-Hispanic householders
- $30,229Black householders
- $101,484American Indian and Alaska Native householders
- $152,227Some other race householders
- $138,606Two or more races householders
- Median 2022 house value
- $463,934White Non-Hispanic householders
- $527,197Black or African American householders
- $446,090American Indian or Alaska Native householders
- over $1,000,000Asian householders
- $191,088Two or more races householders
- $364,983Hispanic or Latino householders
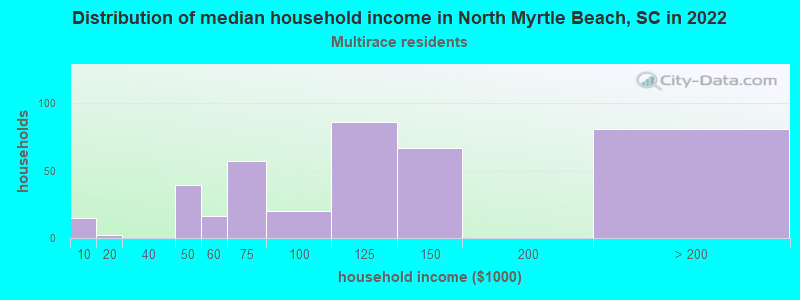
Household income for White non-Hispanic householders

Household income for Black householders

Household income for American Indian and Alaska Native householders

Household income for Asian householders

Household income for Some other race householders

Household income for Two or more races householders
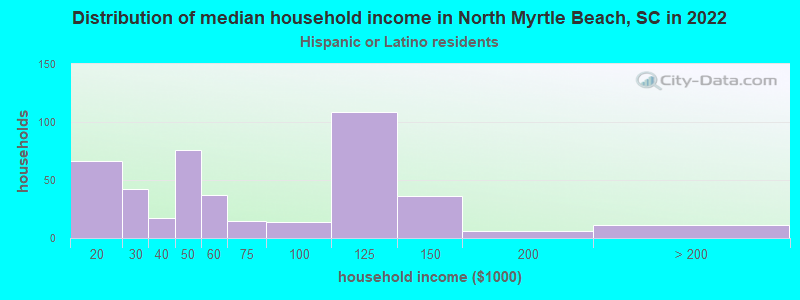
Household income for Hispanic or Latino race householders
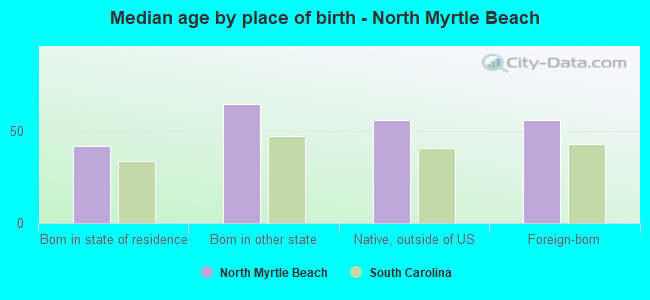
Median age by race in North Myrtle Beach
- 64.0Median age for White residents
- 63.4Males
- 64.5Females
- 44.8Median age for Black or African American residents
- 41.6Males
- 76.5Females
- 15.9Median age for American Indian / Alaska Native residents
- 35.1Males
- 38.4Females
- 33.3Median age for Asian residents
- 39.4Males
- 18.4Females
- -698,412,697.7Median age for Native Hawaiian / Pacific Islander residents
- -666,666,666.0Males
- -666,666,666.0Females
- 34.2Median age for Other race residents
- 34.2Males
- 13.8Females
- 50.4Median age for Two or more races residents
- 65.0Males
- 35.7Females
- 64.0Median age for White alone residents
- 64.1Males
- 64.3Females
- 34.5Median age for Hispanic or Latino residents
- 36.8Males
- 26.5Females
Owner/renter occupied households by race in North Myrtle Beach
- House owners and renters - White residents
- 8,11286.7%Owner occupied
- 1,24113.3%Renter occupied
- House owners and renters - Black or African American residents
- 3939.0%Owner occupied
- 6161.0%Renter occupied
- House owners and renters - American Indian / Alaska Native residents
- 25100.0%Owner occupied
- House owners and renters - Asian residents
- 18686.4%Owner occupied
- 2913.6%Renter occupied
- House owners and renters - Other race residents
- 37100.0%Owner occupied
- House owners and renters - Two or more races residents
- 17448.5%Owner occupied
- 18551.5%Renter occupied
- House owners and renters - White alone residents
- 8,06887.6%Owner occupied
- 1,13812.4%Renter occupied
- House owners and renters - Hispanic or Latino residents
- 13434.1%Owner occupied
- 26065.9%Renter occupied
Language usage in North Myrtle Beach
- English speakers - Total
- 91.4% of residents of North Myrtle Beach speak English at home.
- 4.8% of residents speak Spanish at home
- 38741.4%Speak English very well
- 54758.6%Speak English less than very well
- 4.0% of residents speak other language at home
- 49462.8%Speak English very well
- 29337.2%Speak English less than very well
- English speakers - Born in the United States
- 99.1% of residents of North Myrtle Beach speak English at home.
- 0.6% of residents speak Spanish at home
- 8895.7%Speak English very well
- 44.3%Speak English less than very well
- 0.5% of residents speak other language at home
- 7693.8%Speak English very well
- 56.2%Speak English less than very well
- English speakers - Native, born elsewhere
- 44.2% of residents of North Myrtle Beach speak English at home.
- 48.9% of residents speak other language at home
- 5660.2%Speak English very well
- 3739.8%Speak English less than very well
- English speakers - Foreign-born
- 23.5% of residents of North Myrtle Beach speak English at home.
- 40.7% of residents speak Spanish at home
- 19128.3%Speak English very well
- 48471.7%Speak English less than very well
- 34.3% of residents speak other language at home
- 36263.7%Speak English very well
- 20636.3%Speak English less than very well
White (Caucasian) - Speak only English
| Native: | 99.7% (16,625) |
| Foreign-born: | 57.2% (413) |
White (Caucasian) - Speak another language
| Native: | 0.7% (123) |
| Foreign-born: | 45.3% (327) |
Asian - Speak another language
| Native: | 100.0% (105) |
| Foreign-born: | 74.6% (301) |
Other race - Speak another language
| Native: | 14.3% (15) |
| Foreign-born: | 98.5% (26) |
Two or more races - Speak another language
| Native: | 29.2% (200) |
| Foreign-born: | 100.0% (551) |
White alone - Speak only English
| Native: | 99.5% (16,481) |
| Foreign-born: | 78.9% (359) |
White alone - Speak another language
| Native: | 0.7% (111) |
| Foreign-born: | 27.5% (125) |
Hispanic or Latino - Speak only English
| Native: | 70.7% (393) |
| Foreign-born: | 7.5% (47) |
Hispanic or Latino - Speak another language
| Native: | 31.8% (177) |
| Foreign-born: | 92.4% (578) |
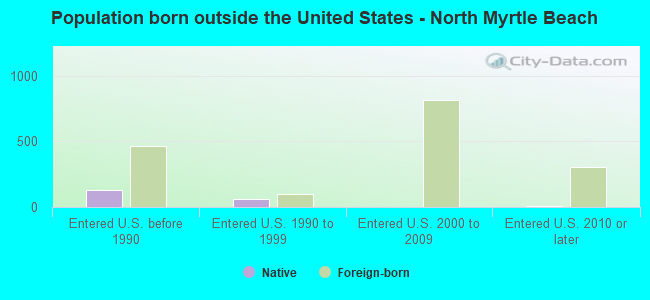
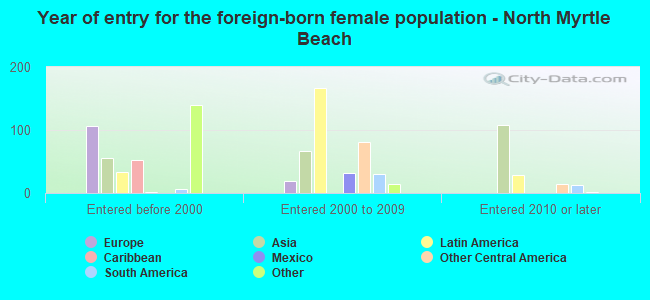
Foreign-born residents in North Myrtle Beach
1,476 residents are foreign born (4.0% Latin America, 1.7% Asia, 1.1% Europe).
| This city: | 7.3% |
| South Carolina: | 5.3% |

Marital status for residents in North Myrtle Beach
Marital status - White (Caucasian) population 15 years and over
- Males
- 19.5%Never married
- 57.7%Now married
- 1.5%Separated
- 3.9%Widowed
- 17.4%Divorced
- Females
- 12.1%Never married
- 56.5%Now married
- 4.7%Separated
- 14.4%Widowed
- 12.3%Divorced
Women who gave birth in the past 12 months
| Now married: | 87.2% (40) |
| Unmarried: | 12.8% (6) |
Women who did not give birth in the past 12 months
| Now married: | 55.2% (981) |
| Unmarried: | 44.8% (796) |
Marital status - Black or African American population 15 years and over
- Males
- 60.9%Never married
- 29.0%Now married
- 0.0%Separated
- 0.0%Widowed
- 10.1%Divorced
- Females
- 2.6%Never married
- 38.5%Now married
- 0.0%Separated
- 0.0%Widowed
- 59.0%Divorced
Women who did not give birth in the past 12 months
| Now married: | 0.0% (0) |
| Unmarried: | 100.0% (1) |
Marital status - American Indian / Alaska Native population 15 years and over
- Males
- 21.4%Never married
- 0.0%Now married
- 0.0%Separated
- 0.0%Widowed
- 78.6%Divorced
- Females
- 64.3%Never married
- 0.0%Now married
- 17.9%Separated
- 17.9%Widowed
- 0.0%Divorced
Women who did not give birth in the past 12 months
| Now married: | 0.0% (0) |
| Unmarried: | 100.0% (25) |
Marital status - Asian population 15 years and over
- Males
- 26.7%Never married
- 73.3%Now married
- 0.0%Separated
- 0.0%Widowed
- 0.0%Divorced
- Females
- 49.1%Never married
- 37.2%Now married
- 13.7%Separated
- 0.0%Widowed
- 0.0%Divorced
Women who gave birth in the past 12 months
| Now married: | 100.0% (6) |
| Unmarried: | 0.0% (0) |
Women who did not give birth in the past 12 months
| Now married: | 36.2% (70) |
| Unmarried: | 63.8% (123) |
Marital status - Other race population 15 years and over
- Males
- 0.0%Never married
- 43.5%Now married
- 4.3%Separated
- 0.0%Widowed
- 52.2%Divorced
- Females
- 0.0%Never married
- 100.0%Now married
- 0.0%Separated
- 0.0%Widowed
- 0.0%Divorced
Women who did not give birth in the past 12 months
| Now married: | 100.0% (11) |
| Unmarried: | 0.0% (0) |
Marital status - Two or more races population 15 years and over
- Males
- 63.8%Never married
- 34.7%Now married
- 0.0%Separated
- 0.0%Widowed
- 1.5%Divorced
- Females
- 19.1%Never married
- 28.8%Now married
- 7.1%Separated
- 19.1%Widowed
- 25.8%Divorced
Women who did not give birth in the past 12 months
| Now married: | 41.2% (118) |
| Unmarried: | 58.8% (169) |
Marital status - White alone, not Hispanic / Latino population 15 years and over
- Males
- 18.3%Never married
- 58.1%Now married
- 1.6%Separated
- 4.1%Widowed
- 17.9%Divorced
- Females
- 11.6%Never married
- 56.5%Now married
- 4.5%Separated
- 14.6%Widowed
- 12.7%Divorced
Women who gave birth in the past 12 months
| Now married: | 87.2% (42) |
| Unmarried: | 12.8% (6) |
Women who did not give birth in the past 12 months
| Now married: | 53.5% (894) |
| Unmarried: | 46.5% (776) |
Marital status - Hispanic or Latino population 15 years and over
- Males
- 62.5%Never married
- 34.2%Now married
- 0.0%Separated
- 0.0%Widowed
- 3.3%Divorced
- Females
- 19.0%Never married
- 52.1%Now married
- 9.9%Separated
- 12.2%Widowed
- 6.8%Divorced
Women who did not give birth in the past 12 months
| Now married: | 68.6% (215) |
| Unmarried: | 31.4% (98) |
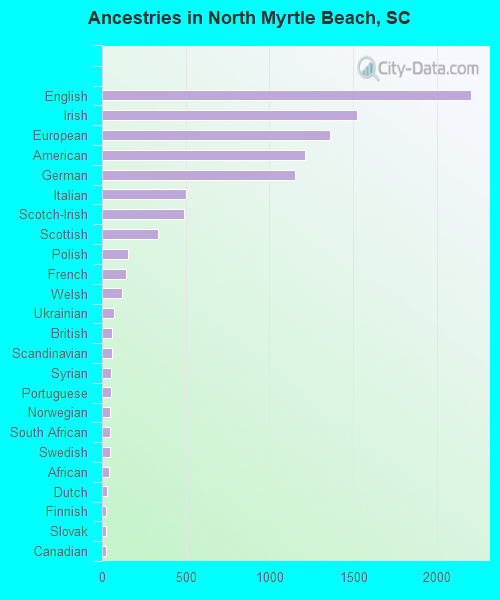
Ancestries in North Myrtle Beach

- 2,20119.2%English
- 1,52013.3%Irish
- 1,36211.9%European
- 1,21410.6%American
- 1,15010.1%German
- 5024.4%Italian
- 4894.3%Scotch-Irish
- 3372.9%Scottish
- 1561.4%Polish
- 1421.2%French
- 1191.0%Welsh
- 700.6%Ukrainian
- 610.5%British
- 590.5%Scandinavian
- 540.5%Syrian
- 530.5%Portuguese
- 500.4%Norwegian
- 500.4%South African
- 480.4%Swedish
- 420.4%African
- 290.3%Dutch
- 260.2%Finnish
- 250.2%Slovak
- 230.2%Canadian
- 180.2%Eastern European
- 170.1%Croatian
- 160.1%Russian
- 150.1%Armenian
- 150.1%Hungarian
- 130.1%Iranian
- 120.1%Alsatian
- 90.08%Lithuanian
- 80.07%French Canadian
- 70.06%Lebanese
- 60.05%Northern European
- 50.04%Slovene
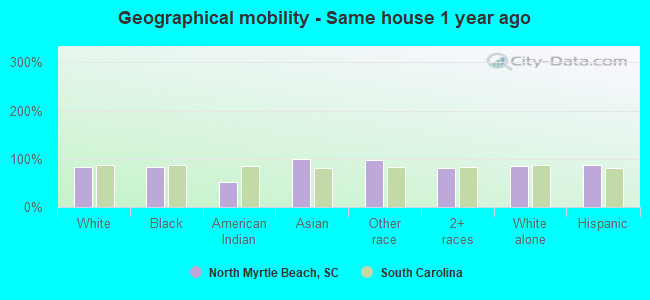
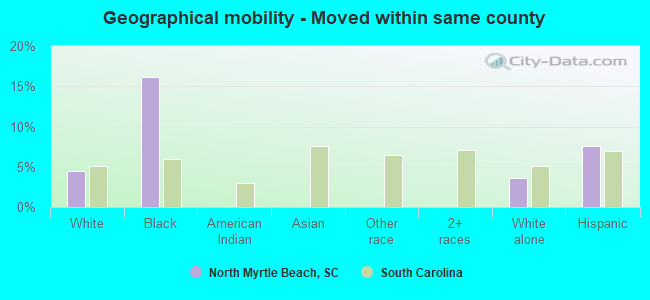
Geographical mobility in North Myrtle Beach

- Same house 1 year ago
- 15,08184.0%White (Caucasian)
- 15283.9%Black or African American
- 4551.8%American Indian / Alaska Native
- 48899.7%Asian
- 9698.4%Other race
- 1,00280.2%Two or more races
- 14,80584.6%White alone, not Hispanic / Latino
- 1,26287.6%Hispanic or Latino
-
- Moved within same county
- 8054.5%White / Caucasian
- 2916.2%Black or African American
- 6393.7%White alone, not Hispanic / Latino
- 1097.5%Hispanic or Latino
-
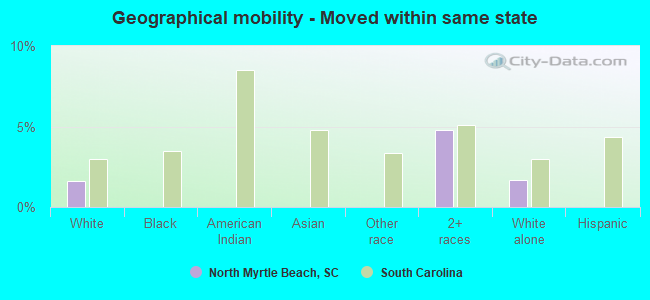
- Moved within same state
- 2861.6%White / Caucasian
- 604.8%Two or more races
- 2921.7%White alone, not Hispanic / Latino
-
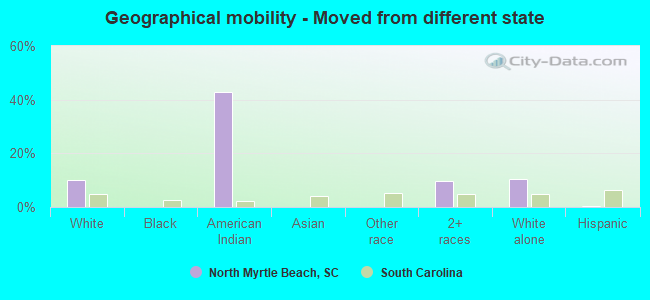
- Moved from different state
- 1,82310.2%White / Caucasian
- 3743.0%American Indian / Alaska Native
- 1239.8%Two or more races
- 1,81010.3%White alone, not Hispanic / Latino
- 50.4%Hispanic or Latino
-
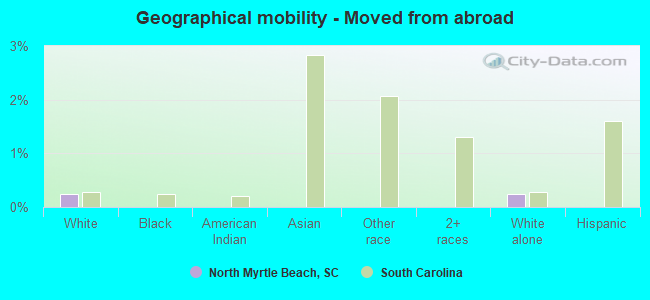
- Moved from abroad
- 420.2%White
- 430.2%White alone, not Hispanic / Latino
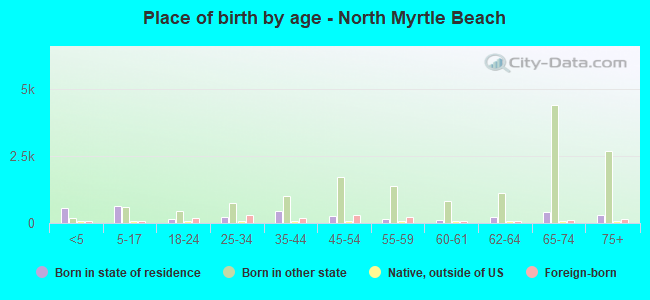
Children Nativity (place of birth) in North Myrtle Beach
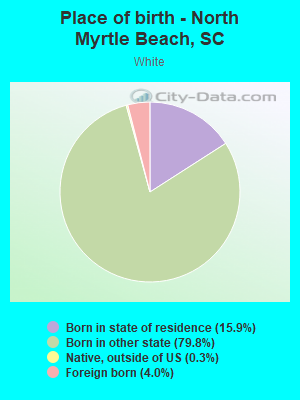
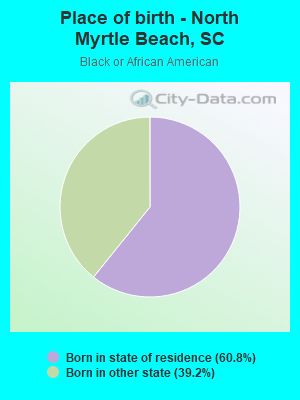
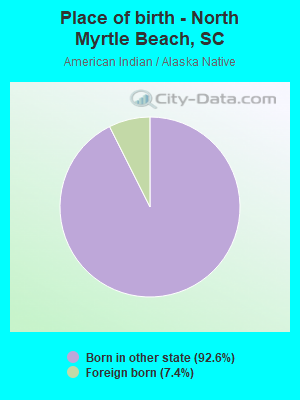
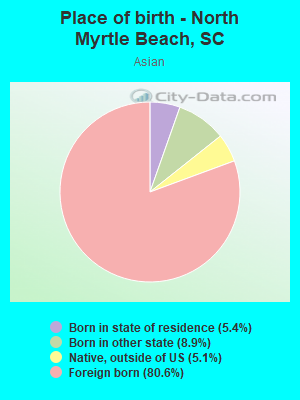
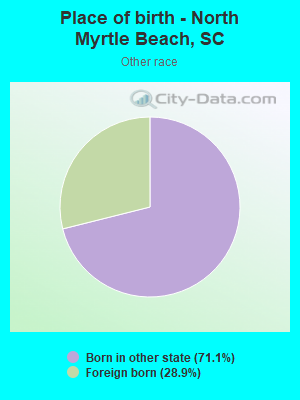
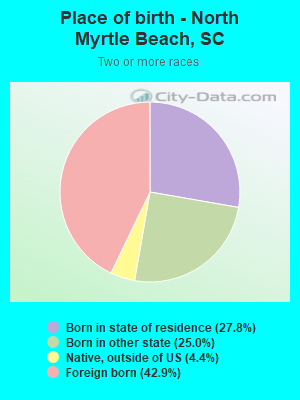
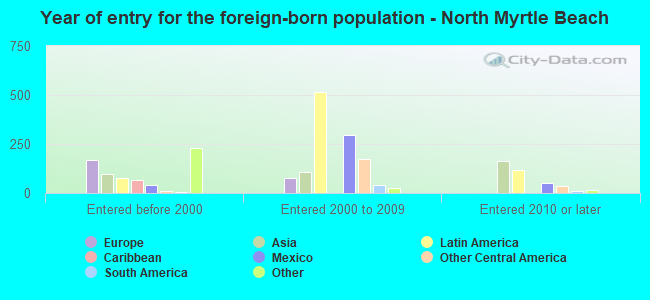
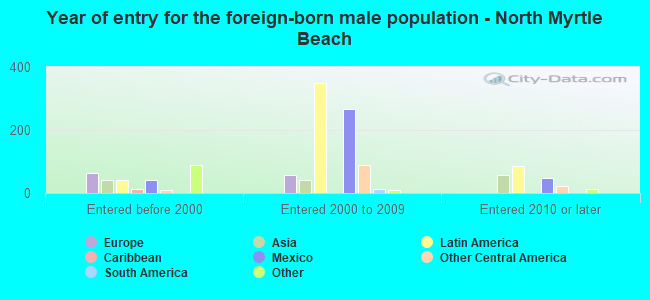
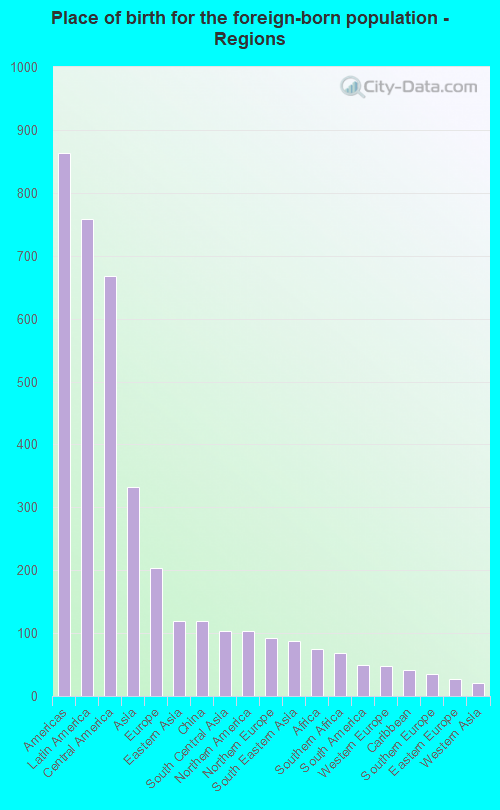
Place of birth for residents in North Myrtle Beach
![Place of birth for the foreign-born population - Regions]()
- 864Americas
- 759Latin America
- 668Central America
- 332Asia
- 203Europe
- 120Eastern Asia
- 120China
- 104South Central Asia
- 104Northern America
- 92Northern Europe
- 87South Eastern Asia
- 75Africa
- 68Southern Africa
- 49South America
- 48Western Europe
- 41Caribbean
- 35Southern Europe
- 27Eastern Europe
- 21Western Asia
- 7Eastern Africa
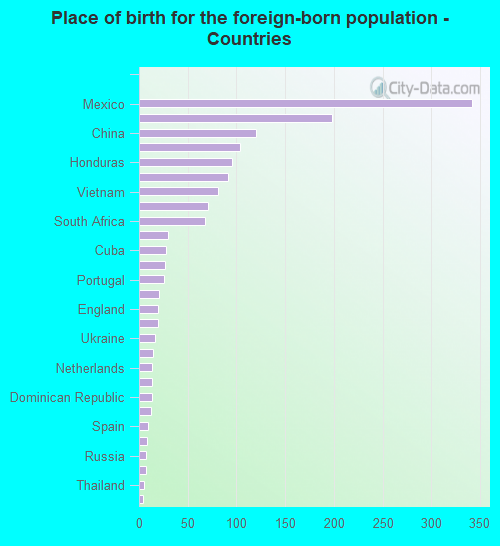
![Place of birth for the foreign-born population - Countries]()
- 342Mexico
- 198Guatemala
- 120China
- 104Canada
- 95Honduras
- 91India
- 81Vietnam
- 71United Kingdom
- 68South Africa
- 30Brazil
- 28Cuba
- 27Germany
- 26Portugal
- 21El Salvador
- 20England
- 19Colombia
- 16Ukraine
- 14Israel
- 13Netherlands
- 13Iran
- 13Dominican Republic
- 12Panama
- 9Spain
- 8France
- 7Russia
- 7Iraq
- 5Thailand
- 4Lithuania
Grandparents responsible for own grandchildren in North Myrtle Beach
Zip codes: 29582.