Races in North Marshall, Oklahoma (OK) Detailed Stats
Ancestries, Foreign-born residents, place of birth
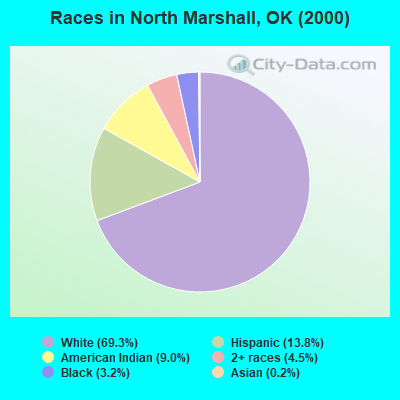
Race distribution in North Marshall

- 5,03569.3%White alone
- 1,00013.8%Hispanic
- 6509.0%American Indian alone
- 3274.5%Two or more races
- 2293.2%Black alone
- 160.2%Asian alone
- 30.04%Other race alone
- 10.01%Native Hawaiian and Other
Pacific Islander alone
2000
2022
-
- 2,556,36874.1%White alone
- 266,1587.7%American Indian alone
- 257,9817.5%Black alone
- 179,3045.2%Hispanic
- 140,2494.1%Two or more races
- 46,1721.3%Asian alone
- 2,3220.07%Other race alone
- 2,1000.06%Native Hawaiian and Other
Pacific Islander alone

-
- 2,517,40362.6%White alone
- 486,69212.1%Hispanic
- 364,4539.1%Two or more races
- 273,6506.8%American Indian alone
- 268,5436.7%Black alone
- 92,6722.3%Asian alone
- 10,7860.3%Other race alone
- 5,6010.1%Native Hawaiian and Other
Pacific Islander alone

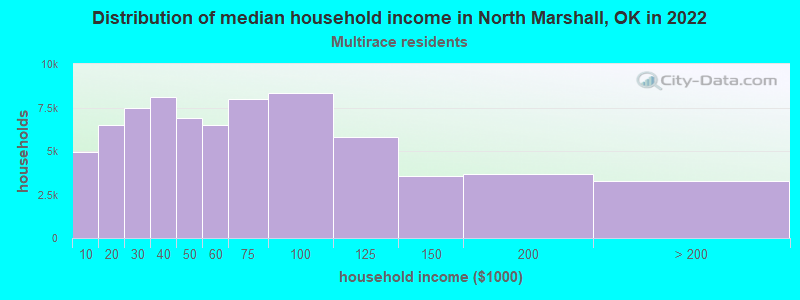
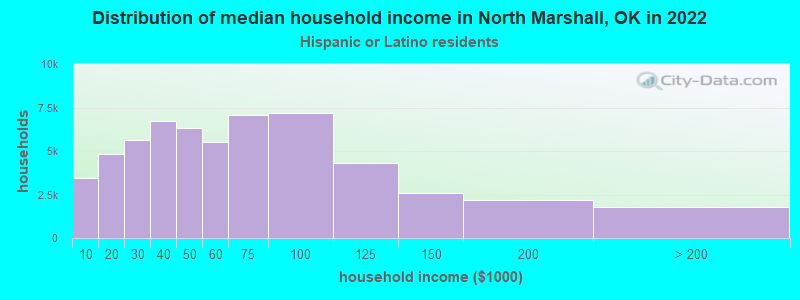
Income and house value in North Marshall
- Median household income in 2022
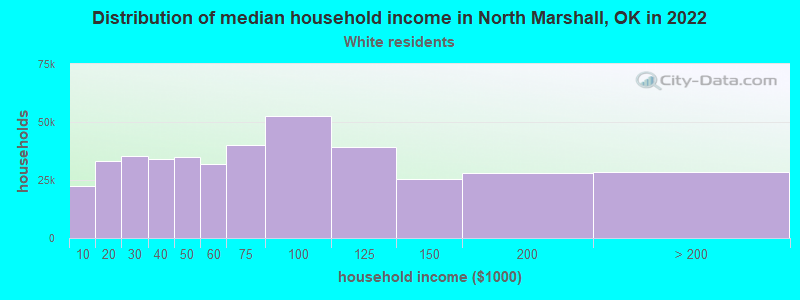
- $46,707White non-Hispanic householders
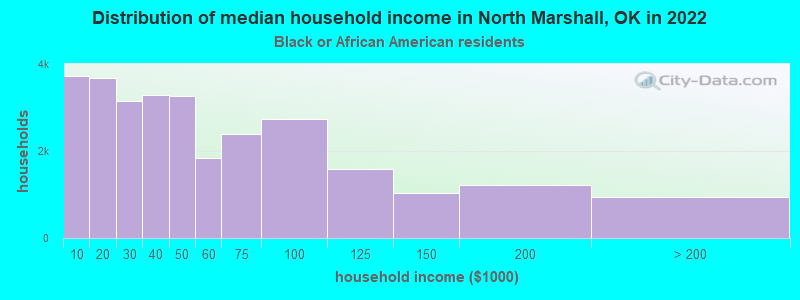
- $25,140Black householders
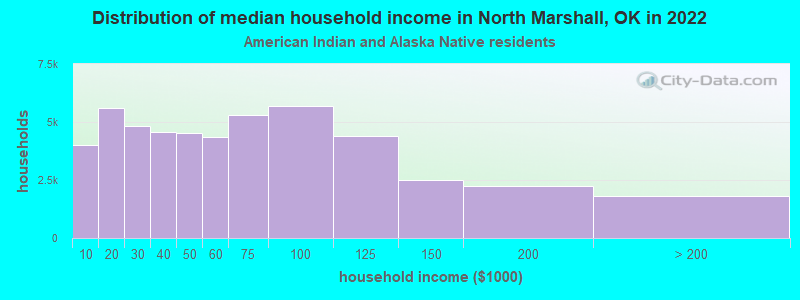
- $53,233American Indian and Alaska Native householders
- $47,970Some other race householders
- $44,563Two or more races householders
- $49,325Hispanic or Latino race householders
- Median 2022 house value
- $145,067White Non-Hispanic householders
- $113,936Black or African American householders
- $138,218American Indian or Alaska Native householders
- $102,418Some other race householders
- $112,380Two or more races householders
- $107,399Hispanic or Latino householders
Household income for White non-Hispanic householders
Household income for Black householders
Household income for American Indian and Alaska Native householders
Household income for Two or more races householders
Household income for Hispanic or Latino race householders
Zip code: 73446