Races in North Lindenhurst, New York (NY) Detailed Stats
Data:
Races - White alone (%)
Races - White alone (% change since 2000)
Races - Black alone (%)
Races - Black alone (% change since 2000)
Races - American Indian alone (%)
Races - American Indian alone (% change since 2000)
Races - Asian alone (%)
Races - Asian alone (% change since 2000)
Races - Hispanic (%)
Races - Hispanic (% change since 2000)
Races - Native Hawaiian and Other Pacific Islander alone (%)
Races - Native Hawaiian and Other Pacific Islander alone (% change since 2000)
Races - Two or more races(%)
Races - Two or more races(% change since 2000)
Races - Other race alone (%)
Races - Other race alone (% change since 2000)
Racial diversity
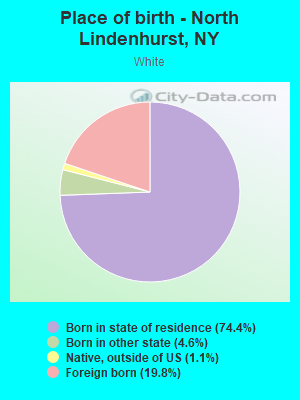
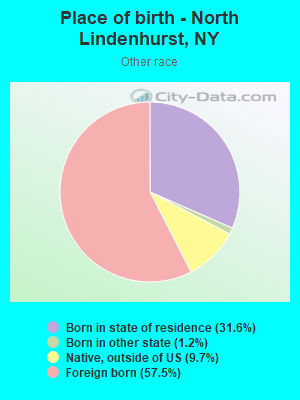
Place of birth - Born in state of residence (%)
Place of birth - Born in state of residence (%) - White
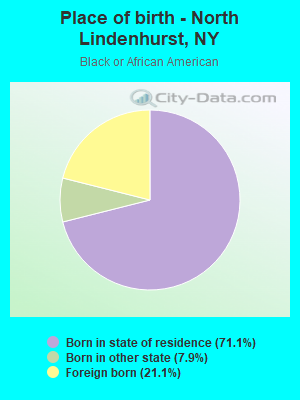
Place of birth - Born in state of residence (%) - Black or African American
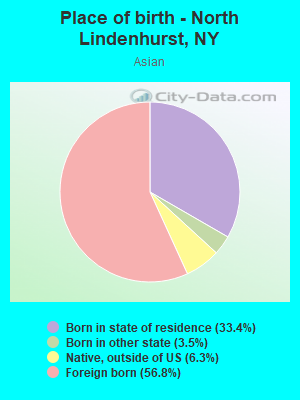
Place of birth - Born in state of residence (%) - Asian
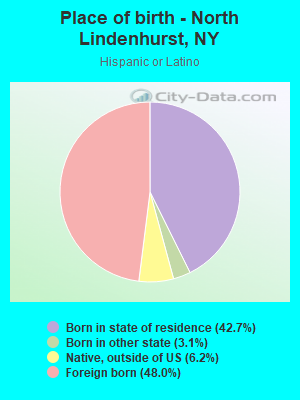
Place of birth - Born in state of residence (%) - Hispanic or Latino
Place of birth - Born in state of residence (%) - American Indian and Alaska Native
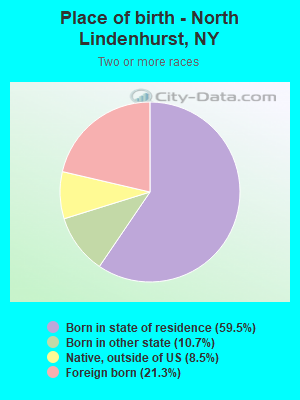
Place of birth - Born in state of residence (%) - Multirace
Place of birth - Born in state of residence (%) - Other Race
Place of birth - Born in other state (%)
Place of birth - Born in other state (%) - White
Place of birth - Born in other state (%) - Black or African American
Place of birth - Born in other state (%) - Asian
Place of birth - Born in other state (%) - Hispanic or Latino
Place of birth - Born in other state (%) - American Indian and Alaska Native
Place of birth - Born in other state (%) - Multirace
Place of birth - Born in other state (%) - Other Race
Place of birth - Native, outside of US (%)
Place of birth - Native, outside of US (%) - White
Place of birth - Native, outside of US (%) - Black or African American
Place of birth - Native, outside of US (%) - Asian
Place of birth - Native, outside of US (%) - Hispanic or Latino
Place of birth - Native, outside of US (%) - American Indian and Alaska Native
Place of birth - Native, outside of US (%) - Multirace
Place of birth - Native, outside of US (%) - Other Race
Place of birth - Foreign born (%)
Place of birth - Foreign born (%) - White
Place of birth - Foreign born (%) - Black or African American
Place of birth - Foreign born (%) - Asian
Place of birth - Foreign born (%) - Hispanic or Latino
Place of birth - Foreign born (%) - American Indian and Alaska Native
Place of birth - Foreign born (%) - Multirace
Place of birth - Foreign born (%) - Other Race
Residents speaking English at home (%)
Residents speaking English at home - Born in the United States (%)
Residents speaking English at home - Native, born elsewhere (%)
Residents speaking English at home - Foreign born (%)
Residents speaking Spanish at home (%)
Residents speaking Spanish at home - Born in the United States (%)
Residents speaking Spanish at home - Native, born elsewhere (%)
Residents speaking Spanish at home - Foreign born (%)
Residents speaking other language at home (%)
Residents speaking other language at home - Born in the United States (%)
Residents speaking other language at home - Native, born elsewhere (%)
Residents speaking other language at home - Foreign born (%)
Marital status - Never married (%)
Marital status - Now married (%)
Marital status - Separated (%)
Marital status - Widowed (%)
Marital status - Divorced (%)
Ancestries Reported - Arab (%)
Ancestries Reported - Czech (%)
Ancestries Reported - Danish (%)
Ancestries Reported - Dutch (%)
Ancestries Reported - English (%)
Ancestries Reported - French (%)
Ancestries Reported - French Canadian (%)
Ancestries Reported - German (%)
Ancestries Reported - Greek (%)
Ancestries Reported - Hungarian (%)
Ancestries Reported - Irish (%)
Ancestries Reported - Italian (%)
Ancestries Reported - Lithuanian (%)
Ancestries Reported - Norwegian (%)
Ancestries Reported - Polish (%)
Ancestries Reported - Portuguese (%)
Ancestries Reported - Russian (%)
Ancestries Reported - Scotch-Irish (%)
Ancestries Reported - Scottish (%)
Ancestries Reported - Slovak (%)
Ancestries Reported - Subsaharan African (%)
Ancestries Reported - Swedish (%)
Ancestries Reported - Swiss (%)
Ancestries Reported - Ukrainian (%)
Ancestries Reported - United States (%)
Ancestries Reported - Welsh (%)
Ancestries Reported - West Indian (%)
Ancestries Reported - Other (%)
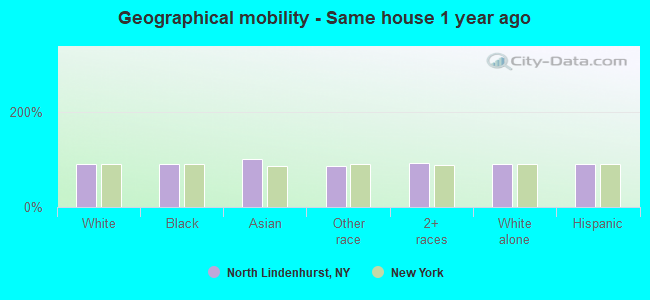
Geographical mobility - Same house 1 year ago (%)
Geographical mobility - Same house 1 year ago (%) - White
Geographical mobility - Same house 1 year ago (%) - Black or African American
Geographical mobility - Same house 1 year ago (%) - Asian
Geographical mobility - Same house 1 year ago (%) - Hispanic or Latino
Geographical mobility - Same house 1 year ago (%) - American Indian and Alaska Native
Geographical mobility - Same house 1 year ago (%) - Multirace
Geographical mobility - Same house 1 year ago (%) - Other Race
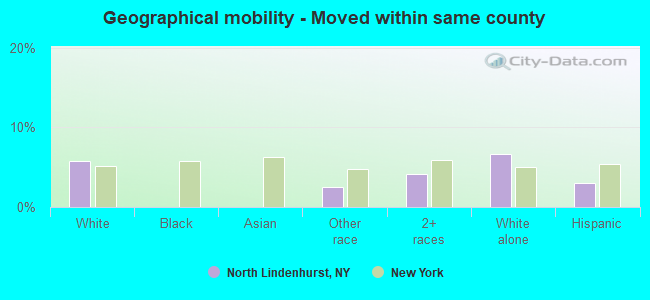
Geographical mobility - Moved within same county (%)
Geographical mobility - Moved within same county (%) - White
Geographical mobility - Moved within same county (%) - Black or African American
Geographical mobility - Moved within same county (%) - Asian
Geographical mobility - Moved within same county (%) - Hispanic or Latino
Geographical mobility - Moved within same county (%) - American Indian and Alaska Native
Geographical mobility - Moved within same county (%) - Multirace
Geographical mobility - Moved within same county (%) - Other Race
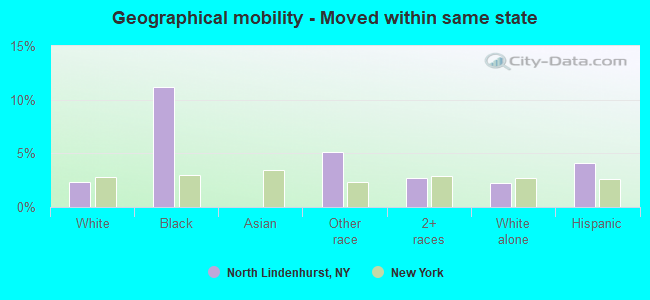
Geographical mobility - Moved from different county within same state (%)
Geographical mobility - Moved from different county within same state (%) - White
Geographical mobility - Moved from different county within same state (%) - Black or African American
Geographical mobility - Moved from different county within same state (%) - Asian
Geographical mobility - Moved from different county within same state (%) - Hispanic or Latino
Geographical mobility - Moved from different county within same state (%) - American Indian and Alaska Native
Geographical mobility - Moved from different county within same state (%) - Multirace
Geographical mobility - Moved from different county within same state (%) - Other Race
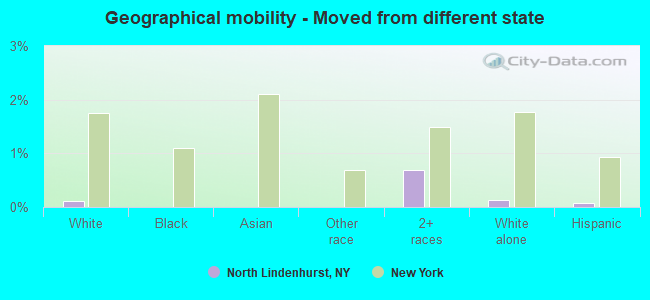
Geographical mobility - Moved from different state (%)
Geographical mobility - Moved from different state (%) - White
Geographical mobility - Moved from different state (%) - Black or African American
Geographical mobility - Moved from different state (%) - Asian
Geographical mobility - Moved from different state (%) - Hispanic or Latino
Geographical mobility - Moved from different state (%) - American Indian and Alaska Native
Geographical mobility - Moved from different state (%) - Multirace
Geographical mobility - Moved from different state (%) - Other Race
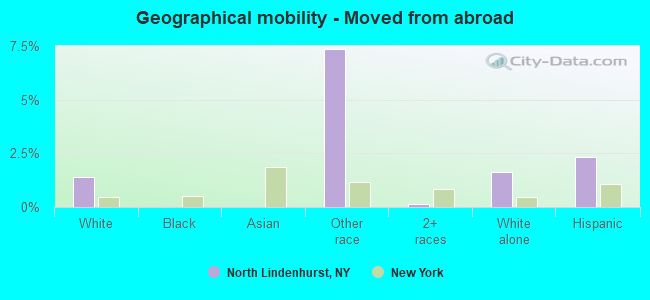
Geographical mobility - Moved from abroad (%)
Geographical mobility - Moved from abroad (%) - White
Geographical mobility - Moved from abroad (%) - Black or African American
Geographical mobility - Moved from abroad (%) - Asian
Geographical mobility - Moved from abroad (%) - Hispanic or Latino
Geographical mobility - Moved from abroad (%) - American Indian and Alaska Native
Geographical mobility - Moved from abroad (%) - Multirace
Geographical mobility - Moved from abroad (%) - Other Race
Place of birth for the foreign-born population - Ireland (%)
Place of birth for the foreign-born population - Denmark (%)
Place of birth for the foreign-born population - Norway (%)
Place of birth for the foreign-born population - Sweden (%)
Place of birth for the foreign-born population - United Kingdom (%)
Place of birth for the foreign-born population - England (%)
Place of birth for the foreign-born population - Scotland (%)
Place of birth for the foreign-born population - Other Northern Europe (%)
Place of birth for the foreign-born population - Austria (%)
Place of birth for the foreign-born population - Belgium (%)
Place of birth for the foreign-born population - France (%)
Place of birth for the foreign-born population - Germany (%)
Place of birth for the foreign-born population - Netherlands (%)
Place of birth for the foreign-born population - Switzerland (%)
Place of birth for the foreign-born population - Other Western Europe (%)
Place of birth for the foreign-born population - Greece (%)
Place of birth for the foreign-born population - Italy (%)
Place of birth for the foreign-born population - Portugal (%)
Place of birth for the foreign-born population - Spain (%)
Place of birth for the foreign-born population - Other Southern Europe (%)
Place of birth for the foreign-born population - Albania (%)
Place of birth for the foreign-born population - Belarus (%)
Place of birth for the foreign-born population - Bosnia and Herzegovina (%)
Place of birth for the foreign-born population - Bulgaria (%)
Place of birth for the foreign-born population - Croatia (%)
Place of birth for the foreign-born population - Czechoslovakia (%)
Place of birth for the foreign-born population - Hungary (%)
Place of birth for the foreign-born population - Latvia (%)
Place of birth for the foreign-born population - Lithuania (%)
Place of birth for the foreign-born population - North Macedonia (Macedonia) (%)
Place of birth for the foreign-born population - Moldova (%)
Place of birth for the foreign-born population - Poland (%)
Place of birth for the foreign-born population - Romania (%)
Place of birth for the foreign-born population - Russia (%)
Place of birth for the foreign-born population - Serbia (%)
Place of birth for the foreign-born population - Ukraine (%)
Place of birth for the foreign-born population - Other Eastern Europe (%)
Place of birth for the foreign-born population - China (%)
Place of birth for the foreign-born population - Hong Kong (%)
Place of birth for the foreign-born population - Taiwan (%)
Place of birth for the foreign-born population - Japan (%)
Place of birth for the foreign-born population - Korea (%)
Place of birth for the foreign-born population - Other Eastern Asia (%)
Place of birth for the foreign-born population - Afghanistan (%)
Place of birth for the foreign-born population - Bangladesh (%)
Place of birth for the foreign-born population - India (%)
Place of birth for the foreign-born population - Iran (%)
Place of birth for the foreign-born population - Kazakhstan (%)
Place of birth for the foreign-born population - Nepal (%)
Place of birth for the foreign-born population - Pakistan (%)
Place of birth for the foreign-born population - Sri Lanka (%)
Place of birth for the foreign-born population - Uzbekistan (%)
Place of birth for the foreign-born population - Other South Central Asia (%)
Place of birth for the foreign-born population - Burma (%)
Place of birth for the foreign-born population - Cambodia (%)
Place of birth for the foreign-born population - Indonesia (%)
Place of birth for the foreign-born population - Laos (%)
Place of birth for the foreign-born population - Malaysia (%)
Place of birth for the foreign-born population - Philippines (%)
Place of birth for the foreign-born population - Singapore (%)
Place of birth for the foreign-born population - Thailand (%)
Place of birth for the foreign-born population - Vietnam (%)
Place of birth for the foreign-born population - Other South Eastern Asia (%)
Place of birth for the foreign-born population - Armenia (%)
Place of birth for the foreign-born population - Iraq (%)
Place of birth for the foreign-born population - Israel (%)
Place of birth for the foreign-born population - Jordan (%)
Place of birth for the foreign-born population - Kuwait (%)
Place of birth for the foreign-born population - Lebanon (%)
Place of birth for the foreign-born population - Saudi Arabia (%)
Place of birth for the foreign-born population - Syria (%)
Place of birth for the foreign-born population - Turkey (%)
Place of birth for the foreign-born population - Yemen (%)
Place of birth for the foreign-born population - Other Western Asia (%)
Place of birth for the foreign-born population - Eritrea (%)
Place of birth for the foreign-born population - Ethiopia (%)
Place of birth for the foreign-born population - Kenya (%)
Place of birth for the foreign-born population - Somalia (%)
Place of birth for the foreign-born population - Uganda (%)
Place of birth for the foreign-born population - Zimbabwe (%)
Place of birth for the foreign-born population - Other Eastern Africa (%)
Place of birth for the foreign-born population - Cameroon (%)
Place of birth for the foreign-born population - Congo (%)
Place of birth for the foreign-born population - Democratic Republic of Congo (Zaire) (%)
Place of birth for the foreign-born population - Other Middle Africa (%)
Place of birth for the foreign-born population - Egypt (%)
Place of birth for the foreign-born population - Morocco (%)
Place of birth for the foreign-born population - Sudan (%)
Place of birth for the foreign-born population - Other Northern Africa (%)
Place of birth for the foreign-born population - South Africa (%)
Place of birth for the foreign-born population - Other Southern Africa (%)
Place of birth for the foreign-born population - Cabo Verde (%)
Place of birth for the foreign-born population - Ghana (%)
Place of birth for the foreign-born population - Liberia (%)
Place of birth for the foreign-born population - Nigeria (%)
Place of birth for the foreign-born population - Senegal (%)
Place of birth for the foreign-born population - Sierra Leone (%)
Place of birth for the foreign-born population - Other Western Africa (%)
Place of birth for the foreign-born population - Australia (%)
Place of birth for the foreign-born population - New Zealand (%)
Place of birth for the foreign-born population - Fiji (%)
Place of birth for the foreign-born population - Micronesia (%)
Place of birth for the foreign-born population - Bahamas (%)
Place of birth for the foreign-born population - Barbados (%)
Place of birth for the foreign-born population - Cuba (%)
Place of birth for the foreign-born population - Dominica (%)
Place of birth for the foreign-born population - Dominican Republic (%)
Place of birth for the foreign-born population - Grenada (%)
Place of birth for the foreign-born population - Haiti (%)
Place of birth for the foreign-born population - Jamaica (%)
Place of birth for the foreign-born population - St. Vincent and the Grenadines (%)
Place of birth for the foreign-born population - Trinidad and Tobago (%)
Place of birth for the foreign-born population - West Indies (%)
Place of birth for the foreign-born population - Other Caribbean (%)
Place of birth for the foreign-born population - Belize (%)
Place of birth for the foreign-born population - Costa Rica (%)
Place of birth for the foreign-born population - El Salvador (%)
Place of birth for the foreign-born population - Guatemala (%)
Place of birth for the foreign-born population - Honduras (%)
Place of birth for the foreign-born population - Mexico (%)
Place of birth for the foreign-born population - Nicaragua (%)
Place of birth for the foreign-born population - Panama (%)
Place of birth for the foreign-born population - Other Central America (%)
Place of birth for the foreign-born population - Argentina (%)
Place of birth for the foreign-born population - Bolivia (%)
Place of birth for the foreign-born population - Brazil (%)
Place of birth for the foreign-born population - Chile (%)
Place of birth for the foreign-born population - Colombia (%)
Place of birth for the foreign-born population - Ecuador (%)
Place of birth for the foreign-born population - Guyana (%)
Place of birth for the foreign-born population - Peru (%)
Place of birth for the foreign-born population - Uruguay (%)
Place of birth for the foreign-born population - Venezuela (%)
Place of birth for the foreign-born population - Other South America (%)
Place of birth for the foreign-born population - Canada (%)
Place of birth for the foreign-born population - Other Northern America (%)
Place of birth for the foreign-born population - Other (%)
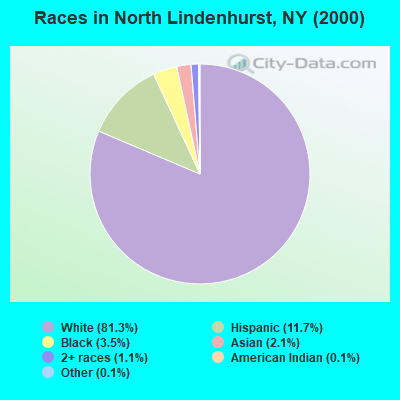
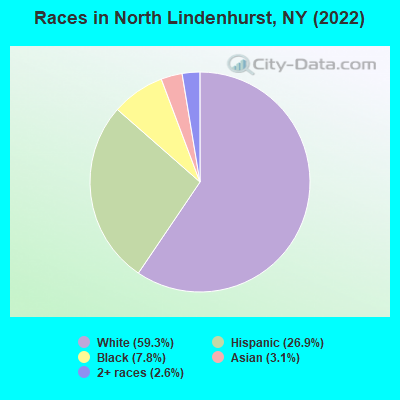
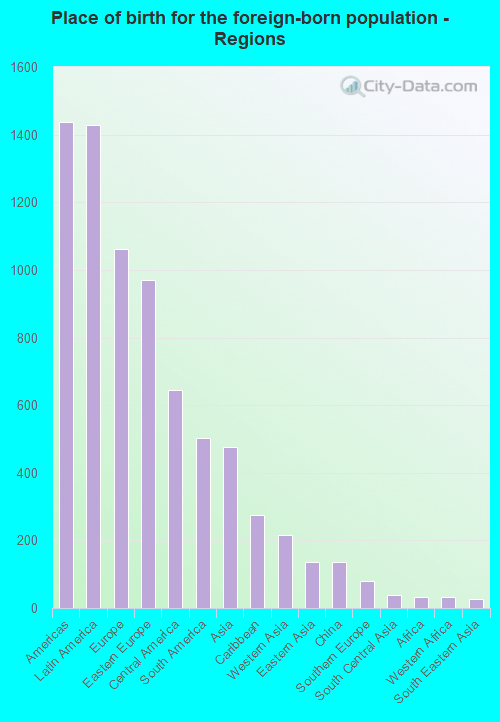
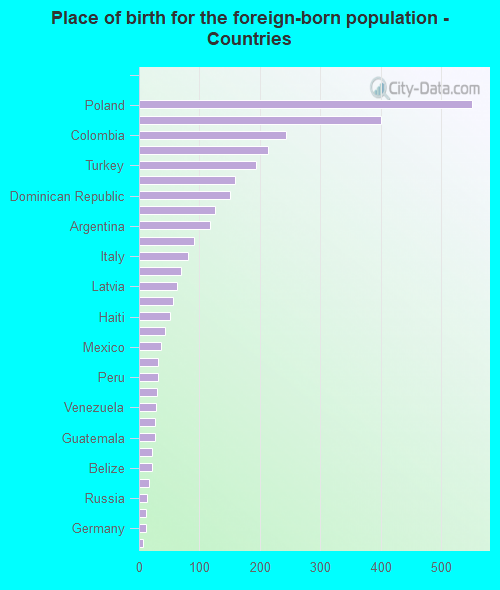
According to 2022 data, the most numerous races in North Lindenhurst, NY are White alone (6,621 residents), Hispanic (3,001 residents), and Black alone (875 residents). 58.8% of North Lindenhurst residents speak English at home. 27.0% of North Lindenhurst, NY residents are foreign-born (12.9% born in Latin America, 9.6% born in Europe, 4.3% born in Asia), which is 18.4% greater than the foreign-born rate of 22.0% across the entire state of New York.
Race distribution in North Lindenhurst
2000 2022
11,760,981 62.0% White alone 2,867,583 15.1% Hispanic 2,812,623 14.8% Black alone 1,035,926 5.5% Asian alone 366,116 1.9% Two or more races 75,499 0.4% Other race alone 52,499 0.3% American Indian alone 5,230 0.03% Native Hawaiian and Other
10,408,933 52.9% White alone 3,867,299 19.7% Hispanic 2,633,840 13.4% Black alone 1,776,286 9.0% Asian alone 732,670 3.7% Two or more races 216,110 1.1% Other race alone 35,082 0.2% American Indian alone 6,931 0.04% Native Hawaiian and Other
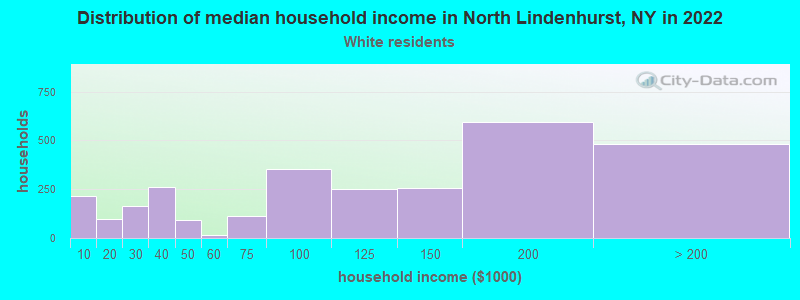
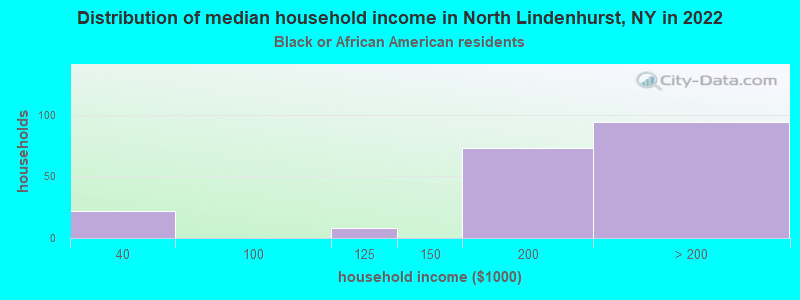
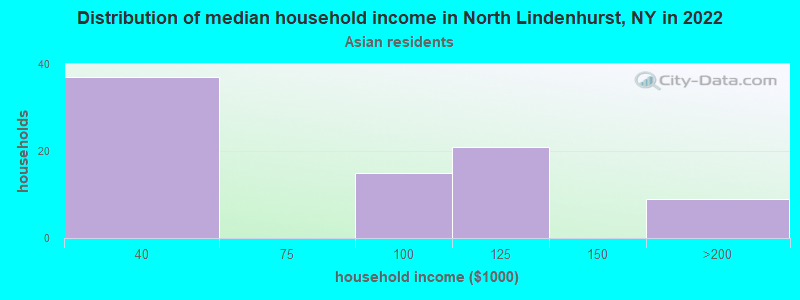
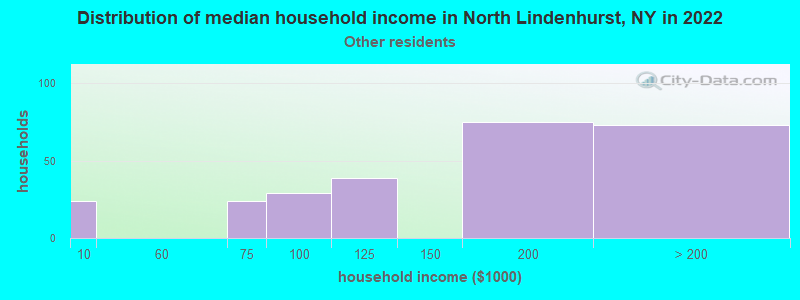
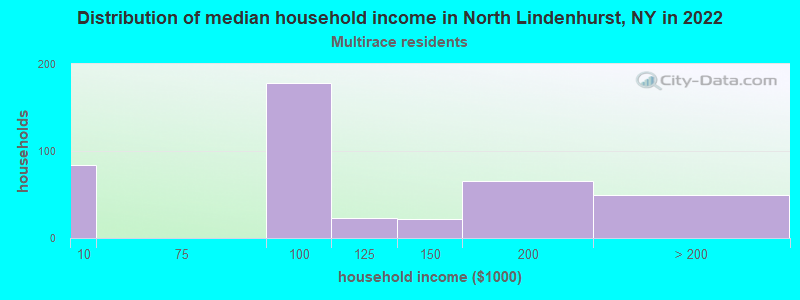
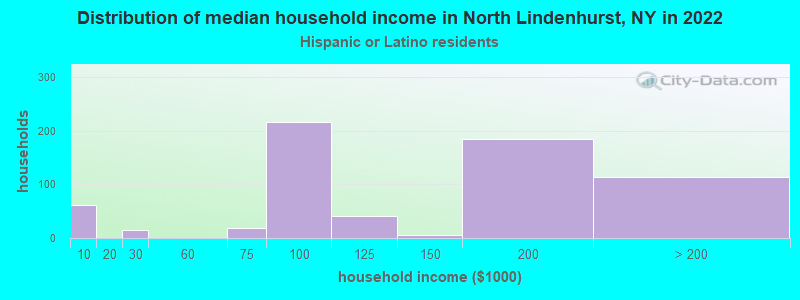
Income and house value in North Lindenhurst Median household income in 2022 $113,412 White non-Hispanic householdersover $200,000 Black householders$84,263 Asian householders$162,624 Some other race householders$91,069 Two or more races householders$113,423 Hispanic or Latino race householdersMedian 2022 house value $477,936 White Non-Hispanic householders$437,365 Black or African American householders$691,547 American Indian or Alaska Native householders $572,908 Asian householders$380,504 Some other race householders$579,363 Two or more races householders$463,797 Hispanic or Latino householders
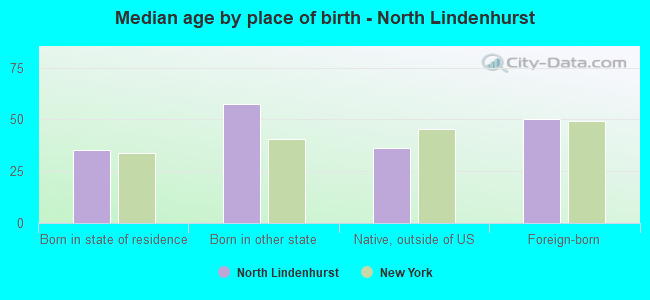
Median age by race in North Lindenhurst
49.8 Median age for White residents43.9 55.4 36.0 Median age for Black or African American residents36.4 35.1 -748,832,865.7 Median age for American Indian / Alaska Native residents-807,017,543.1 -513,692,161.9 36.1 Median age for Asian residents33.2 36.5 -742,816,091.2 Median age for Native Hawaiian / Pacific Islander residents-831,187,409.8 -771,300,447.7 48.8 Median age for Other race residents48.1 41.6 35.6 Median age for Two or more races residents27.8 45.6 50.1 Median age for White alone residents43.0 57.9 39.5 Median age for Hispanic or Latino residents39.6 39.2
Owner/renter occupied households by race in North Lindenhurst
House owners and renters - White residents 2,290 80.0% Owner occupied571 20.0% Renter occupiedHouse owners and renters - Black or African American residents 129 61.4% Owner occupied81 38.6% Renter occupiedHouse owners and renters - Asian residents 60 79.4% Owner occupied16 20.6% Renter occupiedHouse owners and renters - Other race residents 225 92.5% Owner occupied18 7.5% Renter occupiedHouse owners and renters - Two or more races residents 309 88.9% Owner occupied39 11.1% Renter occupiedHouse owners and renters - White alone residents 2,192 80.0% Owner occupied549 20.0% Renter occupiedHouse owners and renters - Hispanic or Latino residents 520 82.3% Owner occupied112 17.7% Renter occupied
Language usage in North Lindenhurst
English speakers - Total 58.8% of residents of North Lindenhurst speak English at home.
21.5% of residents speak Spanish at home 1,242 54.2% Speak English very well1,049 45.8% Speak English less than very well21.2% of residents speak other language at home 1,410 62.4% Speak English very well850 37.6% Speak English less than very well
English speakers - Born in the United States 87.2% of residents of North Lindenhurst speak English at home.
9.4% of residents speak Spanish at home 49 100.0% Speak English very well3.8% of residents speak other language at home 20 100.0% Speak English less than very well
English speakers - Native, born elsewhere 8.5% of residents of North Lindenhurst speak English at home.
48.1% of residents speak Spanish at home 135 88.8% Speak English very well17 11.2% Speak English less than very well54.7% of residents speak other language at home 163 94.2% Speak English very well10 5.8% Speak English less than very well
English speakers - Foreign-born 4.5% of residents of North Lindenhurst speak English at home.
43.6% of residents speak Spanish at home 510 35.8% Speak English very well913 64.2% Speak English less than very well51.7% of residents speak other language at home 883 52.3% Speak English very well805 47.7% Speak English less than very well
White (Caucasian) - Speak only English Native:
89.3% (4,818)Foreign-born:
2.0% (28)
White (Caucasian) - Speak another language Native:
9.2% (498)Foreign-born:
89.6% (1,255)
Black or African American - Speak only English Native:
93.7% (630)Foreign-born:
36.4% (71)
Black or African American - Speak another language Native:
4.4% (30)Foreign-born:
60.0% (117)
Asian - Speak another language Native:
64.8% (96)Foreign-born:
100.0% (200)
Other race - Speak only English Native:
31.7% (131)Foreign-born:
3.5% (22)
Other race - Speak another language Native:
67.4% (278)Foreign-born:
97.4% (612)
Two or more races - Speak only English Native:
52.7% (515)Foreign-born:
17.8% (52)
Two or more races - Speak another language Native:
46.8% (457)Foreign-born:
81.5% (236)
White alone - Speak only English Native:
91.9% (4,660)Foreign-born:
2.3% (30)
White alone - Speak another language Native:
8.3% (422)Foreign-born:
97.6% (1,289)
Hispanic or Latino - Speak only English Native:
41.8% (593)Foreign-born:
1.3% (18)
Hispanic or Latino - Speak another language Native:
57.7% (820)Foreign-born:
99.3% (1,440)
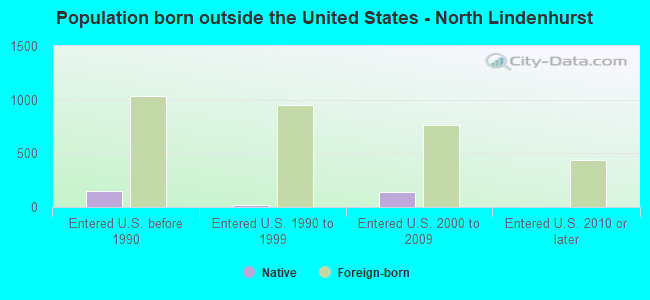
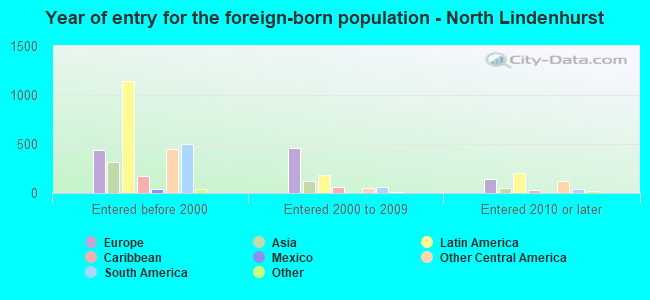
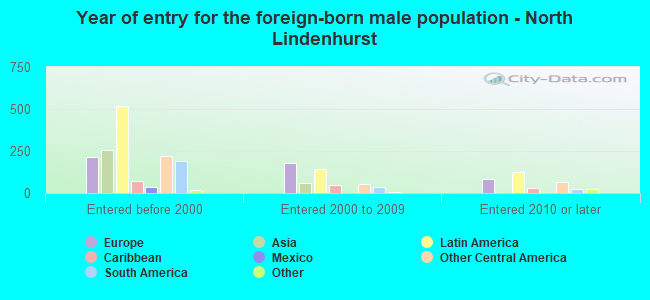
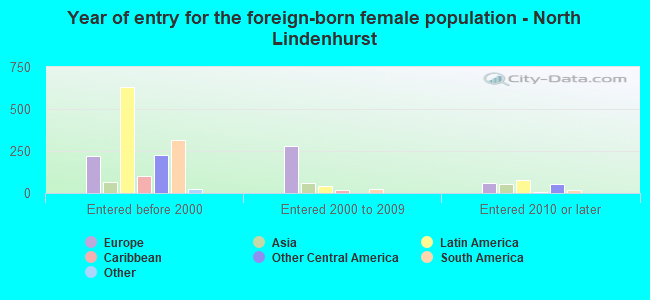
Foreign-born residents in North Lindenhurst 3,009 residents are foreign born (12.9% Latin America , 9.6% Europe , 4.3% Asia ).
This city:
27.0%New York:
22.6%
Marital status for residents in North Lindenhurst Marital status - White (Caucasian) population 15 years and over
Males 38.1% Never married43.7% Now married3.3% Separated5.6% Widowed9.3% DivorcedFemales 24.5% Never married44.9% Now married2.8% Separated9.4% Widowed18.5% DivorcedWomen who gave birth in the past 12 months Now married:
100.0% (35)Unmarried:
0.0% (0)
Women who did not give birth in the past 12 months Now married:
42.1% (511)Unmarried:
57.9% (703)
Marital status - Black or African American population 15 years and over
Males 67.7% Never married32.3% Now married0.0% Separated0.0% Widowed0.0% DivorcedFemales 11.3% Never married62.9% Now married0.0% Separated2.3% Widowed23.5% DivorcedWomen who did not give birth in the past 12 months Now married:
46.4% (90)Unmarried:
53.6% (104)
Marital status - Asian population 15 years and over
Males 47.4% Never married41.0% Now married0.0% Separated11.6% Widowed0.0% DivorcedFemales 0.0% Never married84.0% Now married0.0% Separated16.0% Widowed0.0% DivorcedWomen who did not give birth in the past 12 months Now married:
100.0% (46)Unmarried:
0.0% (0)
Marital status - Other race population 15 years and over
Males 23.2% Never married70.9% Now married0.0% Separated2.2% Widowed3.7% DivorcedFemales 33.2% Never married56.1% Now married0.0% Separated6.8% Widowed3.9% DivorcedWomen who did not give birth in the past 12 months Now married:
45.9% (106)Unmarried:
54.1% (125)
Marital status - Two or more races population 15 years and over
Males 26.6% Never married60.5% Now married0.0% Separated0.0% Widowed12.9% DivorcedFemales 21.7% Never married59.2% Now married0.0% Separated8.5% Widowed10.6% DivorcedWomen who gave birth in the past 12 months Now married:
100.0% (38)Unmarried:
0.0% (0)
Women who did not give birth in the past 12 months Now married:
68.2% (329)Unmarried:
31.8% (154)
Marital status - White alone, not Hispanic / Latino population 15 years and over
Males 35.4% Never married43.4% Now married3.9% Separated6.5% Widowed10.8% DivorcedFemales 22.5% Never married44.1% Now married2.7% Separated9.8% Widowed20.9% DivorcedWomen who gave birth in the past 12 months Now married:
100.0% (24)Unmarried:
0.0% (0)
Women who did not give birth in the past 12 months Now married:
42.7% (435)Unmarried:
57.3% (584)
Marital status - Hispanic or Latino population 15 years and over
Males 38.5% Never married56.2% Now married0.0% Separated0.6% Widowed4.7% DivorcedFemales 30.4% Never married56.2% Now married1.5% Separated6.5% Widowed5.3% DivorcedWomen who gave birth in the past 12 months Now married:
100.0% (24)Unmarried:
0.0% (0)
Women who did not give birth in the past 12 months Now married:
55.5% (438)Unmarried:
44.5% (351)
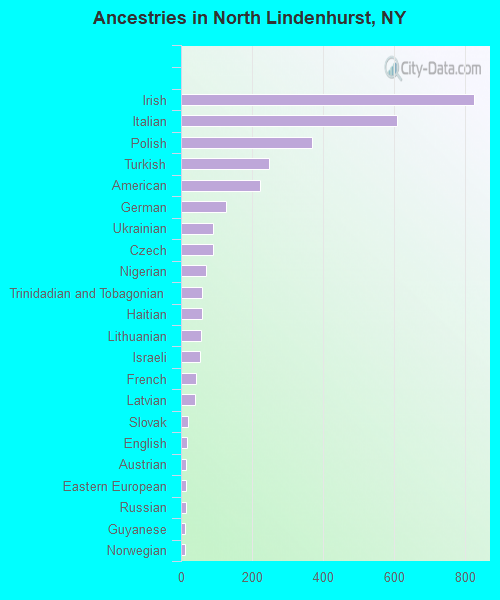
Ancestries in North Lindenhurst
826 15.2% Irish607 11.1% Italian368 6.8% Polish247 4.5% Turkish222 4.1% American128 2.3% German90 1.7% Ukrainian89 1.6% Czech69 1.3% Nigerian60 1.1% Trinidadian and Tobagonian59 1.1% Haitian56 1.0% Lithuanian54 1.0% Israeli43 0.8% French39 0.7% Latvian19 0.3% Slovak18 0.3% English15 0.3% Austrian14 0.3% Eastern European13 0.2% Russian12 0.2% Guyanese12 0.2% Norwegian7 0.1% Scotch-Irish
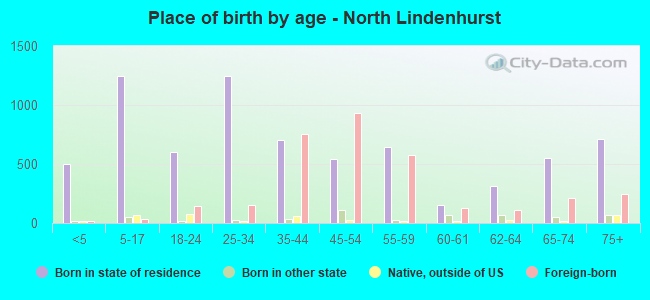
Children Nativity (place of birth) in North Lindenhurst
Children under 6 years - Living with two parents Both parents native 236 100.0% NativeBoth parents foreign-born 85 100.0% NativeOne native, one foreign-born parent 63 100.0% NativeChildren under 6 years - Living with one parent Native parent 80 100.0% NativeChildren 6 to 17 years - Living with two parents Both parents native 304 100.0% NativeBoth parents foreign-born 463 100.0% NativeOne native, one foreign-born parent 83 100.0% NativeChildren 6 to 17 years - Living with one parent Native parent 399 92.5% Native32 7.5% Foreign-bornForeign-born parent 46 83.4% Native9 16.6% Foreign-born
Grandparents responsible for own grandchildren in North Lindenhurst
Grandparents (30 to 59 years) Black or African American 59 100.0% Responsible for grandchildren
Grandparents (60 years and over)