Races in North Fort Myers, Florida (FL) Detailed Stats
Data:
Races - White alone (%)
Races - White alone (% change since 2000)
Races - Black alone (%)
Races - Black alone (% change since 2000)
Races - American Indian alone (%)
Races - American Indian alone (% change since 2000)
Races - Asian alone (%)
Races - Asian alone (% change since 2000)
Races - Hispanic (%)
Races - Hispanic (% change since 2000)
Races - Native Hawaiian and Other Pacific Islander alone (%)
Races - Native Hawaiian and Other Pacific Islander alone (% change since 2000)
Races - Two or more races(%)
Races - Two or more races(% change since 2000)
Races - Other race alone (%)
Races - Other race alone (% change since 2000)
Racial diversity
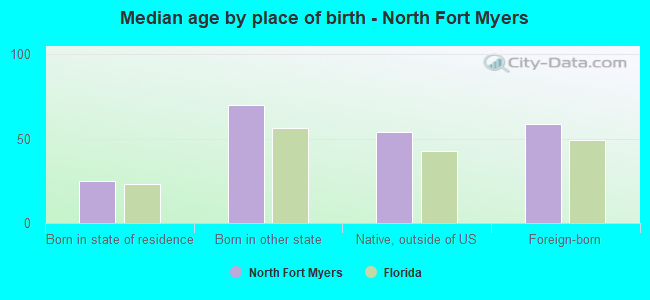
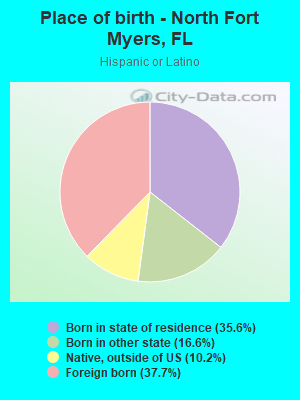
Place of birth - Born in state of residence (%)
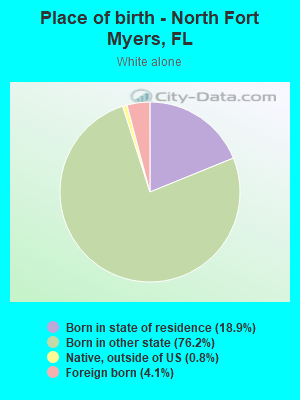
Place of birth - Born in state of residence (%) - White
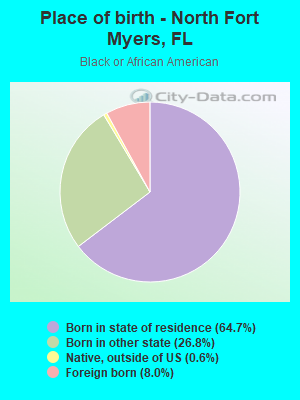
Place of birth - Born in state of residence (%) - Black or African American
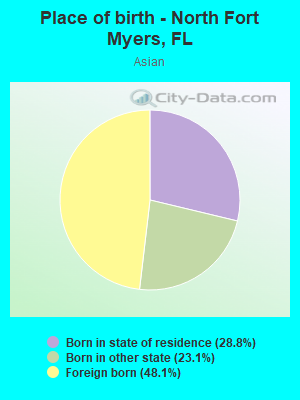
Place of birth - Born in state of residence (%) - Asian
Place of birth - Born in state of residence (%) - Hispanic or Latino
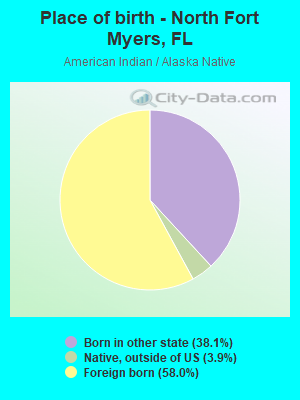
Place of birth - Born in state of residence (%) - American Indian and Alaska Native
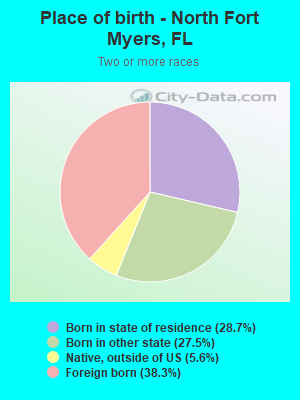
Place of birth - Born in state of residence (%) - Multirace
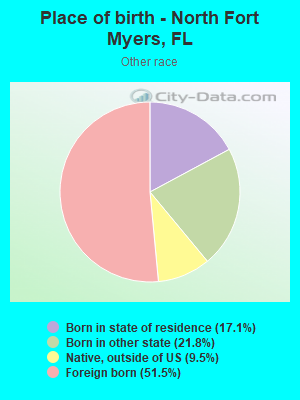
Place of birth - Born in state of residence (%) - Other Race
Place of birth - Born in other state (%)
Place of birth - Born in other state (%) - White
Place of birth - Born in other state (%) - Black or African American
Place of birth - Born in other state (%) - Asian
Place of birth - Born in other state (%) - Hispanic or Latino
Place of birth - Born in other state (%) - American Indian and Alaska Native
Place of birth - Born in other state (%) - Multirace
Place of birth - Born in other state (%) - Other Race
Place of birth - Native, outside of US (%)
Place of birth - Native, outside of US (%) - White
Place of birth - Native, outside of US (%) - Black or African American
Place of birth - Native, outside of US (%) - Asian
Place of birth - Native, outside of US (%) - Hispanic or Latino
Place of birth - Native, outside of US (%) - American Indian and Alaska Native
Place of birth - Native, outside of US (%) - Multirace
Place of birth - Native, outside of US (%) - Other Race
Place of birth - Foreign born (%)
Place of birth - Foreign born (%) - White
Place of birth - Foreign born (%) - Black or African American
Place of birth - Foreign born (%) - Asian
Place of birth - Foreign born (%) - Hispanic or Latino
Place of birth - Foreign born (%) - American Indian and Alaska Native
Place of birth - Foreign born (%) - Multirace
Place of birth - Foreign born (%) - Other Race
Residents speaking English at home (%)
Residents speaking English at home - Born in the United States (%)
Residents speaking English at home - Native, born elsewhere (%)
Residents speaking English at home - Foreign born (%)
Residents speaking Spanish at home (%)
Residents speaking Spanish at home - Born in the United States (%)
Residents speaking Spanish at home - Native, born elsewhere (%)
Residents speaking Spanish at home - Foreign born (%)
Residents speaking other language at home (%)
Residents speaking other language at home - Born in the United States (%)
Residents speaking other language at home - Native, born elsewhere (%)
Residents speaking other language at home - Foreign born (%)
Marital status - Never married (%)
Marital status - Now married (%)
Marital status - Separated (%)
Marital status - Widowed (%)
Marital status - Divorced (%)
Ancestries Reported - Arab (%)
Ancestries Reported - Czech (%)
Ancestries Reported - Danish (%)
Ancestries Reported - Dutch (%)
Ancestries Reported - English (%)
Ancestries Reported - French (%)
Ancestries Reported - French Canadian (%)
Ancestries Reported - German (%)
Ancestries Reported - Greek (%)
Ancestries Reported - Hungarian (%)
Ancestries Reported - Irish (%)
Ancestries Reported - Italian (%)
Ancestries Reported - Lithuanian (%)
Ancestries Reported - Norwegian (%)
Ancestries Reported - Polish (%)
Ancestries Reported - Portuguese (%)
Ancestries Reported - Russian (%)
Ancestries Reported - Scotch-Irish (%)
Ancestries Reported - Scottish (%)
Ancestries Reported - Slovak (%)
Ancestries Reported - Subsaharan African (%)
Ancestries Reported - Swedish (%)
Ancestries Reported - Swiss (%)
Ancestries Reported - Ukrainian (%)
Ancestries Reported - United States (%)
Ancestries Reported - Welsh (%)
Ancestries Reported - West Indian (%)
Ancestries Reported - Other (%)
Geographical mobility - Same house 1 year ago (%)
Geographical mobility - Same house 1 year ago (%) - White
Geographical mobility - Same house 1 year ago (%) - Black or African American
Geographical mobility - Same house 1 year ago (%) - Asian
Geographical mobility - Same house 1 year ago (%) - Hispanic or Latino
Geographical mobility - Same house 1 year ago (%) - American Indian and Alaska Native
Geographical mobility - Same house 1 year ago (%) - Multirace
Geographical mobility - Same house 1 year ago (%) - Other Race
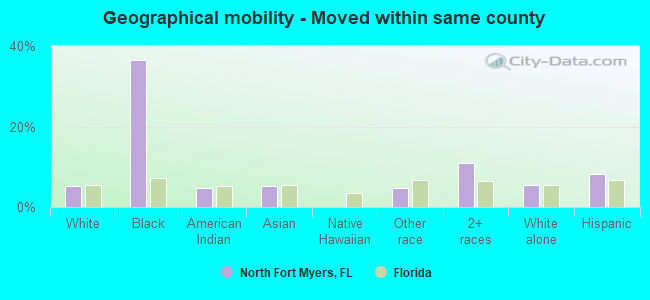
Geographical mobility - Moved within same county (%)
Geographical mobility - Moved within same county (%) - White
Geographical mobility - Moved within same county (%) - Black or African American
Geographical mobility - Moved within same county (%) - Asian
Geographical mobility - Moved within same county (%) - Hispanic or Latino
Geographical mobility - Moved within same county (%) - American Indian and Alaska Native
Geographical mobility - Moved within same county (%) - Multirace
Geographical mobility - Moved within same county (%) - Other Race
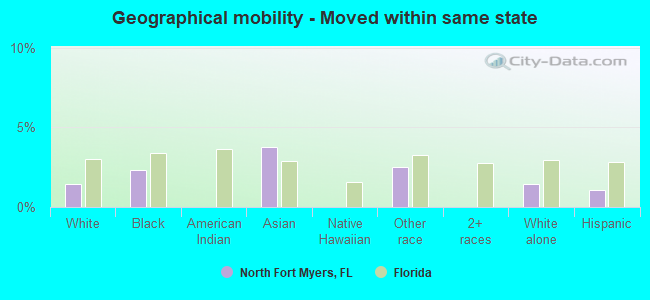
Geographical mobility - Moved from different county within same state (%)
Geographical mobility - Moved from different county within same state (%) - White
Geographical mobility - Moved from different county within same state (%) - Black or African American
Geographical mobility - Moved from different county within same state (%) - Asian
Geographical mobility - Moved from different county within same state (%) - Hispanic or Latino
Geographical mobility - Moved from different county within same state (%) - American Indian and Alaska Native
Geographical mobility - Moved from different county within same state (%) - Multirace
Geographical mobility - Moved from different county within same state (%) - Other Race
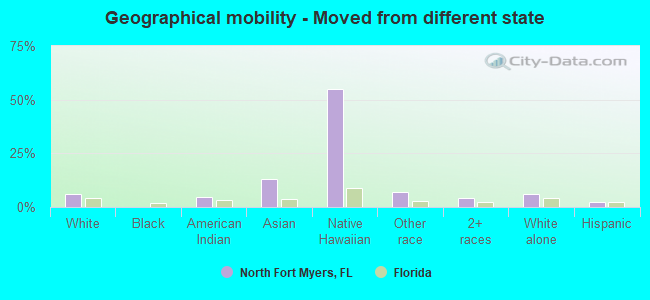
Geographical mobility - Moved from different state (%)
Geographical mobility - Moved from different state (%) - White
Geographical mobility - Moved from different state (%) - Black or African American
Geographical mobility - Moved from different state (%) - Asian
Geographical mobility - Moved from different state (%) - Hispanic or Latino
Geographical mobility - Moved from different state (%) - American Indian and Alaska Native
Geographical mobility - Moved from different state (%) - Multirace
Geographical mobility - Moved from different state (%) - Other Race
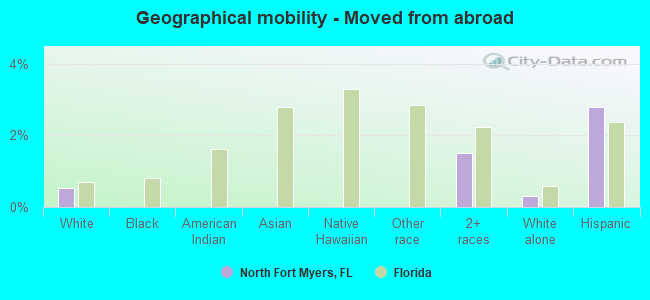
Geographical mobility - Moved from abroad (%)
Geographical mobility - Moved from abroad (%) - White
Geographical mobility - Moved from abroad (%) - Black or African American
Geographical mobility - Moved from abroad (%) - Asian
Geographical mobility - Moved from abroad (%) - Hispanic or Latino
Geographical mobility - Moved from abroad (%) - American Indian and Alaska Native
Geographical mobility - Moved from abroad (%) - Multirace
Geographical mobility - Moved from abroad (%) - Other Race
Place of birth for the foreign-born population - Ireland (%)
Place of birth for the foreign-born population - Denmark (%)
Place of birth for the foreign-born population - Norway (%)
Place of birth for the foreign-born population - Sweden (%)
Place of birth for the foreign-born population - United Kingdom (%)
Place of birth for the foreign-born population - England (%)
Place of birth for the foreign-born population - Scotland (%)
Place of birth for the foreign-born population - Other Northern Europe (%)
Place of birth for the foreign-born population - Austria (%)
Place of birth for the foreign-born population - Belgium (%)
Place of birth for the foreign-born population - France (%)
Place of birth for the foreign-born population - Germany (%)
Place of birth for the foreign-born population - Netherlands (%)
Place of birth for the foreign-born population - Switzerland (%)
Place of birth for the foreign-born population - Other Western Europe (%)
Place of birth for the foreign-born population - Greece (%)
Place of birth for the foreign-born population - Italy (%)
Place of birth for the foreign-born population - Portugal (%)
Place of birth for the foreign-born population - Spain (%)
Place of birth for the foreign-born population - Other Southern Europe (%)
Place of birth for the foreign-born population - Albania (%)
Place of birth for the foreign-born population - Belarus (%)
Place of birth for the foreign-born population - Bosnia and Herzegovina (%)
Place of birth for the foreign-born population - Bulgaria (%)
Place of birth for the foreign-born population - Croatia (%)
Place of birth for the foreign-born population - Czechoslovakia (%)
Place of birth for the foreign-born population - Hungary (%)
Place of birth for the foreign-born population - Latvia (%)
Place of birth for the foreign-born population - Lithuania (%)
Place of birth for the foreign-born population - North Macedonia (Macedonia) (%)
Place of birth for the foreign-born population - Moldova (%)
Place of birth for the foreign-born population - Poland (%)
Place of birth for the foreign-born population - Romania (%)
Place of birth for the foreign-born population - Russia (%)
Place of birth for the foreign-born population - Serbia (%)
Place of birth for the foreign-born population - Ukraine (%)
Place of birth for the foreign-born population - Other Eastern Europe (%)
Place of birth for the foreign-born population - China (%)
Place of birth for the foreign-born population - Hong Kong (%)
Place of birth for the foreign-born population - Taiwan (%)
Place of birth for the foreign-born population - Japan (%)
Place of birth for the foreign-born population - Korea (%)
Place of birth for the foreign-born population - Other Eastern Asia (%)
Place of birth for the foreign-born population - Afghanistan (%)
Place of birth for the foreign-born population - Bangladesh (%)
Place of birth for the foreign-born population - India (%)
Place of birth for the foreign-born population - Iran (%)
Place of birth for the foreign-born population - Kazakhstan (%)
Place of birth for the foreign-born population - Nepal (%)
Place of birth for the foreign-born population - Pakistan (%)
Place of birth for the foreign-born population - Sri Lanka (%)
Place of birth for the foreign-born population - Uzbekistan (%)
Place of birth for the foreign-born population - Other South Central Asia (%)
Place of birth for the foreign-born population - Burma (%)
Place of birth for the foreign-born population - Cambodia (%)
Place of birth for the foreign-born population - Indonesia (%)
Place of birth for the foreign-born population - Laos (%)
Place of birth for the foreign-born population - Malaysia (%)
Place of birth for the foreign-born population - Philippines (%)
Place of birth for the foreign-born population - Singapore (%)
Place of birth for the foreign-born population - Thailand (%)
Place of birth for the foreign-born population - Vietnam (%)
Place of birth for the foreign-born population - Other South Eastern Asia (%)
Place of birth for the foreign-born population - Armenia (%)
Place of birth for the foreign-born population - Iraq (%)
Place of birth for the foreign-born population - Israel (%)
Place of birth for the foreign-born population - Jordan (%)
Place of birth for the foreign-born population - Kuwait (%)
Place of birth for the foreign-born population - Lebanon (%)
Place of birth for the foreign-born population - Saudi Arabia (%)
Place of birth for the foreign-born population - Syria (%)
Place of birth for the foreign-born population - Turkey (%)
Place of birth for the foreign-born population - Yemen (%)
Place of birth for the foreign-born population - Other Western Asia (%)
Place of birth for the foreign-born population - Eritrea (%)
Place of birth for the foreign-born population - Ethiopia (%)
Place of birth for the foreign-born population - Kenya (%)
Place of birth for the foreign-born population - Somalia (%)
Place of birth for the foreign-born population - Uganda (%)
Place of birth for the foreign-born population - Zimbabwe (%)
Place of birth for the foreign-born population - Other Eastern Africa (%)
Place of birth for the foreign-born population - Cameroon (%)
Place of birth for the foreign-born population - Congo (%)
Place of birth for the foreign-born population - Democratic Republic of Congo (Zaire) (%)
Place of birth for the foreign-born population - Other Middle Africa (%)
Place of birth for the foreign-born population - Egypt (%)
Place of birth for the foreign-born population - Morocco (%)
Place of birth for the foreign-born population - Sudan (%)
Place of birth for the foreign-born population - Other Northern Africa (%)
Place of birth for the foreign-born population - South Africa (%)
Place of birth for the foreign-born population - Other Southern Africa (%)
Place of birth for the foreign-born population - Cabo Verde (%)
Place of birth for the foreign-born population - Ghana (%)
Place of birth for the foreign-born population - Liberia (%)
Place of birth for the foreign-born population - Nigeria (%)
Place of birth for the foreign-born population - Senegal (%)
Place of birth for the foreign-born population - Sierra Leone (%)
Place of birth for the foreign-born population - Other Western Africa (%)
Place of birth for the foreign-born population - Australia (%)
Place of birth for the foreign-born population - New Zealand (%)
Place of birth for the foreign-born population - Fiji (%)
Place of birth for the foreign-born population - Micronesia (%)
Place of birth for the foreign-born population - Bahamas (%)
Place of birth for the foreign-born population - Barbados (%)
Place of birth for the foreign-born population - Cuba (%)
Place of birth for the foreign-born population - Dominica (%)
Place of birth for the foreign-born population - Dominican Republic (%)
Place of birth for the foreign-born population - Grenada (%)
Place of birth for the foreign-born population - Haiti (%)
Place of birth for the foreign-born population - Jamaica (%)
Place of birth for the foreign-born population - St. Vincent and the Grenadines (%)
Place of birth for the foreign-born population - Trinidad and Tobago (%)
Place of birth for the foreign-born population - West Indies (%)
Place of birth for the foreign-born population - Other Caribbean (%)
Place of birth for the foreign-born population - Belize (%)
Place of birth for the foreign-born population - Costa Rica (%)
Place of birth for the foreign-born population - El Salvador (%)
Place of birth for the foreign-born population - Guatemala (%)
Place of birth for the foreign-born population - Honduras (%)
Place of birth for the foreign-born population - Mexico (%)
Place of birth for the foreign-born population - Nicaragua (%)
Place of birth for the foreign-born population - Panama (%)
Place of birth for the foreign-born population - Other Central America (%)
Place of birth for the foreign-born population - Argentina (%)
Place of birth for the foreign-born population - Bolivia (%)
Place of birth for the foreign-born population - Brazil (%)
Place of birth for the foreign-born population - Chile (%)
Place of birth for the foreign-born population - Colombia (%)
Place of birth for the foreign-born population - Ecuador (%)
Place of birth for the foreign-born population - Guyana (%)
Place of birth for the foreign-born population - Peru (%)
Place of birth for the foreign-born population - Uruguay (%)
Place of birth for the foreign-born population - Venezuela (%)
Place of birth for the foreign-born population - Other South America (%)
Place of birth for the foreign-born population - Canada (%)
Place of birth for the foreign-born population - Other Northern America (%)
Place of birth for the foreign-born population - Other (%)
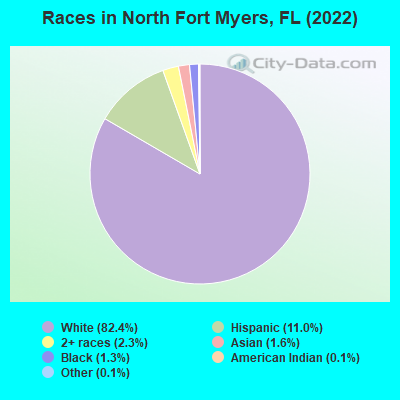
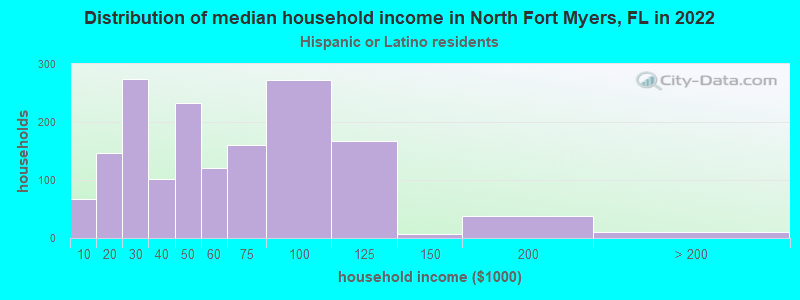
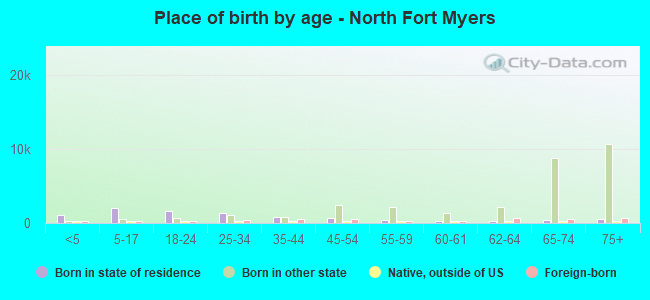
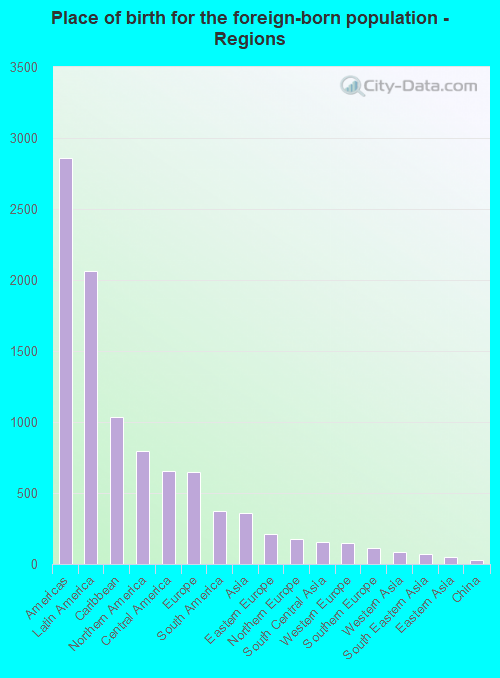
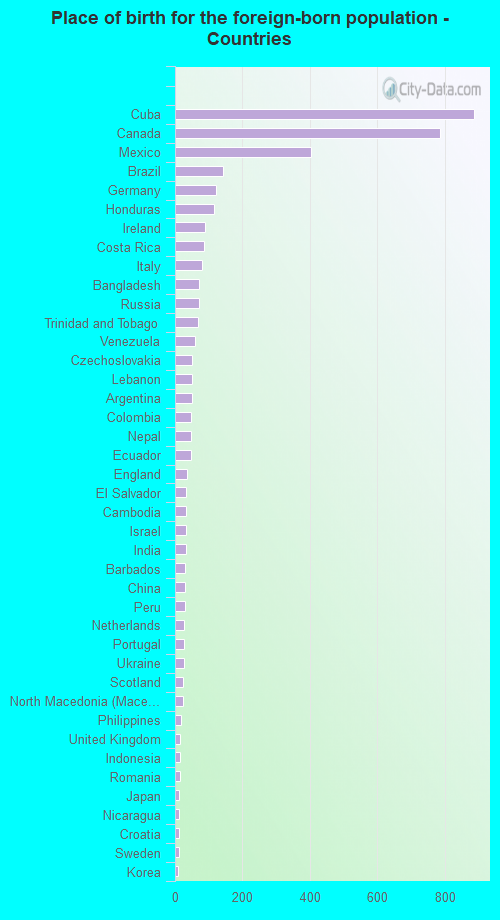
According to 2022 data, the most numerous races in North Fort Myers, FL are White alone (37,243 residents), Hispanic (4,984 residents), and Black alone (586 residents). 87.3% of North Fort Myers residents speak English at home. 8.6% of North Fort Myers, FL residents are foreign-born (4.6% born in Latin America, 1.8% born in North America, 1.5% born in Europe), which is 145.4% less than the foreign-born rate of 21.0% across the entire state of Florida.
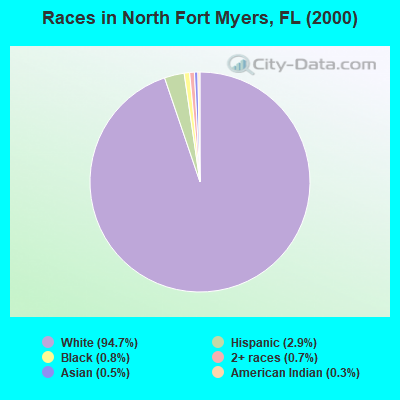
Race distribution in North Fort Myers
2000 2022
10,458,509 65.4% White alone 2,682,715 16.8% Hispanic 2,264,268 14.2% Black alone 261,693 1.6% Asian alone 236,954 1.5% Two or more races 42,358 0.3% American Indian alone 28,994 0.2% Other race alone 6,887 0.04% Native Hawaiian and Other
11,309,403 50.8% White alone 6,025,039 27.1% Hispanic 3,241,015 14.6% Black alone 861,630 3.9% Two or more races 623,692 2.8% Asian alone 152,054 0.7% Other race alone 22,504 0.1% American Indian alone 9,486 0.04% Native Hawaiian and Other
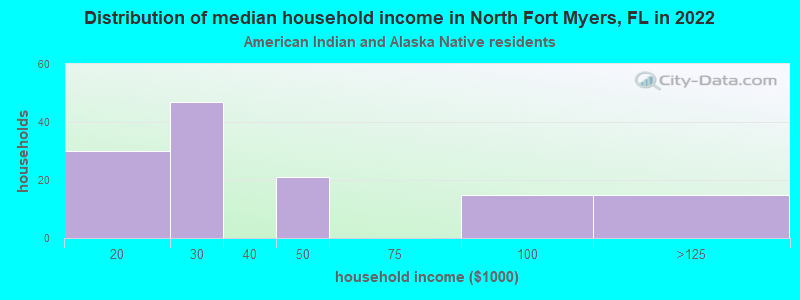
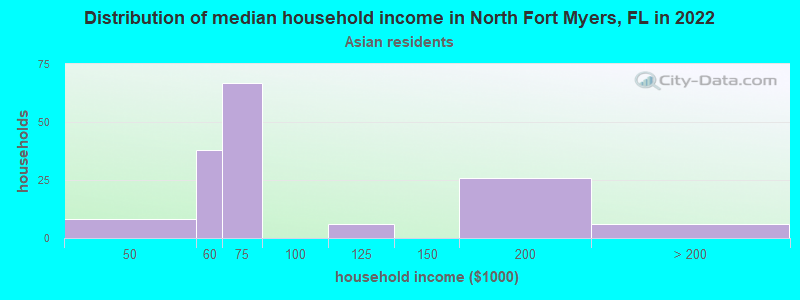
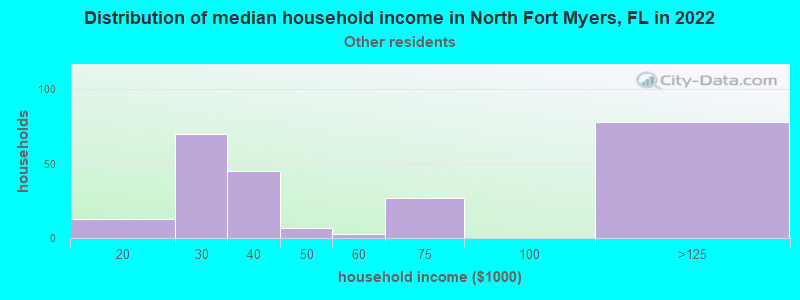
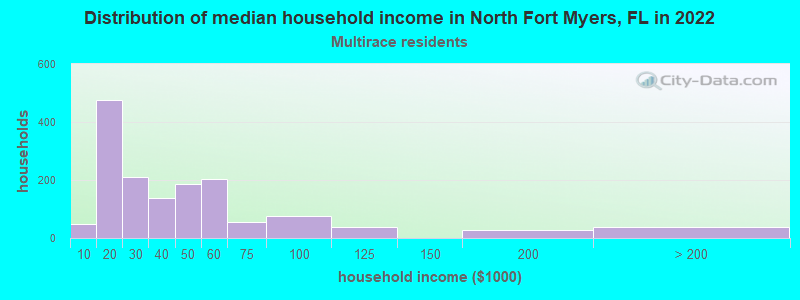
Income and house value in North Fort Myers Median household income in 2022 $57,841 White non-Hispanic householders$14,331 American Indian and Alaska Native householders$63,924 Asian householders$57,967 Some other race householders$23,935 Two or more races householders$43,336 Hispanic or Latino race householdersMedian 2022 house value $250,643 White Non-Hispanic householders$151,691 Black or African American householders$484,161 American Indian or Alaska Native householders $454,529 Asian householders$149,516 Some other race householders$239,497 Two or more races householders$213,128 Hispanic or Latino householders
Median age by race in North Fort Myers
69.5 Median age for White residents69.8 69.1 29.1 Median age for Black or African American residents28.2 31.2 41.0 Median age for American Indian / Alaska Native residents40.7 -402,449,693.4 51.1 Median age for Asian residents18.6 68.0 100.3 Median age for Native Hawaiian / Pacific Islander residents-858,307,848.3 -800,880,087.2 36.7 Median age for Other race residents28.5 45.1 38.1 Median age for Two or more races residents30.3 44.9 68.2 Median age for White alone residents68.1 68.3 31.4 Median age for Hispanic or Latino residents28.0 37.6
Owner/renter occupied households by race in North Fort Myers
House owners and renters - White residents 17,982 89.1% Owner occupied2,208 10.9% Renter occupiedHouse owners and renters - Black or African American residents 59 26.1% Owner occupied166 73.9% Renter occupiedHouse owners and renters - American Indian / Alaska Native residents 137 88.4% Owner occupied18 11.6% Renter occupiedHouse owners and renters - Asian residents 104 100.0% Owner occupiedHouse owners and renters - Native Hawaiian / Pacific Islander residents 9 100.0% Owner occupiedHouse owners and renters - Other race residents 175 88.1% Owner occupied24 11.9% Renter occupiedHouse owners and renters - Two or more races residents 921 49.0% Owner occupied959 51.0% Renter occupiedHouse owners and renters - White alone residents 18,204 89.4% Owner occupied2,169 10.6% Renter occupiedHouse owners and renters - Hispanic or Latino residents 845 49.3% Owner occupied867 50.7% Renter occupied
Language usage in North Fort Myers
English speakers - Total 87.3% of residents of North Fort Myers speak English at home.
8.3% of residents speak Spanish at home 2,279 62.1% Speak English very well1,389 37.9% Speak English less than very well3.1% of residents speak other language at home 788 58.7% Speak English very well555 41.3% Speak English less than very well
English speakers - Born in the United States 95.6% of residents of North Fort Myers speak English at home.
3.0% of residents speak Spanish at home 716 79.1% Speak English very well189 20.9% Speak English less than very well1.2% of residents speak other language at home 204 57.3% Speak English very well152 42.7% Speak English less than very well
English speakers - Native, born elsewhere 38.4% of residents of North Fort Myers speak English at home.
60.0% of residents speak Spanish at home 401 77.9% Speak English very well114 22.1% Speak English less than very well1.5% of residents speak other language at home 13 100.0% Speak English less than very well
English speakers - Foreign-born 44.6% of residents of North Fort Myers speak English at home.
36.0% of residents speak Spanish at home 494 32.8% Speak English very well1,011 67.2% Speak English less than very well19.5% of residents speak other language at home 441 54.1% Speak English very well374 45.9% Speak English less than very well
White (Caucasian) - Speak only English Native:
98.3% (34,321)Foreign-born:
84.0% (1,060)
White (Caucasian) - Speak another language Native:
2.8% (991)Foreign-born:
34.3% (433)
Black or African American - Speak only English Native:
94.7% (460)Foreign-born:
49.6% (21)
Black or African American - Speak another language Native:
3.8% (18)Foreign-born:
52.3% (23)
American Indian / Alaska Native - Speak another language Native:
88.5% (108)Foreign-born:
100.0% (148)
Asian - Speak only English Native:
37.5% (124)Foreign-born:
41.6% (145)
Asian - Speak another language Native:
40.7% (134)Foreign-born:
59.9% (208)
Other race - Speak only English Native:
17.5% (48)Foreign-born:
4.5% (14)
Other race - Speak another language Native:
87.0% (237)Foreign-born:
95.5% (288)
Two or more races - Speak only English Native:
61.8% (1,506)Foreign-born:
34.1% (585)
Two or more races - Speak another language Native:
29.8% (726)Foreign-born:
66.1% (1,134)
White alone - Speak only English Native:
97.9% (34,392)Foreign-born:
76.1% (1,134)
White alone - Speak another language Native:
2.1% (738)Foreign-born:
25.5% (380)
Hispanic or Latino - Speak only English Native:
34.7% (905)Foreign-born:
16.6% (310)
Hispanic or Latino - Speak another language Native:
65.1% (1,699)Foreign-born:
82.4% (1,541)
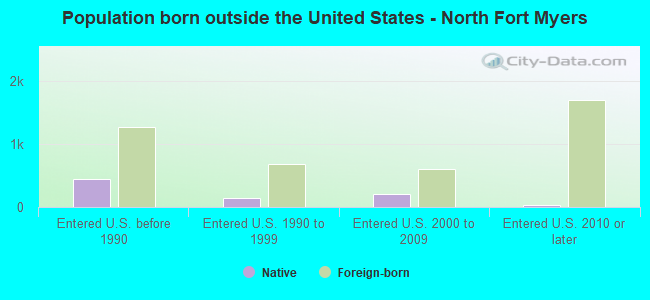
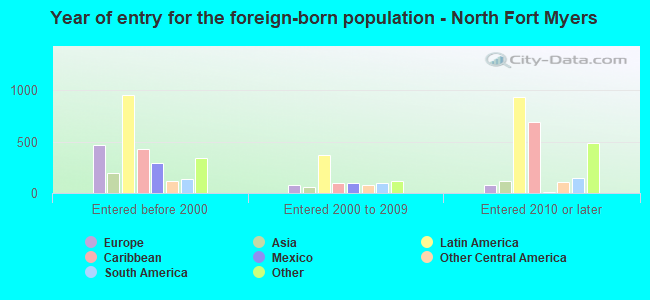
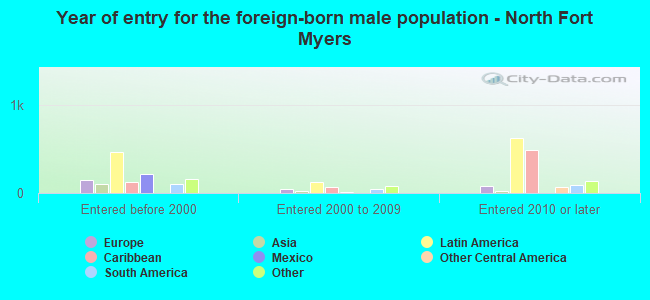
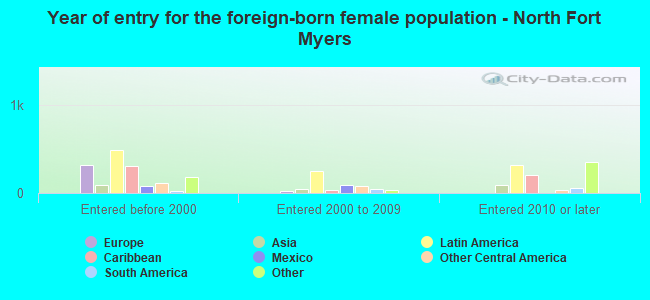
Foreign-born residents in North Fort Myers 3,869 residents are foreign born (4.6% Latin America , 1.8% North America , 1.5% Europe ).
This city:
8.6%Florida:
21.1%
Marital status for residents in North Fort Myers Marital status - White (Caucasian) population 15 years and over
Males 21.5% Never married56.3% Now married0.5% Separated9.4% Widowed12.2% DivorcedFemales 11.9% Never married48.8% Now married1.8% Separated19.9% Widowed17.6% DivorcedWomen who gave birth in the past 12 months Now married:
66.3% (112)Unmarried:
33.7% (57)
Women who did not give birth in the past 12 months Now married:
41.2% (1,247)Unmarried:
58.8% (1,778)
Marital status - Black or African American population 15 years and over
Males 74.2% Never married21.7% Now married0.0% Separated0.0% Widowed4.0% DivorcedFemales 51.8% Never married8.3% Now married0.0% Separated24.8% Widowed15.1% DivorcedWomen who did not give birth in the past 12 months Now married:
0.0% (0)Unmarried:
100.0% (106)
Marital status - American Indian / Alaska Native population 15 years and over
Males 15.0% Never married71.2% Now married0.0% Separated0.0% Widowed13.7% DivorcedFemales 78.6% Never married0.0% Now married0.0% Separated0.0% Widowed21.4% DivorcedWomen who did not give birth in the past 12 months Now married:
0.0% (0)Unmarried:
100.0% (54)
Marital status - Asian population 15 years and over
Males 37.6% Never married62.4% Now married0.0% Separated0.0% Widowed0.0% DivorcedFemales 5.6% Never married40.5% Now married0.0% Separated47.8% Widowed6.2% DivorcedWomen who gave birth in the past 12 months Now married:
100.0% (21)Unmarried:
0.0% (0)
Women who did not give birth in the past 12 months Now married:
65.5% (41)Unmarried:
34.5% (22)
Marital status - Native Hawaiian / Pacific Islander population 15 years and over
Males 0.0% Never married100.0% Now married0.0% Separated0.0% Widowed0.0% DivorcedFemales 0.0% Never married100.0% Now married0.0% Separated0.0% Widowed0.0% DivorcedMarital status - Other race population 15 years and over
Males 60.6% Never married35.9% Now married0.0% Separated0.0% Widowed3.5% DivorcedFemales 54.4% Never married38.1% Now married0.0% Separated0.0% Widowed7.5% DivorcedWomen who did not give birth in the past 12 months Now married:
42.3% (76)Unmarried:
57.7% (104)
Marital status - Two or more races population 15 years and over
Males 29.9% Never married44.1% Now married0.0% Separated5.5% Widowed20.4% DivorcedFemales 26.4% Never married25.0% Now married2.1% Separated16.8% Widowed29.8% DivorcedWomen who gave birth in the past 12 months Now married:
65.0% (23)Unmarried:
35.0% (12)
Women who did not give birth in the past 12 months Now married:
28.4% (250)Unmarried:
71.6% (630)
Marital status - White alone, not Hispanic / Latino population 15 years and over
Males 19.5% Never married57.5% Now married0.5% Separated9.9% Widowed12.5% DivorcedFemales 11.0% Never married49.0% Now married1.8% Separated20.4% Widowed17.9% DivorcedWomen who gave birth in the past 12 months Now married:
86.9% (126)Unmarried:
13.1% (19)
Women who did not give birth in the past 12 months Now married:
41.4% (1,266)Unmarried:
58.6% (1,788)
Marital status - Hispanic or Latino population 15 years and over
Males 47.2% Never married38.3% Now married0.0% Separated2.4% Widowed12.1% DivorcedFemales 33.3% Never married37.0% Now married1.2% Separated0.6% Widowed27.9% DivorcedWomen who gave birth in the past 12 months Now married:
20.0% (14)Unmarried:
80.0% (58)
Women who did not give birth in the past 12 months Now married:
39.5% (396)Unmarried:
60.5% (607)
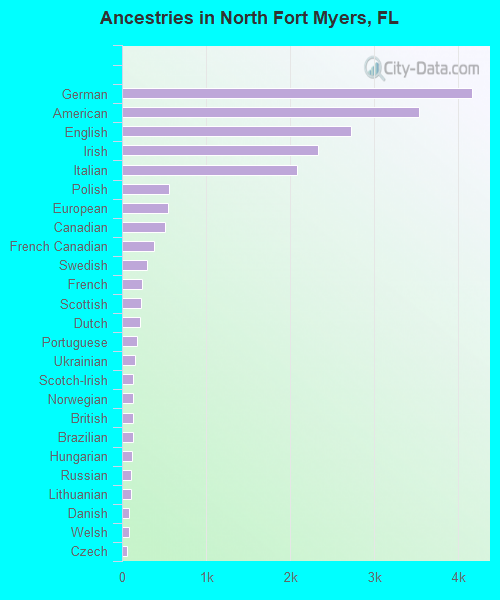
Ancestries in North Fort Myers
4,156 17.2% German3,530 14.6% American2,728 11.3% English2,326 9.6% Irish2,081 8.6% Italian559 2.3% Polish552 2.3% European509 2.1% Canadian383 1.6% French Canadian295 1.2% Swedish243 1.0% French230 1.0% Scottish214 0.9% Dutch179 0.7% Portuguese160 0.7% Ukrainian134 0.6% Scotch-Irish133 0.5% Norwegian131 0.5% British127 0.5% Brazilian120 0.5% Hungarian109 0.5% Russian106 0.4% Lithuanian84 0.3% Danish78 0.3% Welsh59 0.2% Czech56 0.2% Armenian55 0.2% Scandinavian43 0.2% Austrian42 0.2% Slavic39 0.2% Palestinian39 0.2% Croatian38 0.2% Eastern European37 0.2% Cajun36 0.1% Barbadian35 0.1% Greek28 0.1% Pennsylvania German27 0.1% Celtic27 0.1% Haitian20 0.08% Slovak19 0.08% Finnish16 0.07% Northern European16 0.07% Romanian16 0.07% Israeli15 0.06% Czechoslovakian13 0.05% Lebanese11 0.05% Swiss10 0.04% Belgian9 0.04% Slovene8 0.03% Maltese7 0.03% Jordanian6 0.02% Bermudan2 0.01% Jamaican
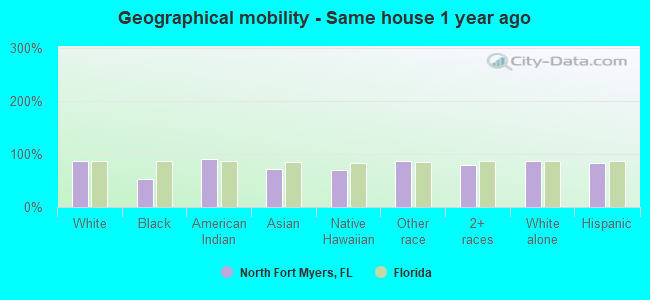
Geographical mobility in North Fort Myers Same house 1 year ago 31,282 86.5% White (Caucasian)326 52.3% Black or African American228 90.7% American Indian / Alaska Native472 71.3% Asian16 69.4% Native Hawaiian / Pacific Islander510 87.4% Other race3,642 78.8% Two or more races32,168 86.6% White alone, not Hispanic / Latino4,090 83.2% Hispanic or LatinoMoved within same county 1,925 5.3% White / Caucasian228 36.6% Black or African American12 4.7% American Indian / Alaska Native34 5.1% Asian27 4.7% Other race505 10.9% Two or more races2,022 5.4% White alone, not Hispanic / Latino398 8.1% Hispanic or LatinoMoved within same state 528 1.5% White / Caucasian15 2.3% Black or African American25 3.8% Asian15 2.5% Other race525 1.4% White alone, not Hispanic / Latino51 1.0% Hispanic or LatinoMoved from different state 2,135 5.9% White / Caucasian12 4.8% American Indian / Alaska Native88 13.2% Asian12 55.0% Native Hawaiian / Pacific Islander40 6.9% Other race196 4.2% Two or more races2,165 5.8% White alone, not Hispanic / Latino105 2.1% Hispanic or LatinoMoved from abroad 192 0.5% White69 1.5% Two or more races114 0.3% White alone, not Hispanic / Latino137 2.8% Hispanic or Latino
Children Nativity (place of birth) in North Fort Myers
Children under 6 years - Living with two parents Both parents native 621 100.0% NativeBoth parents foreign-born 165 100.0% NativeOne native, one foreign-born parent 168 100.0% NativeChildren under 6 years - Living with one parent Native parent 427 100.0% NativeForeign-born parent 53 100.0% Foreign-bornChildren 6 to 17 years - Living with two parents Both parents native 737 100.0% NativeBoth parents foreign-born 260 85.2% Native45 14.8% Foreign-bornOne native, one foreign-born parent 114 100.0% NativeChildren 6 to 17 years - Living with one parent Native parent 890 100.0% NativeForeign-born parent 236 70.1% Native101 29.9% Foreign-born
Grandparents responsible for own grandchildren in North Fort Myers
Grandparents (30 to 59 years) White / Caucasian 106 48.7% Responsible for grandchildren112 51.3% Not responsible for grandchildrenWhite alone, not Hispanic / Latino 129 47.4% Responsible for grandchildren143 52.6% Not responsible for grandchildrenGrandparents (60 years and over) White / Caucasian 31 31.7% Responsible for grandchildren68 68.3% Not responsible for grandchildrenWhite alone, not Hispanic / Latino 26 25.3% Responsible for grandchildren77 74.7% Not responsible for grandchildren