Races in North Columbia, Florida (FL) Detailed Stats
Ancestries, Foreign-born residents, place of birth
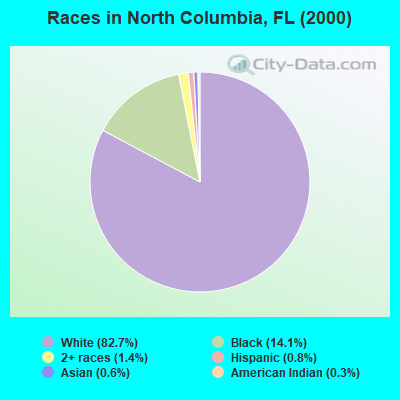
Race distribution in North Columbia

- 1,27282.7%White alone
- 21714.1%Black alone
- 221.4%Two or more races
- 130.8%Hispanic
- 100.6%Asian alone
- 50.3%American Indian alone
2000
2022
-
- 10,458,50965.4%White alone
- 2,682,71516.8%Hispanic
- 2,264,26814.2%Black alone
- 261,6931.6%Asian alone
- 236,9541.5%Two or more races
- 42,3580.3%American Indian alone
- 28,9940.2%Other race alone
- 6,8870.04%Native Hawaiian and Other
Pacific Islander alone

-
- 11,309,40350.8%White alone
- 6,025,03927.1%Hispanic
- 3,241,01514.6%Black alone
- 861,6303.9%Two or more races
- 623,6922.8%Asian alone
- 152,0540.7%Other race alone
- 22,5040.1%American Indian alone
- 9,4860.04%Native Hawaiian and Other
Pacific Islander alone

Income and house value in North Columbia
- Median household income in 2022
- $50,022White non-Hispanic householders
- $31,681Black householders
- $73,300Asian householders
- Median 2022 house value
- $142,125White Non-Hispanic householders
- $210,916Asian householders
Household income for White non-Hispanic householders

Household income for Black householders

Household income for American Indian and Alaska Native householders

Household income for Asian householders
