Races in North Benton, Oregon (OR) Detailed Stats
Ancestries, Foreign-born residents, place of birth
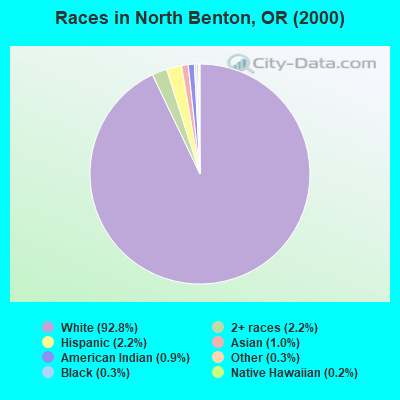
Race distribution in North Benton

- 3,46692.8%White alone
- 822.2%Hispanic
- 822.2%Two or more races
- 381.0%Asian alone
- 340.9%American Indian alone
- 100.3%Black alone
- 120.3%Other race alone
- 90.2%Native Hawaiian and Other
Pacific Islander alone
2000
2022
-
- 2,857,61683.5%White alone
- 275,3148.0%Hispanic
- 100,3332.9%Asian alone
- 82,7332.4%Two or more races
- 53,3251.6%Black alone
- 40,1301.2%American Indian alone
- 7,3980.2%Native Hawaiian and Other
Pacific Islander alone - 4,5500.1%Other race alone

-
- 3,037,57171.6%White alone
- 609,53814.4%Hispanic
- 252,7446.0%Two or more races
- 191,2834.5%Asian alone
- 78,2281.8%Black alone
- 29,3990.7%American Indian alone
- 25,7310.6%Other race alone
- 15,6430.4%Native Hawaiian and Other
Pacific Islander alone

Income and house value in North Benton
- Median household income in 2022
- $95,319White non-Hispanic householders
- $69,470American Indian and Alaska Native householders
- $111,827Asian householders
- $103,458Some other race householders
- $155,372Two or more races householders
- $97,056Hispanic or Latino race householders
- Median 2022 house value
- $627,967White Non-Hispanic householders
- $377,781American Indian or Alaska Native householders
- $848,756Asian householders
- $508,190Two or more races householders
Household income for White non-Hispanic householders

Household income for American Indian and Alaska Native householders

Household income for Asian householders

Household income for Native Hawaiian and other Pacific Islander householders

Household income for Two or more races householders

Household income for Hispanic or Latino race householders

Zip code: 97330