Races in North Bayside, Oregon (OR) Detailed Stats
Ancestries, Foreign-born residents, place of birth
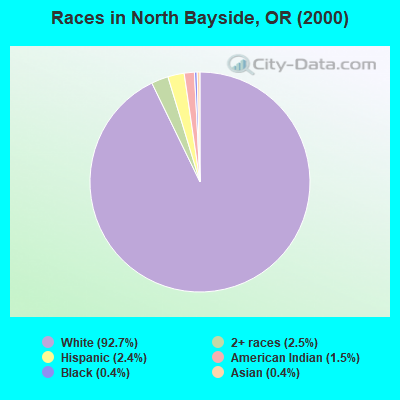
Race distribution in North Bayside

- 5,23692.7%White alone
- 1422.5%Two or more races
- 1332.4%Hispanic
- 861.5%American Indian alone
- 220.4%Asian alone
- 240.4%Black alone
- 50.09%Other race alone
- 30.05%Native Hawaiian and Other
Pacific Islander alone
2000
2022
-
- 2,857,61683.5%White alone
- 275,3148.0%Hispanic
- 100,3332.9%Asian alone
- 82,7332.4%Two or more races
- 53,3251.6%Black alone
- 40,1301.2%American Indian alone
- 7,3980.2%Native Hawaiian and Other
Pacific Islander alone - 4,5500.1%Other race alone

-
- 3,037,57171.6%White alone
- 609,53814.4%Hispanic
- 252,7446.0%Two or more races
- 191,2834.5%Asian alone
- 78,2281.8%Black alone
- 29,3990.7%American Indian alone
- 25,7310.6%Other race alone
- 15,6430.4%Native Hawaiian and Other
Pacific Islander alone

Income and house value in North Bayside
- Median household income in 2022
- $61,976White non-Hispanic householders
- $10,799Black householders
- $22,256American Indian and Alaska Native householders
- $32,788Asian householders
- $58,080Native Hawaiian and other Pacific Islander householders
- $54,719Some other race householders
- $52,415Two or more races householders
- $52,840Hispanic or Latino race householders
- Median 2022 house value
- $432,003White Non-Hispanic householders
- $531,822Black or African American householders
- $278,184American Indian or Alaska Native householders
- $278,184Some other race householders
- $450,003Two or more races householders
- $251,020Hispanic or Latino householders
Household income for White non-Hispanic householders

Household income for Black householders

Household income for American Indian and Alaska Native householders

Household income for Asian householders

Household income for Native Hawaiian and other Pacific Islander householders

Household income for Two or more races householders

Household income for Hispanic or Latino race householders

Zip code: 97459