Races in Norfolk, Nebraska (NE) Detailed Stats
Data:
Races - White alone (%)
Races - White alone (% change since 2000)
Races - Black alone (%)
Races - Black alone (% change since 2000)
Races - American Indian alone (%)
Races - American Indian alone (% change since 2000)
Races - Asian alone (%)
Races - Asian alone (% change since 2000)
Races - Hispanic (%)
Races - Hispanic (% change since 2000)
Races - Native Hawaiian and Other Pacific Islander alone (%)
Races - Native Hawaiian and Other Pacific Islander alone (% change since 2000)
Races - Two or more races(%)
Races - Two or more races(% change since 2000)
Races - Other race alone (%)
Races - Other race alone (% change since 2000)
Racial diversity
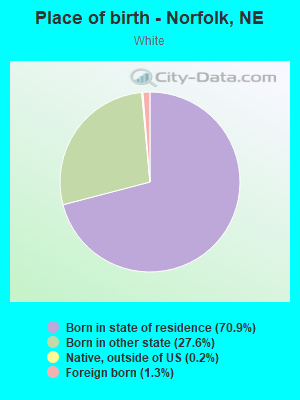
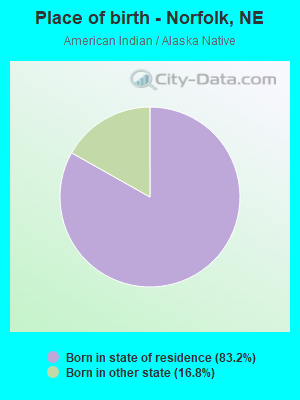
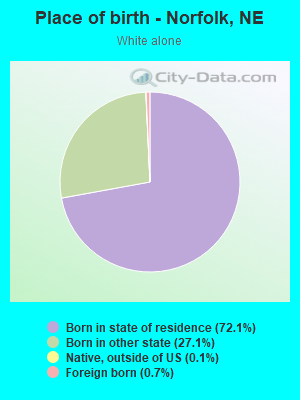
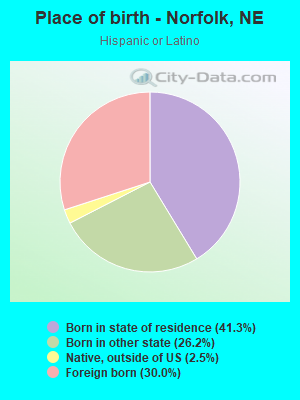
Place of birth - Born in state of residence (%)
Place of birth - Born in state of residence (%) - White
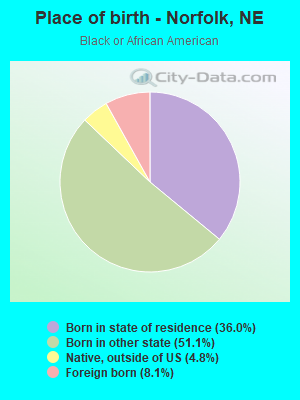
Place of birth - Born in state of residence (%) - Black or African American
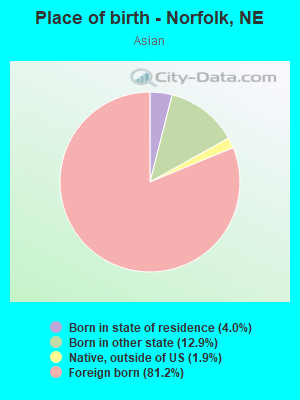
Place of birth - Born in state of residence (%) - Asian
Place of birth - Born in state of residence (%) - Hispanic or Latino
Place of birth - Born in state of residence (%) - American Indian and Alaska Native
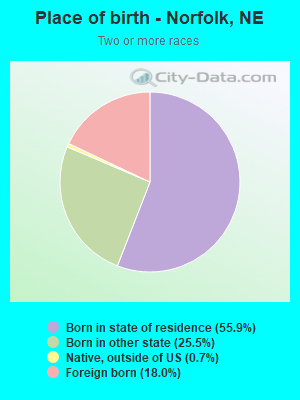
Place of birth - Born in state of residence (%) - Multirace
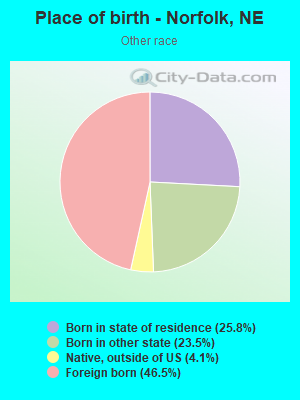
Place of birth - Born in state of residence (%) - Other Race
Place of birth - Born in other state (%)
Place of birth - Born in other state (%) - White
Place of birth - Born in other state (%) - Black or African American
Place of birth - Born in other state (%) - Asian
Place of birth - Born in other state (%) - Hispanic or Latino
Place of birth - Born in other state (%) - American Indian and Alaska Native
Place of birth - Born in other state (%) - Multirace
Place of birth - Born in other state (%) - Other Race
Place of birth - Native, outside of US (%)
Place of birth - Native, outside of US (%) - White
Place of birth - Native, outside of US (%) - Black or African American
Place of birth - Native, outside of US (%) - Asian
Place of birth - Native, outside of US (%) - Hispanic or Latino
Place of birth - Native, outside of US (%) - American Indian and Alaska Native
Place of birth - Native, outside of US (%) - Multirace
Place of birth - Native, outside of US (%) - Other Race
Place of birth - Foreign born (%)
Place of birth - Foreign born (%) - White
Place of birth - Foreign born (%) - Black or African American
Place of birth - Foreign born (%) - Asian
Place of birth - Foreign born (%) - Hispanic or Latino
Place of birth - Foreign born (%) - American Indian and Alaska Native
Place of birth - Foreign born (%) - Multirace
Place of birth - Foreign born (%) - Other Race
Residents speaking English at home (%)
Residents speaking English at home - Born in the United States (%)
Residents speaking English at home - Native, born elsewhere (%)
Residents speaking English at home - Foreign born (%)
Residents speaking Spanish at home (%)
Residents speaking Spanish at home - Born in the United States (%)
Residents speaking Spanish at home - Native, born elsewhere (%)
Residents speaking Spanish at home - Foreign born (%)
Residents speaking other language at home (%)
Residents speaking other language at home - Born in the United States (%)
Residents speaking other language at home - Native, born elsewhere (%)
Residents speaking other language at home - Foreign born (%)
Marital status - Never married (%)
Marital status - Now married (%)
Marital status - Separated (%)
Marital status - Widowed (%)
Marital status - Divorced (%)
Ancestries Reported - Arab (%)
Ancestries Reported - Czech (%)
Ancestries Reported - Danish (%)
Ancestries Reported - Dutch (%)
Ancestries Reported - English (%)
Ancestries Reported - French (%)
Ancestries Reported - French Canadian (%)
Ancestries Reported - German (%)
Ancestries Reported - Greek (%)
Ancestries Reported - Hungarian (%)
Ancestries Reported - Irish (%)
Ancestries Reported - Italian (%)
Ancestries Reported - Lithuanian (%)
Ancestries Reported - Norwegian (%)
Ancestries Reported - Polish (%)
Ancestries Reported - Portuguese (%)
Ancestries Reported - Russian (%)
Ancestries Reported - Scotch-Irish (%)
Ancestries Reported - Scottish (%)
Ancestries Reported - Slovak (%)
Ancestries Reported - Subsaharan African (%)
Ancestries Reported - Swedish (%)
Ancestries Reported - Swiss (%)
Ancestries Reported - Ukrainian (%)
Ancestries Reported - United States (%)
Ancestries Reported - Welsh (%)
Ancestries Reported - West Indian (%)
Ancestries Reported - Other (%)
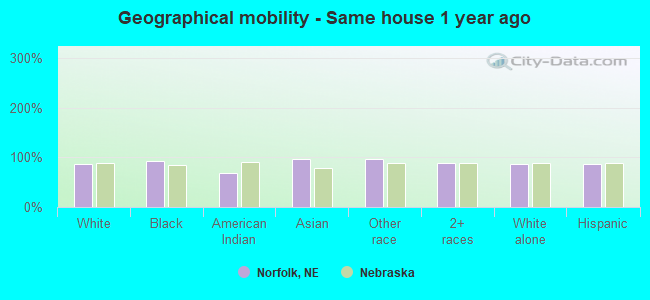
Geographical mobility - Same house 1 year ago (%)
Geographical mobility - Same house 1 year ago (%) - White
Geographical mobility - Same house 1 year ago (%) - Black or African American
Geographical mobility - Same house 1 year ago (%) - Asian
Geographical mobility - Same house 1 year ago (%) - Hispanic or Latino
Geographical mobility - Same house 1 year ago (%) - American Indian and Alaska Native
Geographical mobility - Same house 1 year ago (%) - Multirace
Geographical mobility - Same house 1 year ago (%) - Other Race
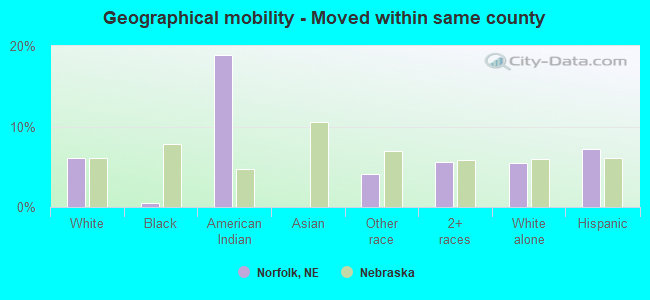
Geographical mobility - Moved within same county (%)
Geographical mobility - Moved within same county (%) - White
Geographical mobility - Moved within same county (%) - Black or African American
Geographical mobility - Moved within same county (%) - Asian
Geographical mobility - Moved within same county (%) - Hispanic or Latino
Geographical mobility - Moved within same county (%) - American Indian and Alaska Native
Geographical mobility - Moved within same county (%) - Multirace
Geographical mobility - Moved within same county (%) - Other Race
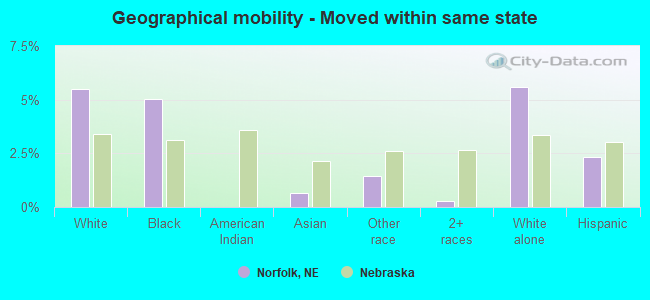
Geographical mobility - Moved from different county within same state (%)
Geographical mobility - Moved from different county within same state (%) - White
Geographical mobility - Moved from different county within same state (%) - Black or African American
Geographical mobility - Moved from different county within same state (%) - Asian
Geographical mobility - Moved from different county within same state (%) - Hispanic or Latino
Geographical mobility - Moved from different county within same state (%) - American Indian and Alaska Native
Geographical mobility - Moved from different county within same state (%) - Multirace
Geographical mobility - Moved from different county within same state (%) - Other Race
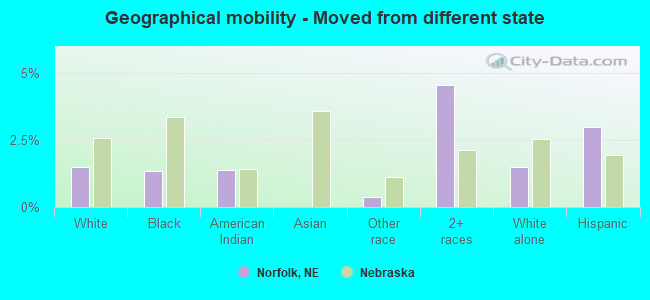
Geographical mobility - Moved from different state (%)
Geographical mobility - Moved from different state (%) - White
Geographical mobility - Moved from different state (%) - Black or African American
Geographical mobility - Moved from different state (%) - Asian
Geographical mobility - Moved from different state (%) - Hispanic or Latino
Geographical mobility - Moved from different state (%) - American Indian and Alaska Native
Geographical mobility - Moved from different state (%) - Multirace
Geographical mobility - Moved from different state (%) - Other Race
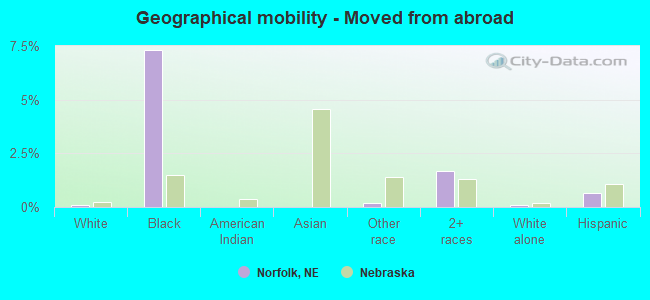
Geographical mobility - Moved from abroad (%)
Geographical mobility - Moved from abroad (%) - White
Geographical mobility - Moved from abroad (%) - Black or African American
Geographical mobility - Moved from abroad (%) - Asian
Geographical mobility - Moved from abroad (%) - Hispanic or Latino
Geographical mobility - Moved from abroad (%) - American Indian and Alaska Native
Geographical mobility - Moved from abroad (%) - Multirace
Geographical mobility - Moved from abroad (%) - Other Race
Place of birth for the foreign-born population - Ireland (%)
Place of birth for the foreign-born population - Denmark (%)
Place of birth for the foreign-born population - Norway (%)
Place of birth for the foreign-born population - Sweden (%)
Place of birth for the foreign-born population - United Kingdom (%)
Place of birth for the foreign-born population - England (%)
Place of birth for the foreign-born population - Scotland (%)
Place of birth for the foreign-born population - Other Northern Europe (%)
Place of birth for the foreign-born population - Austria (%)
Place of birth for the foreign-born population - Belgium (%)
Place of birth for the foreign-born population - France (%)
Place of birth for the foreign-born population - Germany (%)
Place of birth for the foreign-born population - Netherlands (%)
Place of birth for the foreign-born population - Switzerland (%)
Place of birth for the foreign-born population - Other Western Europe (%)
Place of birth for the foreign-born population - Greece (%)
Place of birth for the foreign-born population - Italy (%)
Place of birth for the foreign-born population - Portugal (%)
Place of birth for the foreign-born population - Spain (%)
Place of birth for the foreign-born population - Other Southern Europe (%)
Place of birth for the foreign-born population - Albania (%)
Place of birth for the foreign-born population - Belarus (%)
Place of birth for the foreign-born population - Bosnia and Herzegovina (%)
Place of birth for the foreign-born population - Bulgaria (%)
Place of birth for the foreign-born population - Croatia (%)
Place of birth for the foreign-born population - Czechoslovakia (%)
Place of birth for the foreign-born population - Hungary (%)
Place of birth for the foreign-born population - Latvia (%)
Place of birth for the foreign-born population - Lithuania (%)
Place of birth for the foreign-born population - North Macedonia (Macedonia) (%)
Place of birth for the foreign-born population - Moldova (%)
Place of birth for the foreign-born population - Poland (%)
Place of birth for the foreign-born population - Romania (%)
Place of birth for the foreign-born population - Russia (%)
Place of birth for the foreign-born population - Serbia (%)
Place of birth for the foreign-born population - Ukraine (%)
Place of birth for the foreign-born population - Other Eastern Europe (%)
Place of birth for the foreign-born population - China (%)
Place of birth for the foreign-born population - Hong Kong (%)
Place of birth for the foreign-born population - Taiwan (%)
Place of birth for the foreign-born population - Japan (%)
Place of birth for the foreign-born population - Korea (%)
Place of birth for the foreign-born population - Other Eastern Asia (%)
Place of birth for the foreign-born population - Afghanistan (%)
Place of birth for the foreign-born population - Bangladesh (%)
Place of birth for the foreign-born population - India (%)
Place of birth for the foreign-born population - Iran (%)
Place of birth for the foreign-born population - Kazakhstan (%)
Place of birth for the foreign-born population - Nepal (%)
Place of birth for the foreign-born population - Pakistan (%)
Place of birth for the foreign-born population - Sri Lanka (%)
Place of birth for the foreign-born population - Uzbekistan (%)
Place of birth for the foreign-born population - Other South Central Asia (%)
Place of birth for the foreign-born population - Burma (%)
Place of birth for the foreign-born population - Cambodia (%)
Place of birth for the foreign-born population - Indonesia (%)
Place of birth for the foreign-born population - Laos (%)
Place of birth for the foreign-born population - Malaysia (%)
Place of birth for the foreign-born population - Philippines (%)
Place of birth for the foreign-born population - Singapore (%)
Place of birth for the foreign-born population - Thailand (%)
Place of birth for the foreign-born population - Vietnam (%)
Place of birth for the foreign-born population - Other South Eastern Asia (%)
Place of birth for the foreign-born population - Armenia (%)
Place of birth for the foreign-born population - Iraq (%)
Place of birth for the foreign-born population - Israel (%)
Place of birth for the foreign-born population - Jordan (%)
Place of birth for the foreign-born population - Kuwait (%)
Place of birth for the foreign-born population - Lebanon (%)
Place of birth for the foreign-born population - Saudi Arabia (%)
Place of birth for the foreign-born population - Syria (%)
Place of birth for the foreign-born population - Turkey (%)
Place of birth for the foreign-born population - Yemen (%)
Place of birth for the foreign-born population - Other Western Asia (%)
Place of birth for the foreign-born population - Eritrea (%)
Place of birth for the foreign-born population - Ethiopia (%)
Place of birth for the foreign-born population - Kenya (%)
Place of birth for the foreign-born population - Somalia (%)
Place of birth for the foreign-born population - Uganda (%)
Place of birth for the foreign-born population - Zimbabwe (%)
Place of birth for the foreign-born population - Other Eastern Africa (%)
Place of birth for the foreign-born population - Cameroon (%)
Place of birth for the foreign-born population - Congo (%)
Place of birth for the foreign-born population - Democratic Republic of Congo (Zaire) (%)
Place of birth for the foreign-born population - Other Middle Africa (%)
Place of birth for the foreign-born population - Egypt (%)
Place of birth for the foreign-born population - Morocco (%)
Place of birth for the foreign-born population - Sudan (%)
Place of birth for the foreign-born population - Other Northern Africa (%)
Place of birth for the foreign-born population - South Africa (%)
Place of birth for the foreign-born population - Other Southern Africa (%)
Place of birth for the foreign-born population - Cabo Verde (%)
Place of birth for the foreign-born population - Ghana (%)
Place of birth for the foreign-born population - Liberia (%)
Place of birth for the foreign-born population - Nigeria (%)
Place of birth for the foreign-born population - Senegal (%)
Place of birth for the foreign-born population - Sierra Leone (%)
Place of birth for the foreign-born population - Other Western Africa (%)
Place of birth for the foreign-born population - Australia (%)
Place of birth for the foreign-born population - New Zealand (%)
Place of birth for the foreign-born population - Fiji (%)
Place of birth for the foreign-born population - Micronesia (%)
Place of birth for the foreign-born population - Bahamas (%)
Place of birth for the foreign-born population - Barbados (%)
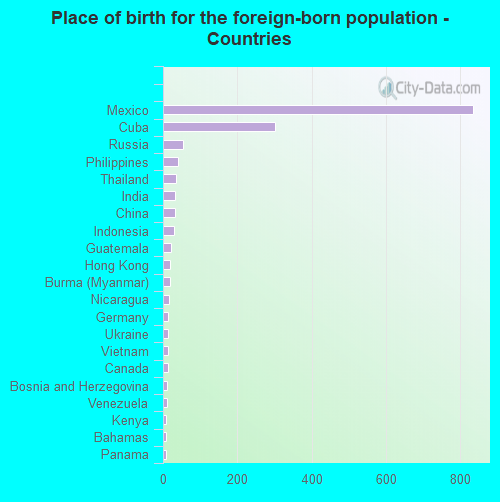
Place of birth for the foreign-born population - Cuba (%)
Place of birth for the foreign-born population - Dominica (%)
Place of birth for the foreign-born population - Dominican Republic (%)
Place of birth for the foreign-born population - Grenada (%)
Place of birth for the foreign-born population - Haiti (%)
Place of birth for the foreign-born population - Jamaica (%)
Place of birth for the foreign-born population - St. Vincent and the Grenadines (%)
Place of birth for the foreign-born population - Trinidad and Tobago (%)
Place of birth for the foreign-born population - West Indies (%)
Place of birth for the foreign-born population - Other Caribbean (%)
Place of birth for the foreign-born population - Belize (%)
Place of birth for the foreign-born population - Costa Rica (%)
Place of birth for the foreign-born population - El Salvador (%)
Place of birth for the foreign-born population - Guatemala (%)
Place of birth for the foreign-born population - Honduras (%)
Place of birth for the foreign-born population - Mexico (%)
Place of birth for the foreign-born population - Nicaragua (%)
Place of birth for the foreign-born population - Panama (%)
Place of birth for the foreign-born population - Other Central America (%)
Place of birth for the foreign-born population - Argentina (%)
Place of birth for the foreign-born population - Bolivia (%)
Place of birth for the foreign-born population - Brazil (%)
Place of birth for the foreign-born population - Chile (%)
Place of birth for the foreign-born population - Colombia (%)
Place of birth for the foreign-born population - Ecuador (%)
Place of birth for the foreign-born population - Guyana (%)
Place of birth for the foreign-born population - Peru (%)
Place of birth for the foreign-born population - Uruguay (%)
Place of birth for the foreign-born population - Venezuela (%)
Place of birth for the foreign-born population - Other South America (%)
Place of birth for the foreign-born population - Canada (%)
Place of birth for the foreign-born population - Other Northern America (%)
Place of birth for the foreign-born population - Other (%)
Latest news about races in Norfolk, NE collected exclusively by city-data.com from local newspapers, TV, and radio stations
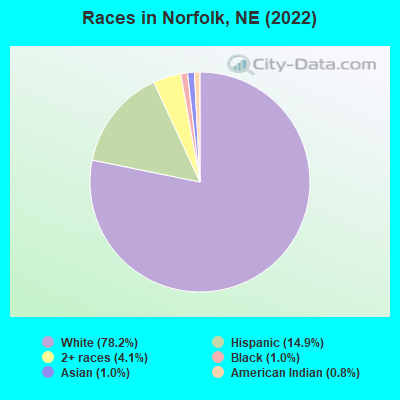
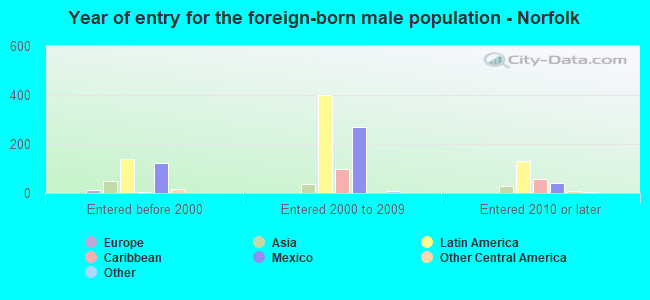
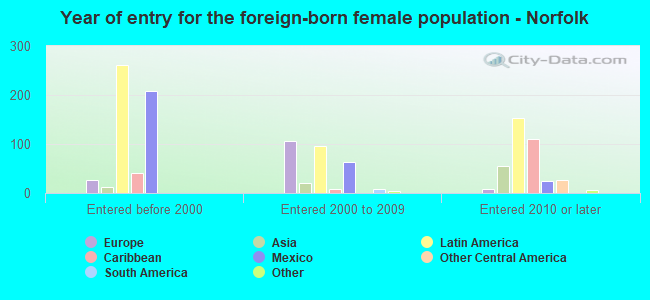
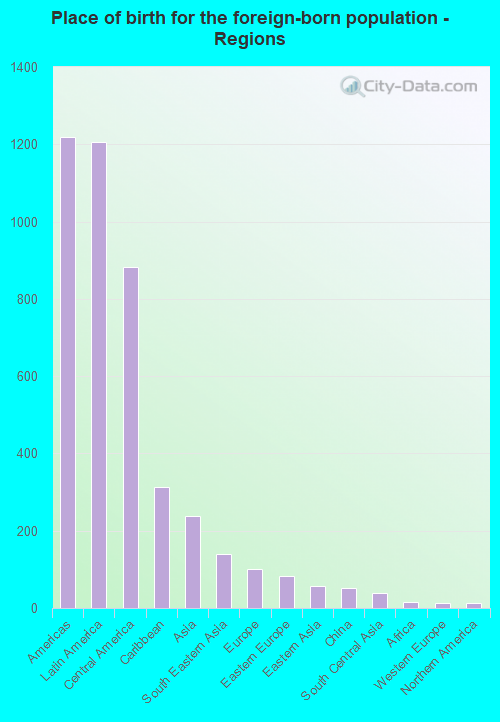
According to 2022 data, the most numerous races in Norfolk, NE are White alone (20,325 residents), Hispanic (3,867 residents), and Black alone (259 residents). 89.1% of Norfolk residents speak English at home. 6.0% of Norfolk, NE residents are foreign-born (4.6% born in Latin America, 0.9% born in Asia), which is 15.7% less than the foreign-born rate of 7.0% across the entire state of Nebraska.
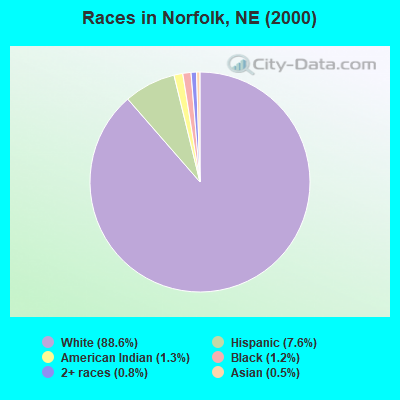
Race distribution in Norfolk
2000 2022
1,494,494 87.3% White alone 94,425 5.5% Hispanic 67,537 3.9% Black alone 21,677 1.3% Asian alone 17,696 1.0% Two or more races 13,460 0.8% American Indian alone 1,327 0.08% Other race alone 647 0.04% Native Hawaiian and Other
1,492,005 75.8% White alone 241,898 12.3% Hispanic 89,520 4.5% Black alone 76,499 3.9% Two or more races 49,261 2.5% Asian alone 10,249 0.5% American Indian alone 7,425 0.4% Other race alone 1,066 0.05% Native Hawaiian and Other
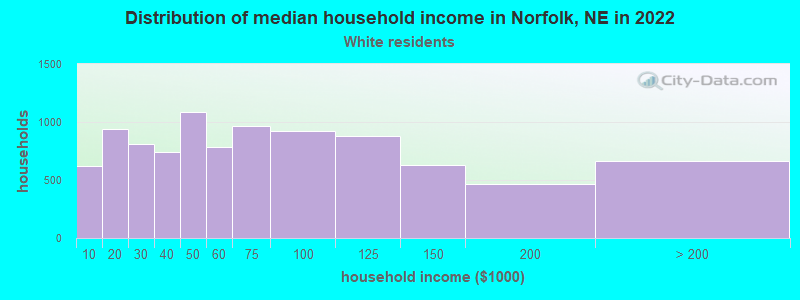
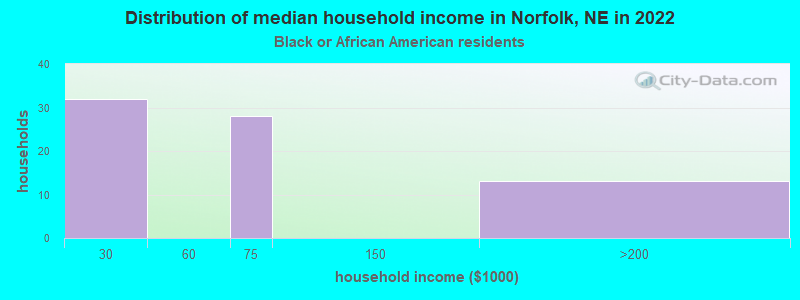
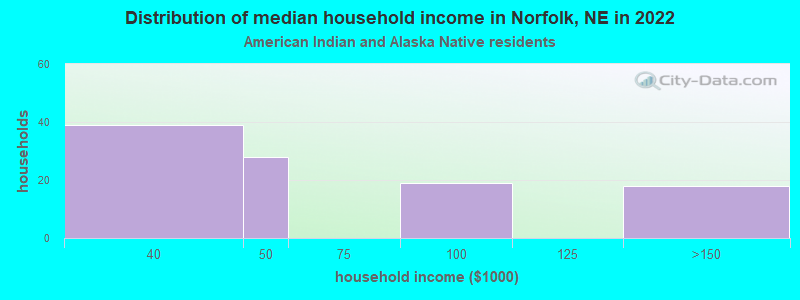
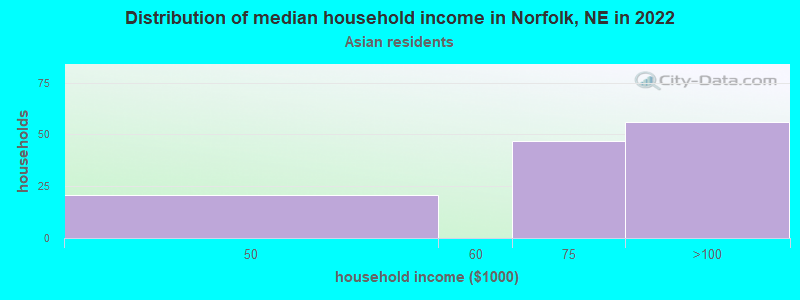
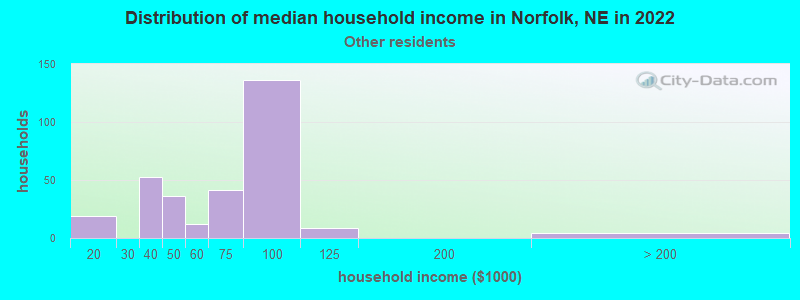
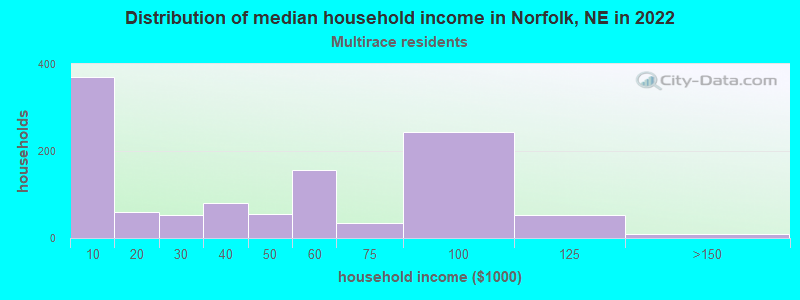
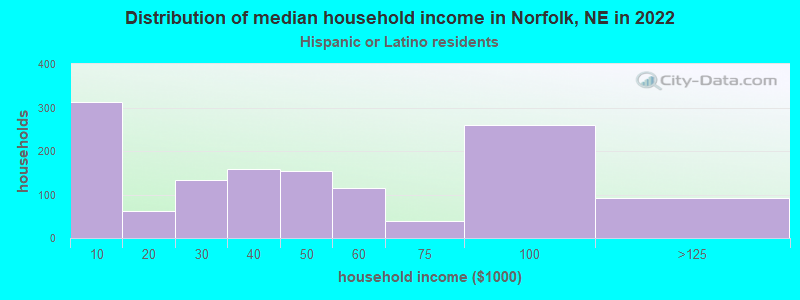
Income and house value in Norfolk Median household income in 2022 $59,279 White non-Hispanic householders$71,999 Asian householders$68,430 Some other race householders$35,783 Two or more races householders$43,974 Hispanic or Latino race householdersMedian 2022 house value $222,713 White Non-Hispanic householders$367,624 American Indian or Alaska Native householders $328,589 Asian householders$189,025 Some other race householders$128,334 Two or more races householders$181,539 Hispanic or Latino householders
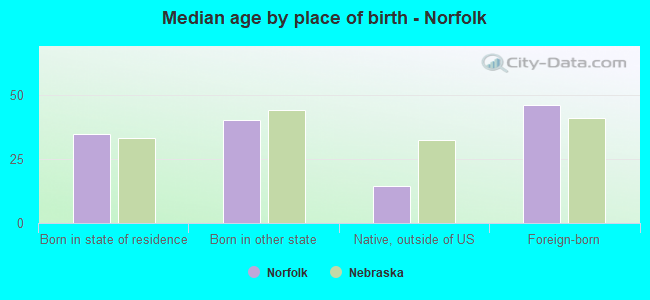
Median age by race in Norfolk
40.9 Median age for White residents39.7 42.7 28.9 Median age for Black or African American residents30.8 13.2 20.3 Median age for American Indian / Alaska Native residents22.1 20.4 31.7 Median age for Asian residents31.8 35.8 -699,999,999.3 Median age for Native Hawaiian / Pacific Islander residents-672,108,842.9 -689,223,057.0 35.2 Median age for Other race residents34.2 35.8 23.7 Median age for Two or more races residents19.7 24.6 41.5 Median age for White alone residents39.9 43.5 24.6 Median age for Hispanic or Latino residents24.0 24.9
Owner/renter occupied households by race in Norfolk
House owners and renters - White residents 6,016 63.6% Owner occupied3,436 36.4% Renter occupiedHouse owners and renters - Black or African American residents 26 32.9% Owner occupied53 67.1% Renter occupiedHouse owners and renters - American Indian / Alaska Native residents 74 65.4% Owner occupied39 34.6% Renter occupiedHouse owners and renters - Asian residents 94 100.0% Renter occupiedHouse owners and renters - Other race residents 154 42.5% Owner occupied208 57.5% Renter occupiedHouse owners and renters - Two or more races residents 648 58.9% Owner occupied452 41.1% Renter occupiedHouse owners and renters - White alone residents 5,970 64.7% Owner occupied3,259 35.3% Renter occupiedHouse owners and renters - Hispanic or Latino residents 517 41.1% Owner occupied740 58.9% Renter occupied
Language usage in Norfolk
English speakers - Total 89.1% of residents of Norfolk speak English at home.
9.1% of residents speak Spanish at home 1,237 56.0% Speak English very well973 44.0% Speak English less than very well1.6% of residents speak other language at home 232 58.4% Speak English very well165 41.6% Speak English less than very well
English speakers - Born in the United States 89.9% of residents of Norfolk speak English at home.
8.9% of residents speak Spanish at home 479 77.1% Speak English very well142 22.9% Speak English less than very well0.3% of residents speak other language at home 11 61.1% Speak English very well7 38.9% Speak English less than very well
All residents speak only English at home
English speakers - Foreign-born 10.9% of residents of Norfolk speak English at home.
71.7% of residents speak Spanish at home 340 31.6% Speak English very well735 68.4% Speak English less than very well17.4% of residents speak other language at home 108 41.4% Speak English very well153 58.6% Speak English less than very well
White (Caucasian) - Speak only English Native:
98.1% (19,284)Foreign-born:
18.6% (49)
White (Caucasian) - Speak another language Native:
2.0% (392)Foreign-born:
79.1% (211)
Black or African American - Speak only English Native:
96.3% (240)Foreign-born:
73.6% (16)
Black or African American - Speak another language Native:
3.0% (8)Foreign-born:
41.4% (9)
Asian - Speak only English Native:
8.9% (2)Foreign-born:
13.6% (28)
Asian - Speak another language Native:
84.0% (23)Foreign-born:
86.5% (176)
Other race - Speak only English Native:
26.7% (175)Foreign-born:
13.3% (76)
Other race - Speak another language Native:
67.3% (442)Foreign-born:
84.5% (483)
Two or more races - Speak another language Native:
25.4% (483)Foreign-born:
100.0% (549)
White alone - Speak only English Native:
99.1% (18,947)Foreign-born:
31.5% (44)
White alone - Speak another language Native:
0.8% (162)Foreign-born:
68.7% (96)
Hispanic or Latino - Speak only English Native:
48.9% (1,094)Foreign-born:
6.4% (74)
Hispanic or Latino - Speak another language Native:
48.1% (1,076)Foreign-born:
93.3% (1,084)
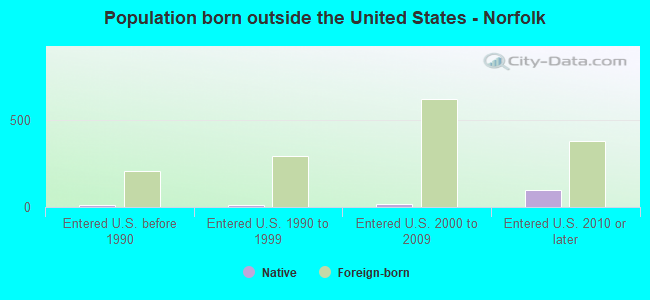
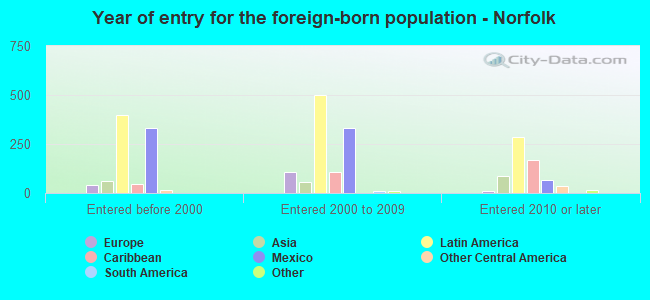
Foreign-born residents in Norfolk 1,573 residents are foreign born (4.6% Latin America , 0.9% Asia ).
This city:
6.0%Nebraska:
7.5%
Marital status for residents in Norfolk Marital status - White (Caucasian) population 15 years and over
Males 34.3% Never married51.0% Now married0.2% Separated5.3% Widowed9.3% DivorcedFemales 27.4% Never married47.1% Now married0.6% Separated11.2% Widowed13.6% DivorcedWomen who gave birth in the past 12 months Now married:
63.6% (113)Unmarried:
36.4% (65)
Women who did not give birth in the past 12 months Now married:
40.5% (1,787)Unmarried:
59.5% (2,629)
Marital status - Black or African American population 15 years and over
Males 74.5% Never married25.5% Now married0.0% Separated0.0% Widowed0.0% DivorcedFemales 43.9% Never married0.0% Now married0.0% Separated0.0% Widowed56.1% DivorcedWomen who did not give birth in the past 12 months Now married:
0.0% (0)Unmarried:
100.0% (49)
Marital status - American Indian / Alaska Native population 15 years and over
Males 82.0% Never married16.4% Now married0.0% Separated0.0% Widowed1.6% DivorcedFemales 59.3% Never married14.7% Now married0.0% Separated15.3% Widowed10.7% DivorcedWomen who did not give birth in the past 12 months Now married:
17.3% (25)Unmarried:
82.7% (117)
Marital status - Asian population 15 years and over
Males 39.3% Never married50.0% Now married0.0% Separated0.0% Widowed10.7% DivorcedFemales 4.0% Never married96.0% Now married0.0% Separated0.0% Widowed0.0% DivorcedWomen who gave birth in the past 12 months Now married:
100.0% (7)Unmarried:
0.0% (0)
Women who did not give birth in the past 12 months Now married:
95.7% (93)Unmarried:
4.3% (4)
Marital status - Other race population 15 years and over
Males 42.3% Never married48.6% Now married4.2% Separated0.0% Widowed4.9% DivorcedFemales 32.1% Never married60.7% Now married4.6% Separated0.0% Widowed2.6% DivorcedWomen who did not give birth in the past 12 months Now married:
46.5% (111)Unmarried:
53.5% (128)
Marital status - Two or more races population 15 years and over
Males 41.7% Never married36.0% Now married0.0% Separated0.0% Widowed22.3% DivorcedFemales 50.8% Never married33.1% Now married0.0% Separated0.0% Widowed16.0% DivorcedWomen who gave birth in the past 12 months Now married:
5.7% (7)Unmarried:
94.3% (119)
Women who did not give birth in the past 12 months Now married:
31.5% (228)Unmarried:
68.5% (496)
Marital status - White alone, not Hispanic / Latino population 15 years and over
Males 33.8% Never married51.0% Now married0.2% Separated5.5% Widowed9.5% DivorcedFemales 27.2% Never married47.5% Now married0.3% Separated11.5% Widowed13.5% DivorcedWomen who gave birth in the past 12 months Now married:
61.7% (107)Unmarried:
38.3% (67)
Women who did not give birth in the past 12 months Now married:
40.2% (1,684)Unmarried:
59.8% (2,510)
Marital status - Hispanic or Latino population 15 years and over
Males 46.1% Never married40.5% Now married1.7% Separated0.0% Widowed11.7% DivorcedFemales 41.5% Never married36.5% Now married3.2% Separated2.6% Widowed16.3% DivorcedWomen who gave birth in the past 12 months Now married:
9.8% (9)Unmarried:
90.2% (87)
Women who did not give birth in the past 12 months Now married:
33.8% (302)Unmarried:
66.2% (592)
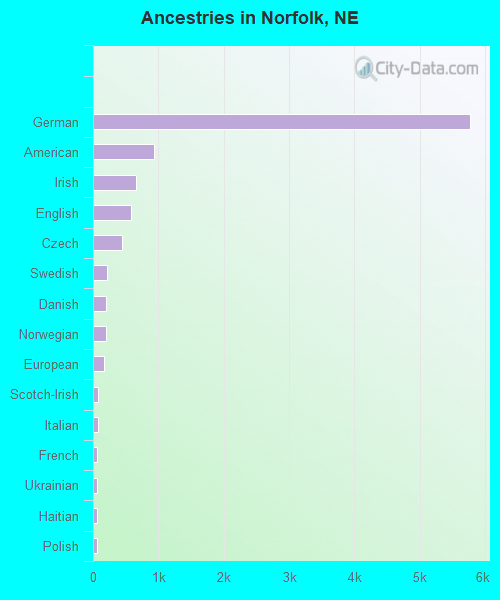
Ancestries in Norfolk
5,771 42.6% German935 6.9% American662 4.9% Irish583 4.3% English451 3.3% Czech211 1.6% Swedish206 1.5% Danish201 1.5% Norwegian162 1.2% European71 0.5% Scotch-Irish70 0.5% Italian66 0.5% French65 0.5% Ukrainian58 0.4% Haitian57 0.4% Polish41 0.3% Scandinavian35 0.3% Russian27 0.2% Scottish23 0.2% Dutch23 0.2% Pennsylvania German20 0.1% Yugoslavian17 0.1% Swiss15 0.1% British13 0.10% French Canadian13 0.10% Hungarian11 0.08% Eastern European7 0.05% Jamaican5 0.04% Belgian5 0.04% Israeli3 0.02% African2 0.01% Sudanese
Geographical mobility in Norfolk Same house 1 year ago 18,031 86.6% White (Caucasian)247 92.1% Black or African American273 68.5% American Indian / Alaska Native248 96.9% Asian1,198 96.4% Other race2,615 87.6% Two or more races17,557 87.2% White alone, not Hispanic / Latino3,257 85.8% Hispanic or LatinoMoved within same county 1,258 6.0% White / Caucasian1 0.5% Black or African American75 18.8% American Indian / Alaska Native51 4.1% Other race165 5.5% Two or more races1,110 5.5% White alone, not Hispanic / Latino275 7.2% Hispanic or LatinoMoved within same state 1,147 5.5% White / Caucasian13 5.0% Black or African American2 0.7% Asian18 1.5% Other race9 0.3% Two or more races1,121 5.6% White alone, not Hispanic / Latino89 2.3% Hispanic or LatinoMoved from different state 312 1.5% White / Caucasian4 1.3% Black or African American6 1.4% American Indian / Alaska Native4 0.4% Other race136 4.5% Two or more races298 1.5% White alone, not Hispanic / Latino113 3.0% Hispanic or LatinoMoved from abroad 19 0.1% White20 7.3% Black or African American2 0.2% Other race50 1.7% Two or more races22 0.1% White alone, not Hispanic / Latino24 0.6% Hispanic or Latino
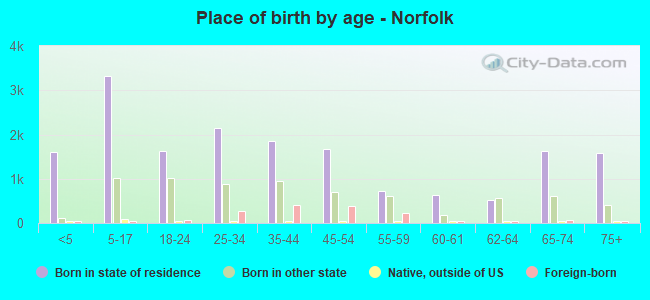
Children Nativity (place of birth) in Norfolk
Children under 6 years - Living with two parents Both parents native 1,246 100.0% NativeBoth parents foreign-born 139 100.0% NativeOne native, one foreign-born parent 106 100.0% NativeChildren under 6 years - Living with one parent Native parent 573 100.0% NativeForeign-born parent 95 100.0% NativeChildren 6 to 17 years - Living with two parents Both parents native 2,342 100.0% Native0 0.0% Foreign-bornBoth parents foreign-born 180 85.4% Native31 14.6% Foreign-bornOne native, one foreign-born parent 145 100.0% NativeChildren 6 to 17 years - Living with one parent Native parent 1,109 100.0% Native
Grandparents responsible for own grandchildren in Norfolk
Grandparents (30 to 59 years) White / Caucasian 60 100.0% Not responsible for grandchildrenOther race 22 100.0% Not responsible for grandchildrenWhite alone, not Hispanic / Latino 26 100.0% Not responsible for grandchildrenHispanic or Latino 35 100.0% Not responsible for grandchildrenGrandparents (60 years and over) White / Caucasian 10 13.8% Responsible for grandchildren61 86.2% Not responsible for grandchildrenWhite alone, not Hispanic / Latino 64 100.0% Not responsible for grandchildrenHispanic or Latino 9 100.0% Responsible for grandchildren