Races in Nocatee, Florida (FL) Detailed Stats
Data:
Races - White alone (%)
Races - White alone (% change since 2000)
Races - Black alone (%)
Races - Black alone (% change since 2000)
Races - American Indian alone (%)
Races - American Indian alone (% change since 2000)
Races - Asian alone (%)
Races - Asian alone (% change since 2000)
Races - Hispanic (%)
Races - Hispanic (% change since 2000)
Races - Native Hawaiian and Other Pacific Islander alone (%)
Races - Native Hawaiian and Other Pacific Islander alone (% change since 2000)
Races - Two or more races(%)
Races - Two or more races(% change since 2000)
Races - Other race alone (%)
Races - Other race alone (% change since 2000)
Racial diversity
Place of birth - Born in state of residence (%)
Place of birth - Born in state of residence (%) - White
Place of birth - Born in state of residence (%) - Black or African American
Place of birth - Born in state of residence (%) - Asian
Place of birth - Born in state of residence (%) - Hispanic or Latino
Place of birth - Born in state of residence (%) - American Indian and Alaska Native
Place of birth - Born in state of residence (%) - Multirace
Place of birth - Born in state of residence (%) - Other Race
Place of birth - Born in other state (%)
Place of birth - Born in other state (%) - White
Place of birth - Born in other state (%) - Black or African American
Place of birth - Born in other state (%) - Asian
Place of birth - Born in other state (%) - Hispanic or Latino
Place of birth - Born in other state (%) - American Indian and Alaska Native
Place of birth - Born in other state (%) - Multirace
Place of birth - Born in other state (%) - Other Race
Place of birth - Native, outside of US (%)
Place of birth - Native, outside of US (%) - White
Place of birth - Native, outside of US (%) - Black or African American
Place of birth - Native, outside of US (%) - Asian
Place of birth - Native, outside of US (%) - Hispanic or Latino
Place of birth - Native, outside of US (%) - American Indian and Alaska Native
Place of birth - Native, outside of US (%) - Multirace
Place of birth - Native, outside of US (%) - Other Race
Place of birth - Foreign born (%)
Place of birth - Foreign born (%) - White
Place of birth - Foreign born (%) - Black or African American
Place of birth - Foreign born (%) - Asian
Place of birth - Foreign born (%) - Hispanic or Latino
Place of birth - Foreign born (%) - American Indian and Alaska Native
Place of birth - Foreign born (%) - Multirace
Place of birth - Foreign born (%) - Other Race
Residents speaking English at home (%)
Residents speaking English at home - Born in the United States (%)
Residents speaking English at home - Native, born elsewhere (%)
Residents speaking English at home - Foreign born (%)
Residents speaking Spanish at home (%)
Residents speaking Spanish at home - Born in the United States (%)
Residents speaking Spanish at home - Native, born elsewhere (%)
Residents speaking Spanish at home - Foreign born (%)
Residents speaking other language at home (%)
Residents speaking other language at home - Born in the United States (%)
Residents speaking other language at home - Native, born elsewhere (%)
Residents speaking other language at home - Foreign born (%)
Marital status - Never married (%)
Marital status - Now married (%)
Marital status - Separated (%)
Marital status - Widowed (%)
Marital status - Divorced (%)
Ancestries Reported - Arab (%)
Ancestries Reported - Czech (%)
Ancestries Reported - Danish (%)
Ancestries Reported - Dutch (%)
Ancestries Reported - English (%)
Ancestries Reported - French (%)
Ancestries Reported - French Canadian (%)
Ancestries Reported - German (%)
Ancestries Reported - Greek (%)
Ancestries Reported - Hungarian (%)
Ancestries Reported - Irish (%)
Ancestries Reported - Italian (%)
Ancestries Reported - Lithuanian (%)
Ancestries Reported - Norwegian (%)
Ancestries Reported - Polish (%)
Ancestries Reported - Portuguese (%)
Ancestries Reported - Russian (%)
Ancestries Reported - Scotch-Irish (%)
Ancestries Reported - Scottish (%)
Ancestries Reported - Slovak (%)
Ancestries Reported - Subsaharan African (%)
Ancestries Reported - Swedish (%)
Ancestries Reported - Swiss (%)
Ancestries Reported - Ukrainian (%)
Ancestries Reported - United States (%)
Ancestries Reported - Welsh (%)
Ancestries Reported - West Indian (%)
Ancestries Reported - Other (%)
Geographical mobility - Same house 1 year ago (%)
Geographical mobility - Same house 1 year ago (%) - White
Geographical mobility - Same house 1 year ago (%) - Black or African American
Geographical mobility - Same house 1 year ago (%) - Asian
Geographical mobility - Same house 1 year ago (%) - Hispanic or Latino
Geographical mobility - Same house 1 year ago (%) - American Indian and Alaska Native
Geographical mobility - Same house 1 year ago (%) - Multirace
Geographical mobility - Same house 1 year ago (%) - Other Race
Geographical mobility - Moved within same county (%)
Geographical mobility - Moved within same county (%) - White
Geographical mobility - Moved within same county (%) - Black or African American
Geographical mobility - Moved within same county (%) - Asian
Geographical mobility - Moved within same county (%) - Hispanic or Latino
Geographical mobility - Moved within same county (%) - American Indian and Alaska Native
Geographical mobility - Moved within same county (%) - Multirace
Geographical mobility - Moved within same county (%) - Other Race
Geographical mobility - Moved from different county within same state (%)
Geographical mobility - Moved from different county within same state (%) - White
Geographical mobility - Moved from different county within same state (%) - Black or African American
Geographical mobility - Moved from different county within same state (%) - Asian
Geographical mobility - Moved from different county within same state (%) - Hispanic or Latino
Geographical mobility - Moved from different county within same state (%) - American Indian and Alaska Native
Geographical mobility - Moved from different county within same state (%) - Multirace
Geographical mobility - Moved from different county within same state (%) - Other Race
Geographical mobility - Moved from different state (%)
Geographical mobility - Moved from different state (%) - White
Geographical mobility - Moved from different state (%) - Black or African American
Geographical mobility - Moved from different state (%) - Asian
Geographical mobility - Moved from different state (%) - Hispanic or Latino
Geographical mobility - Moved from different state (%) - American Indian and Alaska Native
Geographical mobility - Moved from different state (%) - Multirace
Geographical mobility - Moved from different state (%) - Other Race
Geographical mobility - Moved from abroad (%)
Geographical mobility - Moved from abroad (%) - White
Geographical mobility - Moved from abroad (%) - Black or African American
Geographical mobility - Moved from abroad (%) - Asian
Geographical mobility - Moved from abroad (%) - Hispanic or Latino
Geographical mobility - Moved from abroad (%) - American Indian and Alaska Native
Geographical mobility - Moved from abroad (%) - Multirace
Geographical mobility - Moved from abroad (%) - Other Race
Place of birth for the foreign-born population - Ireland (%)
Place of birth for the foreign-born population - Denmark (%)
Place of birth for the foreign-born population - Norway (%)
Place of birth for the foreign-born population - Sweden (%)
Place of birth for the foreign-born population - United Kingdom (%)
Place of birth for the foreign-born population - England (%)
Place of birth for the foreign-born population - Scotland (%)
Place of birth for the foreign-born population - Other Northern Europe (%)
Place of birth for the foreign-born population - Austria (%)
Place of birth for the foreign-born population - Belgium (%)
Place of birth for the foreign-born population - France (%)
Place of birth for the foreign-born population - Germany (%)
Place of birth for the foreign-born population - Netherlands (%)
Place of birth for the foreign-born population - Switzerland (%)
Place of birth for the foreign-born population - Other Western Europe (%)
Place of birth for the foreign-born population - Greece (%)
Place of birth for the foreign-born population - Italy (%)
Place of birth for the foreign-born population - Portugal (%)
Place of birth for the foreign-born population - Spain (%)
Place of birth for the foreign-born population - Other Southern Europe (%)
Place of birth for the foreign-born population - Albania (%)
Place of birth for the foreign-born population - Belarus (%)
Place of birth for the foreign-born population - Bosnia and Herzegovina (%)
Place of birth for the foreign-born population - Bulgaria (%)
Place of birth for the foreign-born population - Croatia (%)
Place of birth for the foreign-born population - Czechoslovakia (%)
Place of birth for the foreign-born population - Hungary (%)
Place of birth for the foreign-born population - Latvia (%)
Place of birth for the foreign-born population - Lithuania (%)
Place of birth for the foreign-born population - North Macedonia (Macedonia) (%)
Place of birth for the foreign-born population - Moldova (%)
Place of birth for the foreign-born population - Poland (%)
Place of birth for the foreign-born population - Romania (%)
Place of birth for the foreign-born population - Russia (%)
Place of birth for the foreign-born population - Serbia (%)
Place of birth for the foreign-born population - Ukraine (%)
Place of birth for the foreign-born population - Other Eastern Europe (%)
Place of birth for the foreign-born population - China (%)
Place of birth for the foreign-born population - Hong Kong (%)
Place of birth for the foreign-born population - Taiwan (%)
Place of birth for the foreign-born population - Japan (%)
Place of birth for the foreign-born population - Korea (%)
Place of birth for the foreign-born population - Other Eastern Asia (%)
Place of birth for the foreign-born population - Afghanistan (%)
Place of birth for the foreign-born population - Bangladesh (%)
Place of birth for the foreign-born population - India (%)
Place of birth for the foreign-born population - Iran (%)
Place of birth for the foreign-born population - Kazakhstan (%)
Place of birth for the foreign-born population - Nepal (%)
Place of birth for the foreign-born population - Pakistan (%)
Place of birth for the foreign-born population - Sri Lanka (%)
Place of birth for the foreign-born population - Uzbekistan (%)
Place of birth for the foreign-born population - Other South Central Asia (%)
Place of birth for the foreign-born population - Burma (%)
Place of birth for the foreign-born population - Cambodia (%)
Place of birth for the foreign-born population - Indonesia (%)
Place of birth for the foreign-born population - Laos (%)
Place of birth for the foreign-born population - Malaysia (%)
Place of birth for the foreign-born population - Philippines (%)
Place of birth for the foreign-born population - Singapore (%)
Place of birth for the foreign-born population - Thailand (%)
Place of birth for the foreign-born population - Vietnam (%)
Place of birth for the foreign-born population - Other South Eastern Asia (%)
Place of birth for the foreign-born population - Armenia (%)
Place of birth for the foreign-born population - Iraq (%)
Place of birth for the foreign-born population - Israel (%)
Place of birth for the foreign-born population - Jordan (%)
Place of birth for the foreign-born population - Kuwait (%)
Place of birth for the foreign-born population - Lebanon (%)
Place of birth for the foreign-born population - Saudi Arabia (%)
Place of birth for the foreign-born population - Syria (%)
Place of birth for the foreign-born population - Turkey (%)
Place of birth for the foreign-born population - Yemen (%)
Place of birth for the foreign-born population - Other Western Asia (%)
Place of birth for the foreign-born population - Eritrea (%)
Place of birth for the foreign-born population - Ethiopia (%)
Place of birth for the foreign-born population - Kenya (%)
Place of birth for the foreign-born population - Somalia (%)
Place of birth for the foreign-born population - Uganda (%)
Place of birth for the foreign-born population - Zimbabwe (%)
Place of birth for the foreign-born population - Other Eastern Africa (%)
Place of birth for the foreign-born population - Cameroon (%)
Place of birth for the foreign-born population - Congo (%)
Place of birth for the foreign-born population - Democratic Republic of Congo (Zaire) (%)
Place of birth for the foreign-born population - Other Middle Africa (%)
Place of birth for the foreign-born population - Egypt (%)
Place of birth for the foreign-born population - Morocco (%)
Place of birth for the foreign-born population - Sudan (%)
Place of birth for the foreign-born population - Other Northern Africa (%)
Place of birth for the foreign-born population - South Africa (%)
Place of birth for the foreign-born population - Other Southern Africa (%)
Place of birth for the foreign-born population - Cabo Verde (%)
Place of birth for the foreign-born population - Ghana (%)
Place of birth for the foreign-born population - Liberia (%)
Place of birth for the foreign-born population - Nigeria (%)
Place of birth for the foreign-born population - Senegal (%)
Place of birth for the foreign-born population - Sierra Leone (%)
Place of birth for the foreign-born population - Other Western Africa (%)
Place of birth for the foreign-born population - Australia (%)
Place of birth for the foreign-born population - New Zealand (%)
Place of birth for the foreign-born population - Fiji (%)
Place of birth for the foreign-born population - Micronesia (%)
Place of birth for the foreign-born population - Bahamas (%)
Place of birth for the foreign-born population - Barbados (%)
Place of birth for the foreign-born population - Cuba (%)
Place of birth for the foreign-born population - Dominica (%)
Place of birth for the foreign-born population - Dominican Republic (%)
Place of birth for the foreign-born population - Grenada (%)
Place of birth for the foreign-born population - Haiti (%)
Place of birth for the foreign-born population - Jamaica (%)
Place of birth for the foreign-born population - St. Vincent and the Grenadines (%)
Place of birth for the foreign-born population - Trinidad and Tobago (%)
Place of birth for the foreign-born population - West Indies (%)
Place of birth for the foreign-born population - Other Caribbean (%)
Place of birth for the foreign-born population - Belize (%)
Place of birth for the foreign-born population - Costa Rica (%)
Place of birth for the foreign-born population - El Salvador (%)
Place of birth for the foreign-born population - Guatemala (%)
Place of birth for the foreign-born population - Honduras (%)
Place of birth for the foreign-born population - Mexico (%)
Place of birth for the foreign-born population - Nicaragua (%)
Place of birth for the foreign-born population - Panama (%)
Place of birth for the foreign-born population - Other Central America (%)
Place of birth for the foreign-born population - Argentina (%)
Place of birth for the foreign-born population - Bolivia (%)
Place of birth for the foreign-born population - Brazil (%)
Place of birth for the foreign-born population - Chile (%)
Place of birth for the foreign-born population - Colombia (%)
Place of birth for the foreign-born population - Ecuador (%)
Place of birth for the foreign-born population - Guyana (%)
Place of birth for the foreign-born population - Peru (%)
Place of birth for the foreign-born population - Uruguay (%)
Place of birth for the foreign-born population - Venezuela (%)
Place of birth for the foreign-born population - Other South America (%)
Place of birth for the foreign-born population - Canada (%)
Place of birth for the foreign-born population - Other Northern America (%)
Place of birth for the foreign-born population - Other (%)
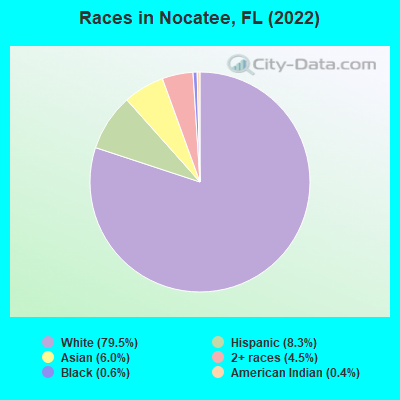
According to 2022 data, the most numerous races in Nocatee, FL are White alone (18,756 residents), Hispanic (1,967 residents), and Black alone (139 residents). 87.0% of Nocatee residents speak English at home.
Race distribution in Nocatee 18,756 79.5% White alone 1,967 8.3% Hispanic 1,420 6.0% Asian alone 1,060 4.5% Two or more races 139 0.6% Black alone 92 0.4% American Indian alone
2000 2022
10,458,509 65.4% White alone 2,682,715 16.8% Hispanic 2,264,268 14.2% Black alone 261,693 1.6% Asian alone 236,954 1.5% Two or more races 42,358 0.3% American Indian alone 28,994 0.2% Other race alone 6,887 0.04% Native Hawaiian and Other
11,309,403 50.8% White alone 6,025,039 27.1% Hispanic 3,241,015 14.6% Black alone 861,630 3.9% Two or more races 623,692 2.8% Asian alone 152,054 0.7% Other race alone 22,504 0.1% American Indian alone 9,486 0.04% Native Hawaiian and Other
Income and house value in Nocatee Median household income in 2022 $128,817 White non-Hispanic householdersover $200,000 Two or more races householdersover $200,000 Hispanic or Latino race householders
Median age by race in Nocatee
43.6 Median age for White residents41.6 45.4 38.1 Median age for Black or African American residents14.5 46.8 -598,566,307.6 Median age for American Indian / Alaska Native residents-611,418,047.3 -594,925,633.7 40.5 Median age for Asian residents39.9 40.9 -679,849,340.2 Median age for Native Hawaiian / Pacific Islander residents-858,307,848.3 -443,298,968.6 43.5 Median age for Other race residents-682,080,924.2 54.6 14.6 Median age for Two or more races residents15.4 14.0 42.7 Median age for White alone residents40.3 44.5 35.2 Median age for Hispanic or Latino residents46.1 31.6
Owner/renter occupied households by race in Nocatee
House owners and renters - White residents 5,768 87.8% Owner occupied800 12.2% Renter occupiedHouse owners and renters - Black or African American residents 51 100.0% Renter occupiedHouse owners and renters - Asian residents 504 94.6% Owner occupied29 5.4% Renter occupiedHouse owners and renters - Other race residents 35 100.0% Owner occupiedHouse owners and renters - Two or more races residents 288 67.2% Owner occupied141 32.8% Renter occupiedHouse owners and renters - White alone residents 6,046 86.8% Owner occupied919 13.2% Renter occupiedHouse owners and renters - Hispanic or Latino residents 294 65.3% Owner occupied156 34.7% Renter occupied
Language usage in Nocatee
English speakers - Total 87.0% of residents of Nocatee speak English at home.
5.1% of residents speak Spanish at home 729 67.0% Speak English very well359 33.0% Speak English less than very well7.8% of residents speak other language at home 1,415 85.9% Speak English very well233 14.1% Speak English less than very well
English speakers - Born in the United States 95.8% of residents of Nocatee speak English at home.
2.3% of residents speak Spanish at home 185 59.1% Speak English very well128 40.9% Speak English less than very well2.0% of residents speak other language at home 279 100.0% Speak English very well
English speakers - Native, born elsewhere 40.7% of residents of Nocatee speak English at home.
53.8% of residents speak Spanish at home 292 81.8% Speak English very well65 18.2% Speak English less than very well5.7% of residents speak other language at home 38 100.0% Speak English very well
English speakers - Foreign-born 31.7% of residents of Nocatee speak English at home.
10.7% of residents speak Spanish at home 86 35.0% Speak English very well160 65.0% Speak English less than very well57.9% of residents speak other language at home 1,101 82.5% Speak English very well233 17.5% Speak English less than very well
White (Caucasian) - Speak only English Native:
100.0% (15,558)Foreign-born:
70.8% (419)
White (Caucasian) - Speak another language Native:
2.0% (311)Foreign-born:
47.4% (280)
Black or African American - Speak only English Native:
43.0% (93)Foreign-born:
97.0% (118)
Asian - Speak only English Native:
86.2% (444)Foreign-born:
13.5% (117)
Asian - Speak another language Native:
14.8% (76)Foreign-born:
86.7% (756)
Other race - Speak another language Native:
66.6% (201)Foreign-born:
100.0% (23)
Two or more races - Speak another language Native:
25.9% (423)Foreign-born:
100.0% (350)
White alone - Speak only English Native:
99.0% (15,709)Foreign-born:
45.9% (423)
White alone - Speak another language Native:
1.1% (179)Foreign-born:
54.3% (501)
Hispanic or Latino - Speak only English Native:
46.7% (679)Foreign-born:
19.5% (60)
Hispanic or Latino - Speak another language Native:
54.3% (789)Foreign-born:
80.7% (247)
Foreign-born residents in Nocatee
Marital status for residents in Nocatee Marital status - White (Caucasian) population 15 years and over
Males 15.0% Never married72.6% Now married2.7% Separated0.6% Widowed9.1% DivorcedFemales 10.1% Never married70.1% Now married0.0% Separated8.7% Widowed11.1% DivorcedWomen who gave birth in the past 12 months Now married:
67.0% (366)Unmarried:
33.0% (181)
Women who did not give birth in the past 12 months Now married:
70.8% (1,670)Unmarried:
29.2% (688)
Marital status - Black or African American population 15 years and over
Males 0.0% Never married100.0% Now married0.0% Separated0.0% Widowed0.0% DivorcedFemales 42.7% Never married57.3% Now married0.0% Separated0.0% Widowed0.0% DivorcedWomen who did not give birth in the past 12 months Now married:
40.2% (49)Unmarried:
59.8% (72)
Marital status - Asian population 15 years and over
Males 15.0% Never married85.0% Now married0.0% Separated0.0% Widowed0.0% DivorcedFemales 6.4% Never married88.1% Now married0.0% Separated5.5% Widowed0.0% DivorcedWomen who gave birth in the past 12 months Now married:
100.0% (21)Unmarried:
0.0% (0)
Women who did not give birth in the past 12 months Now married:
92.7% (515)Unmarried:
7.3% (40)
Marital status - Other race population 15 years and over
Males 0.0% Never married100.0% Now married0.0% Separated0.0% Widowed0.0% DivorcedFemales 0.0% Never married100.0% Now married0.0% Separated0.0% Widowed0.0% DivorcedWomen who did not give birth in the past 12 months Now married:
100.0% (102)Unmarried:
0.0% (0)
Marital status - Two or more races population 15 years and over
Males 0.0% Never married92.4% Now married0.0% Separated0.0% Widowed7.6% DivorcedFemales 6.1% Never married82.7% Now married0.0% Separated0.0% Widowed11.2% DivorcedWomen who did not give birth in the past 12 months Now married:
78.1% (415)Unmarried:
21.9% (116)
Marital status - White alone, not Hispanic / Latino population 15 years and over
Males 13.6% Never married73.5% Now married2.8% Separated0.6% Widowed9.4% DivorcedFemales 10.2% Never married70.1% Now married0.0% Separated8.8% Widowed10.8% DivorcedWomen who gave birth in the past 12 months Now married:
67.0% (421)Unmarried:
33.0% (208)
Women who did not give birth in the past 12 months Now married:
70.9% (1,900)Unmarried:
29.1% (779)
Marital status - Hispanic or Latino population 15 years and over
Males 23.7% Never married72.8% Now married0.0% Separated0.0% Widowed3.5% DivorcedFemales 14.5% Never married77.8% Now married0.0% Separated0.0% Widowed7.7% DivorcedWomen who did not give birth in the past 12 months Now married:
68.1% (273)Unmarried:
31.9% (127)
Ancestries in Nocatee
2,007 17.0% German1,286 10.9% American1,181 10.0% English1,108 9.4% Irish700 5.9% French502 4.2% Italian291 2.5% Norwegian249 2.1% Eastern European245 2.1% Scottish241 2.0% British226 1.9% European188 1.6% Portuguese180 1.5% Swedish146 1.2% Polish97 0.8% Russian79 0.7% Ethiopian58 0.5% Lebanese55 0.5% Welsh44 0.4% Australian44 0.4% Danish33 0.3% Scotch-Irish29 0.2% Hungarian29 0.2% Ukrainian26 0.2% Yugoslavian18 0.2% Brazilian14 0.1% Dutch
Geographical mobility in Nocatee Same house 1 year ago 13,490 79.6% White (Caucasian)238 71.1% Black or African American85 51.6% American Indian / Alaska Native916 64.2% Asian329 100.0% Other race1,884 78.2% Two or more races14,502 79.5% White alone, not Hispanic / Latino1,728 90.3% Hispanic or LatinoMoved within same county 638 3.8% White / Caucasian171 12.0% Asian110 4.6% Two or more races733 4.0% White alone, not Hispanic / LatinoMoved within same state 1,078 6.4% White / Caucasian89 6.3% Asian75 3.1% Two or more races1,161 6.4% White alone, not Hispanic / LatinoMoved from different state 1,913 11.3% White / Caucasian97 29.1% Black or African American65 39.1% American Indian / Alaska Native188 13.2% Asian331 13.7% Two or more races1,866 10.2% White alone, not Hispanic / Latino241 12.6% Hispanic or LatinoMoved from abroad 95 0.6% White38 2.7% Asian127 0.7% White alone, not Hispanic / Latino
Children Nativity (place of birth) in Nocatee
Children under 6 years - Living with two parents Both parents native 1,762 100.0% NativeBoth parents foreign-born 97 100.0% NativeOne native, one foreign-born parent 448 100.0% NativeChildren under 6 years - Living with one parent Native parent 390 100.0% NativeChildren 6 to 17 years - Living with two parents Both parents native 2,615 95.6% Native120 4.4% Foreign-bornBoth parents foreign-born 237 61.6% Native147 38.4% Foreign-bornOne native, one foreign-born parent 408 100.0% NativeChildren 6 to 17 years - Living with one parent Native parent 265 100.0% NativeForeign-born parent 134 50.6% Native131 49.4% Foreign-born
Grandparents responsible for own grandchildren in Nocatee
Grandparents (30 to 59 years) Asian 13 100.0% Not responsible for grandchildren
Grandparents (60 years and over) Asian 56 100.0% Not responsible for grandchildren