Races in Newton, North Carolina (NC) Detailed Stats
Ancestries, Foreign-born residents, place of birth
Settings
X


Recent posts about races in Newton, North Carolina on our local forum with over 2,400,000 registered users:
 | Feds give Final OK for 540 Route Completion (205 replies) |
| Greensboro downtown Development. (3795 replies) |
| Asian, IT professional, whats a good area to buy a house? (18 replies) |
| McCrory concedes gubernatorial race to Cooper (96 replies) |
| Looking for Insight for Newton, NC (4 replies) |
| Football feelings (33 replies) |
Latest news about races in Newton, NC collected exclusively by city-data.com from local newspapers, TV, and radio stations
According to 2022 data, the most numerous races in Newton, NC are White alone (8,396 residents), Black alone (1,294 residents), and Hispanic (1,673 residents). 81.9% of Newton residents speak English at home. 9.3% of Newton, NC residents are foreign-born (5.8% born in Latin America, 2.6% born in Asia), which is 14.1% greater than the foreign-born rate of 8.0% across the entire state of North Carolina.
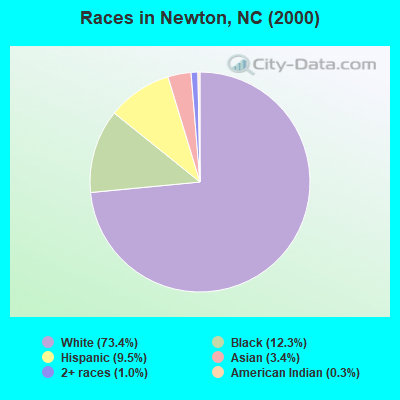
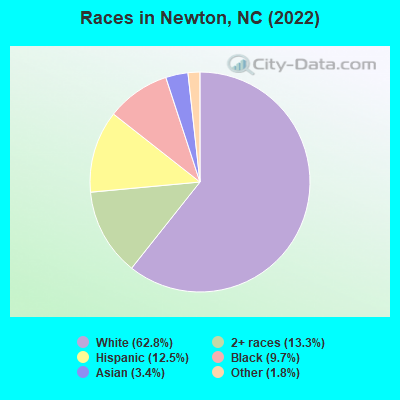
Race distribution in Newton
2000
2022

- 9,22073.4%White alone
- 1,54012.3%Black alone
- 1,1969.5%Hispanic
- 4213.4%Asian alone
- 1281.0%Two or more races
- 400.3%American Indian alone
- 120.10%Other race alone
- 30.02%Native Hawaiian and Other
Pacific Islander alone
-
- 8,39662.8%White alone
- 1,77913.3%Two or more races
- 1,67312.5%Hispanic
- 1,2949.7%Black alone
- 4483.4%Asian alone
- 2361.8%Other race alone
- 80.06%American Indian alone
2000
2022
-
- 5,647,15570.2%White alone
- 1,723,30121.4%Black alone
- 378,9634.7%Hispanic
- 112,4161.4%Asian alone
- 95,3331.2%American Indian alone
- 79,9651.0%Two or more races
- 9,0150.1%Other race alone
- 3,1650.04%Native Hawaiian and Other
Pacific Islander alone

-
- 6,497,51960.7%White alone
- 2,155,65020.1%Black alone
- 1,114,79910.4%Hispanic
- 438,0614.1%Two or more races
- 341,0523.2%Asian alone
- 91,7580.9%American Indian alone
- 50,1800.5%Other race alone
- 9,9540.09%Native Hawaiian and Other
Pacific Islander alone

Income and house value in Newton
- Median household income in 2022
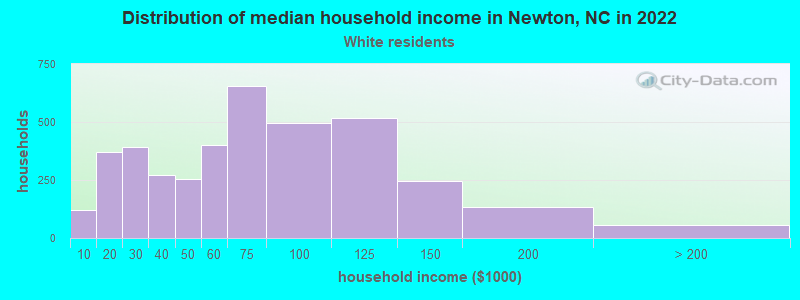
- $63,503White non-Hispanic householders
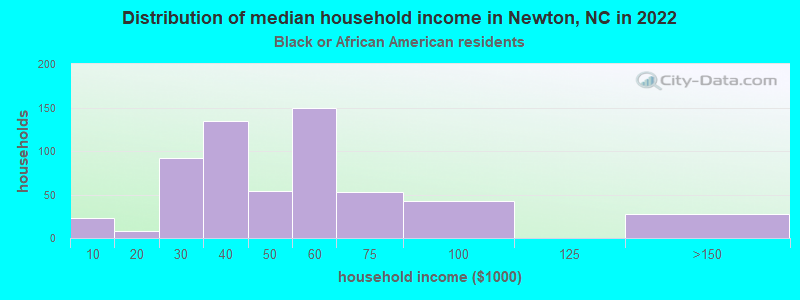
- $39,038Black householders
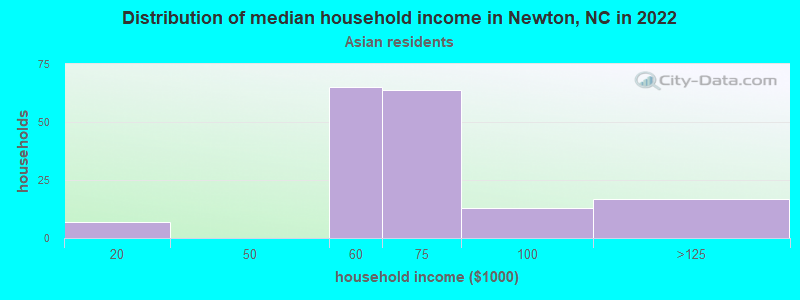
- $44,978Asian householders
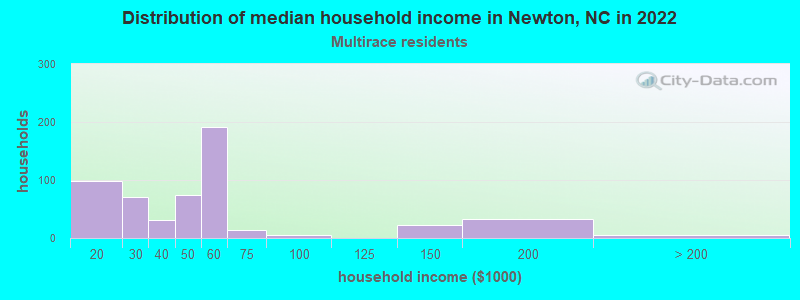
- $25,170Two or more races householders
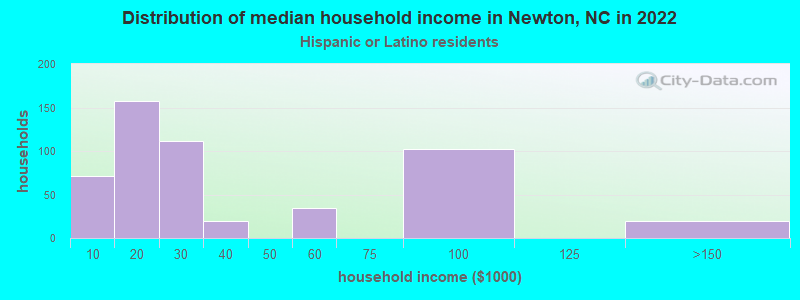
- $28,445Hispanic or Latino race householders
- Median 2022 house value
- $185,035White Non-Hispanic householders
- $157,077Black or African American householders
- $167,108Asian householders
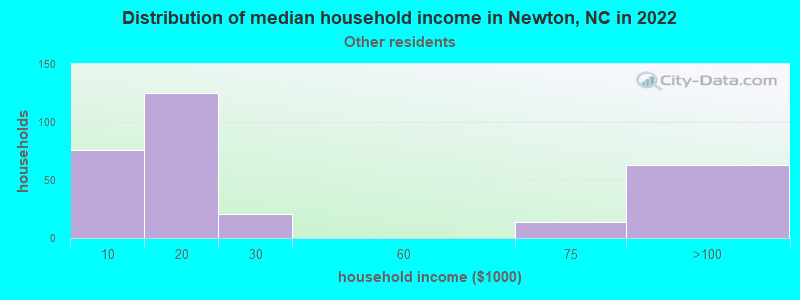
- $123,143Some other race householders
- $69,361Two or more races householders
- $124,850Hispanic or Latino householders
Household income for White non-Hispanic householders
Household income for Black householders
Household income for Asian householders
Household income for Some other race householders
Household income for Two or more races householders
Household income for Hispanic or Latino race householders
Median age by race in Newton
- 46.8Median age for White residents
- 41.2Males
- 49.9Females
- 42.2Median age for Black or African American residents
- 38.8Males
- 54.2Females
- 19.7Median age for American Indian / Alaska Native residents
- -434,523,809.1Males
- 62.5Females
- 32.4Median age for Asian residents
- 27.3Males
- 35.4Females
- -666,666,666.0Median age for Native Hawaiian / Pacific Islander residents
- -666,666,666.0Males
- -666,666,666.0Females
- 64.8Median age for Other race residents
- 61.6Males
- 65.6Females
- 22.2Median age for Two or more races residents
- 22.2Males
- 31.5Females
- 49.2Median age for White alone residents
- 45.8Males
- 53.3Females
- 26.9Median age for Hispanic or Latino residents
- 24.6Males
- 31.2Females
Owner/renter occupied households by race in Newton
- House owners and renters - White residents
- 3,21280.5%Owner occupied
- 78019.5%Renter occupied
- House owners and renters - Black or African American residents
- 16429.1%Owner occupied
- 40070.9%Renter occupied
- House owners and renters - Asian residents
- 2714.7%Owner occupied
- 15485.3%Renter occupied
- House owners and renters - Other race residents
- 1512.1%Owner occupied
- 10987.9%Renter occupied
- House owners and renters - Two or more races residents
- 27939.7%Owner occupied
- 42560.3%Renter occupied
- House owners and renters - White alone residents
- 3,14782.1%Owner occupied
- 68517.9%Renter occupied
- House owners and renters - Hispanic or Latino residents
- 18538.1%Owner occupied
- 30161.9%Renter occupied
Language usage in Newton
- English speakers - Total
- 81.9% of residents of Newton speak English at home.
- 10.2% of residents speak Spanish at home
- 78861.2%Speak English very well
- 49938.8%Speak English less than very well
- 7.9% of residents speak other language at home
- 76476.1%Speak English very well
- 24023.9%Speak English less than very well
- English speakers - Born in the United States
- 89.5% of residents of Newton speak English at home.
- 3.2% of residents speak Spanish at home
- 120100.0%Speak English very well
- 5.5% of residents speak other language at home
- 18892.2%Speak English very well
- 167.8%Speak English less than very well
All residents speak only English at home
- English speakers - Foreign-born
- 2.9% of residents of Newton speak English at home.
- 50.8% of residents speak Spanish at home
- 15927.4%Speak English very well
- 42172.6%Speak English less than very well
- 44.0% of residents speak other language at home
- 29358.4%Speak English very well
- 20941.6%Speak English less than very well
White (Caucasian) - Speak only English
| Native: | 96.0% (8,024) |
| Foreign-born: | 3.4% (7) |
White (Caucasian) - Speak another language
| Native: | 3.5% (296) |
| Foreign-born: | 100.0% (211) |
Black or African American - Speak another language
| Native: | 4.9% (65) |
| Foreign-born: | 99.2% (38) |
Asian - Speak only English
| Native: | 19.0% (60) |
| Foreign-born: | 21.7% (30) |
Asian - Speak another language
| Native: | 81.0% (254) |
| Foreign-born: | 81.5% (112) |
Other race - Speak another language
| Native: | 31.5% (51) |
| Foreign-born: | 100.0% (242) |
Two or more races - Speak another language
| Native: | 46.3% (812) |
| Foreign-born: | 94.3% (690) |
White alone - Speak only English
| Native: | 97.3% (7,818) |
| Foreign-born: | 22.4% (7) |
White alone - Speak another language
| Native: | 2.3% (183) |
| Foreign-born: | 97.5% (31) |
Hispanic or Latino - Speak another language
| Native: | 51.6% (388) |
| Foreign-born: | 98.1% (671) |
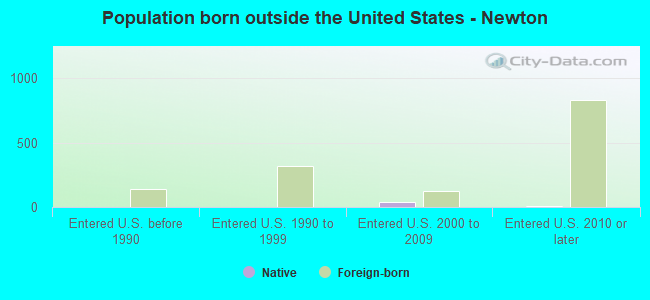
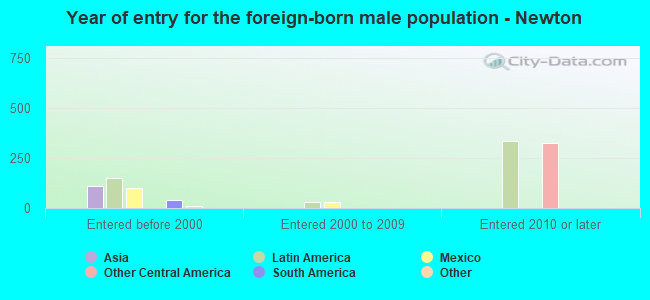
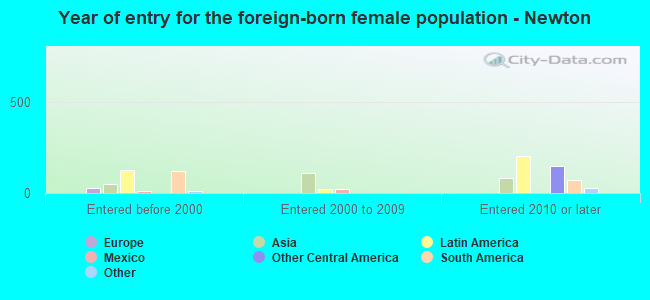
Foreign-born residents in Newton
1,245 residents are foreign born (5.8% Latin America, 2.6% Asia).
| This city: | 9.3% |
| North Carolina: | 8.3% |
Marital status for residents in Newton
Marital status - White (Caucasian) population 15 years and over
- Males
- 32.5%Never married
- 53.5%Now married
- 0.3%Separated
- 6.1%Widowed
- 7.6%Divorced
- Females
- 26.8%Never married
- 36.9%Now married
- 1.8%Separated
- 18.5%Widowed
- 16.0%Divorced
Women who gave birth in the past 12 months
| Now married: | 20.5% (37) |
| Unmarried: | 79.5% (143) |
Women who did not give birth in the past 12 months
| Now married: | 38.1% (595) |
| Unmarried: | 61.9% (967) |
Marital status - Black or African American population 15 years and over
- Males
- 34.2%Never married
- 35.5%Now married
- 0.0%Separated
- 4.6%Widowed
- 25.8%Divorced
- Females
- 47.1%Never married
- 26.7%Now married
- 0.0%Separated
- 5.7%Widowed
- 20.6%Divorced
Women who gave birth in the past 12 months
| Now married: | 93.3% (28) |
| Unmarried: | 6.7% (2) |
Women who did not give birth in the past 12 months
| Now married: | 15.6% (43) |
| Unmarried: | 84.4% (232) |
Marital status - American Indian / Alaska Native population 15 years and over
- Males
- 75.0%Never married
- 0.0%Now married
- 25.0%Separated
- 0.0%Widowed
- 0.0%Divorced
- Females
- 25.0%Never married
- 25.0%Now married
- 0.0%Separated
- 0.0%Widowed
- 50.0%Divorced
Marital status - Asian population 15 years and over
- Males
- 36.0%Never married
- 43.5%Now married
- 0.0%Separated
- 0.0%Widowed
- 20.4%Divorced
- Females
- 25.2%Never married
- 65.9%Now married
- 3.5%Separated
- 0.0%Widowed
- 5.4%Divorced
Women who gave birth in the past 12 months
| Now married: | 36.2% (18) |
| Unmarried: | 63.8% (31) |
Women who did not give birth in the past 12 months
| Now married: | 70.8% (89) |
| Unmarried: | 29.2% (37) |
Marital status - Other race population 15 years and over
- Males
- 69.0%Never married
- 24.5%Now married
- 0.0%Separated
- 2.9%Widowed
- 3.6%Divorced
- Females
- 22.3%Never married
- 35.8%Now married
- 0.0%Separated
- 0.0%Widowed
- 42.0%Divorced
Women who did not give birth in the past 12 months
| Now married: | 10.8% (21) |
| Unmarried: | 89.2% (170) |
Marital status - Two or more races population 15 years and over
- Males
- 55.3%Never married
- 35.0%Now married
- 1.7%Separated
- 0.0%Widowed
- 8.1%Divorced
- Females
- 56.8%Never married
- 37.2%Now married
- 0.9%Separated
- 0.0%Widowed
- 5.1%Divorced
Women who did not give birth in the past 12 months
| Now married: | 31.3% (125) |
| Unmarried: | 68.7% (274) |
Marital status - White alone, not Hispanic / Latino population 15 years and over
- Males
- 30.1%Never married
- 55.2%Now married
- 0.3%Separated
- 6.4%Widowed
- 8.0%Divorced
- Females
- 25.5%Never married
- 38.2%Now married
- 1.9%Separated
- 19.4%Widowed
- 15.0%Divorced
Women who gave birth in the past 12 months
| Now married: | 47.0% (37) |
| Unmarried: | 53.0% (42) |
Women who did not give birth in the past 12 months
| Now married: | 39.5% (601) |
| Unmarried: | 60.5% (920) |
Marital status - Hispanic or Latino population 15 years and over
- Males
- 69.7%Never married
- 28.9%Now married
- 0.0%Separated
- 1.4%Widowed
- 0.0%Divorced
- Females
- 41.9%Never married
- 25.0%Now married
- 0.0%Separated
- 0.0%Widowed
- 33.1%Divorced
Women who gave birth in the past 12 months
| Now married: | 0.0% (0) |
| Unmarried: | 100.0% (111) |
Women who did not give birth in the past 12 months
| Now married: | 21.0% (64) |
| Unmarried: | 79.0% (238) |
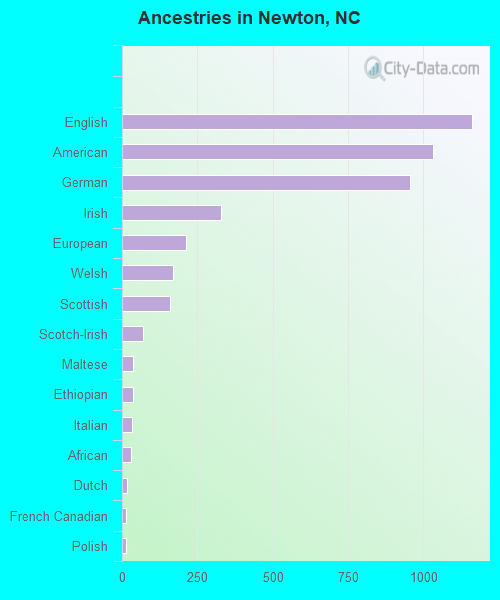
Ancestries in Newton

- 1,16114.1%English
- 1,03212.5%American
- 95511.6%German
- 3284.0%Irish
- 2122.6%European
- 1702.1%Welsh
- 1591.9%Scottish
- 690.8%Scotch-Irish
- 380.5%Maltese
- 350.4%Ethiopian
- 340.4%Italian
- 310.4%African
- 180.2%Dutch
- 120.1%French Canadian
- 120.1%Polish
- 60.07%Northern European
- 60.07%Ukrainian
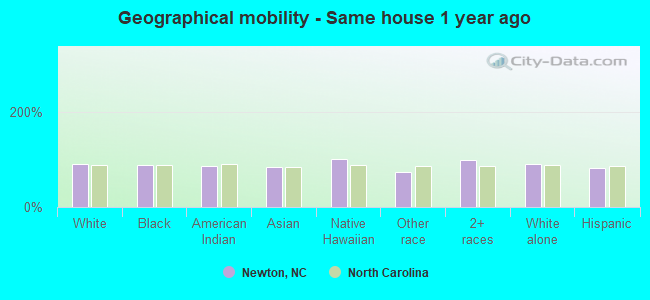
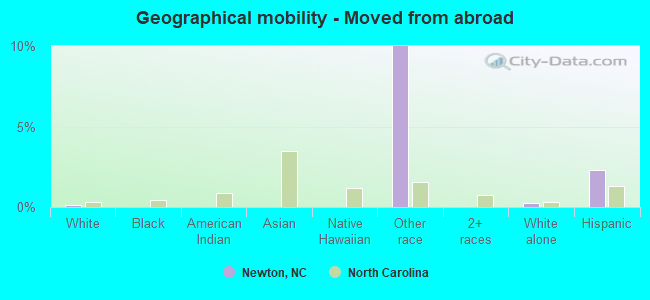
Geographical mobility in Newton

- Same house 1 year ago
- 8,06790.3%White (Caucasian)
- 1,13988.3%Black or African American
- 1185.8%American Indian / Alaska Native
- 50383.3%Asian
- 39100.0%Native Hawaiian / Pacific Islander
- 50174.0%Other race
- 2,33198.0%Two or more races
- 7,49790.2%White alone, not Hispanic / Latino
- 1,28582.3%Hispanic or Latino
-
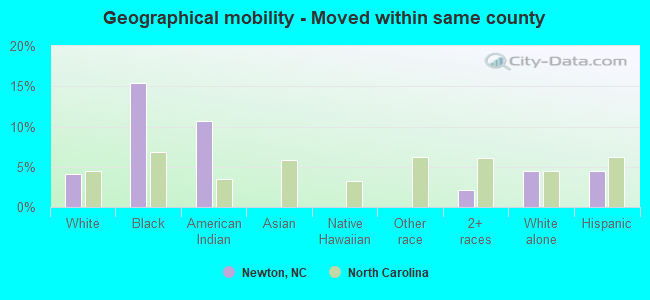
- Moved within same county
- 3704.1%White / Caucasian
- 19915.4%Black or African American
- 110.7%American Indian / Alaska Native
- 502.1%Two or more races
- 3754.5%White alone, not Hispanic / Latino
- 694.4%Hispanic or Latino
-
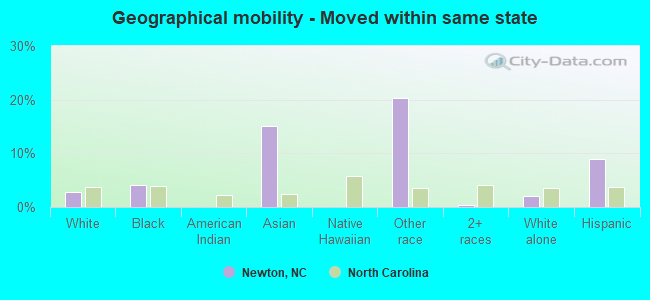
- Moved within same state
- 2512.8%White / Caucasian
- 544.2%Black or African American
- 9115.0%Asian
- 13720.2%Other race
- 70.3%Two or more races
- 1722.1%White alone, not Hispanic / Latino
- 1419.0%Hispanic or Latino
-
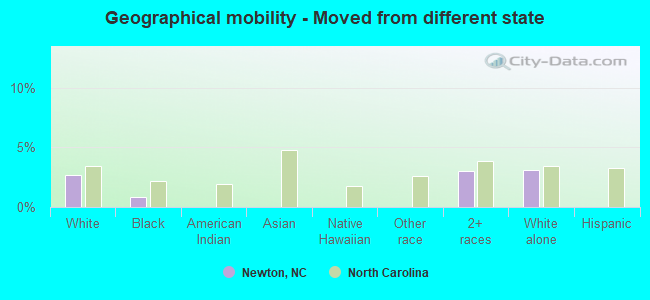
- Moved from different state
- 2382.7%White / Caucasian
- 110.8%Black or African American
- 713.0%Two or more races
- 2573.1%White alone, not Hispanic / Latino
-
- Moved from abroad
- 110.1%White
- 6810.0%Other race
- 200.2%White alone, not Hispanic / Latino
- 362.3%Hispanic or Latino
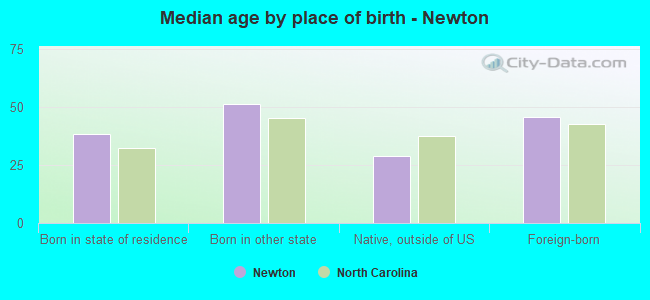
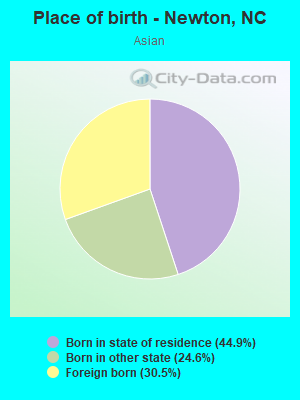
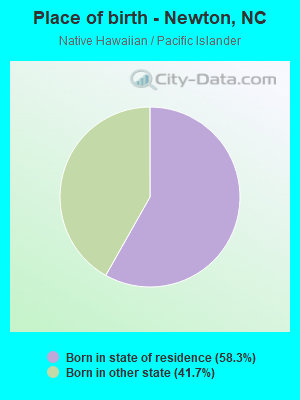
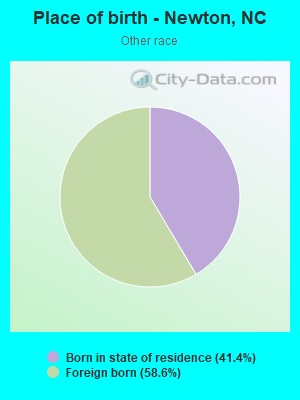
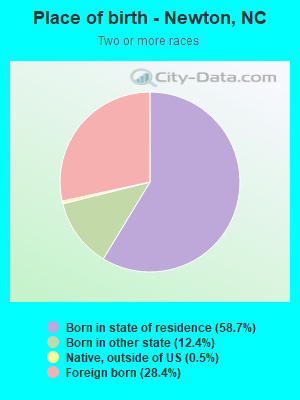
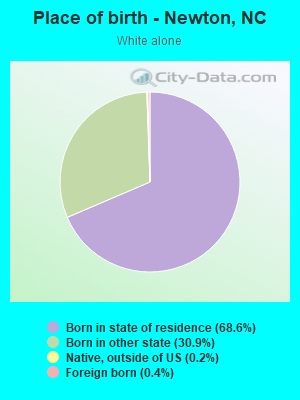
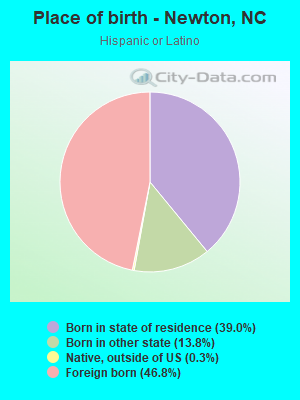
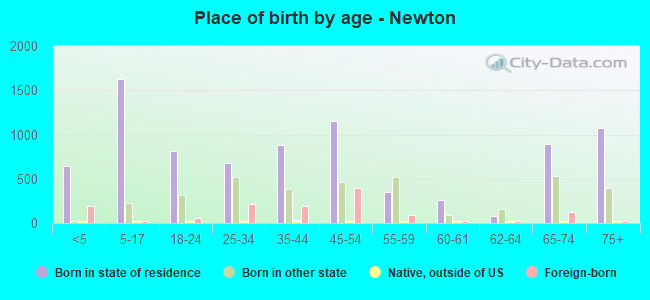
Children Nativity (place of birth) in Newton
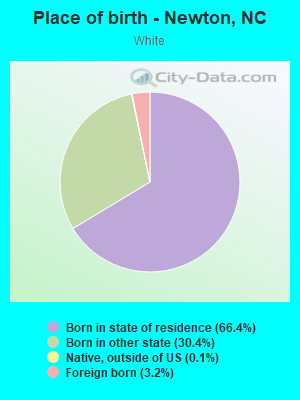
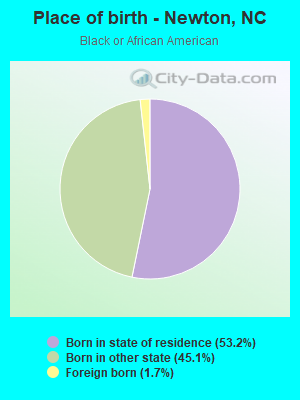
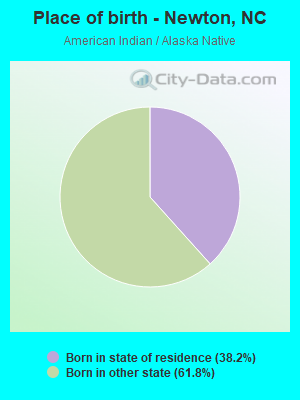
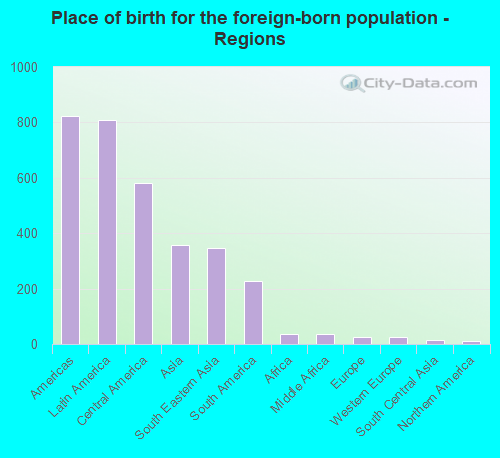
Place of birth for residents in Newton
![Place of birth for the foreign-born population - Regions]()
- 822Americas
- 810Latin America
- 582Central America
- 359Asia
- 345South Eastern Asia
- 228South America
- 36Africa
- 36Middle Africa
- 26Europe
- 26Western Europe
- 13South Central Asia
- 12Northern America
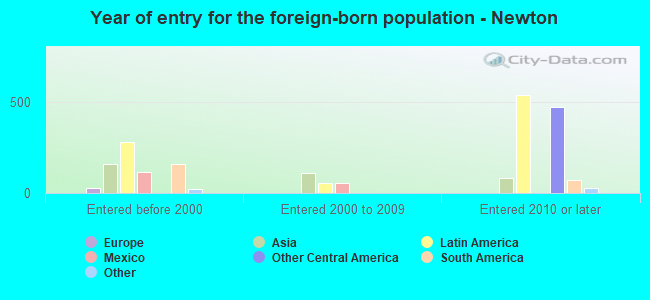
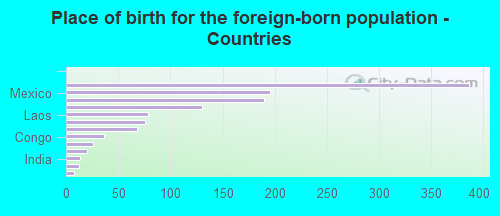
![Place of birth for the foreign-born population - Countries]()
- 386Guatemala
- 195Mexico
- 190Philippines
- 130Venezuela
- 79Laos
- 76Vietnam
- 68Peru
- 36Congo
- 26Germany
- 20Chile
- 13India
- 12Canada
- 8Colombia
Grandparents responsible for own grandchildren in Newton
Zip codes: 28658.