Races in Newington, New Hampshire (NH) Detailed Stats
Ancestries, Foreign-born residents, place of birth

Recent posts about races in Newington, New Hampshire on our local forum with over 2,400,000 registered users:
 | Amazon Logistics warehouse in Hudson NH? (5 replies) |
| Seacoast- In Depth (26 replies) |
| Relocating to NH Seacoast (26 replies) |
| Good middle school for my quirky daughter? (6 replies) |
| Real estate and schools near the seacoast--input please! (13 replies) |
| Boston commuter looking into southern NH (42 replies) |
3.7% of Newington, NH residents are foreign-born (1.9% born in North America, 1.2% born in Europe, 0.6% born in Asia), which is 33.6% less than the foreign-born rate of 5.0% across the entire state of New Hampshire.
Race distribution in Newington

- 73895.2%White alone
- 141.8%Hispanic
- 81.0%Asian alone
- 81.0%Black alone
- 50.6%Two or more races
- 20.3%American Indian alone
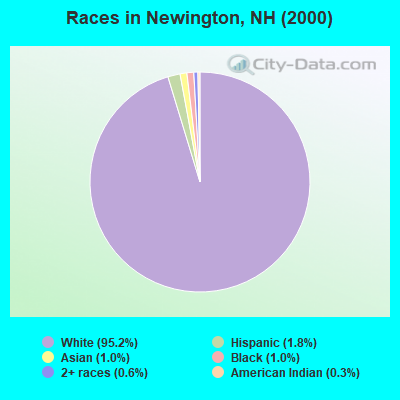
2000
2022
-
- 1,175,25295.1%White alone
- 20,4891.7%Hispanic
- 15,8031.3%Asian alone
- 11,6060.9%Two or more races
- 8,3540.7%Black alone
- 2,6980.2%American Indian alone
- 1,2540.1%Other race alone
- 3300.03%Native Hawaiian and Other
Pacific Islander alone

-
- 1,208,10186.6%White alone
- 63,4794.5%Hispanic
- 60,7244.4%Two or more races
- 36,5192.6%Asian alone
- 17,9311.3%Black alone
- 6,6150.5%Other race alone
- 1,0140.07%American Indian alone
- 8480.06%Native Hawaiian and Other
Pacific Islander alone

Income and house value in Newington
- Median household income in 2022
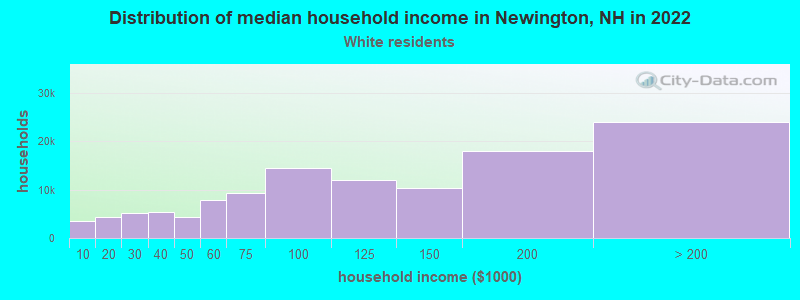
- $109,679White non-Hispanic householders
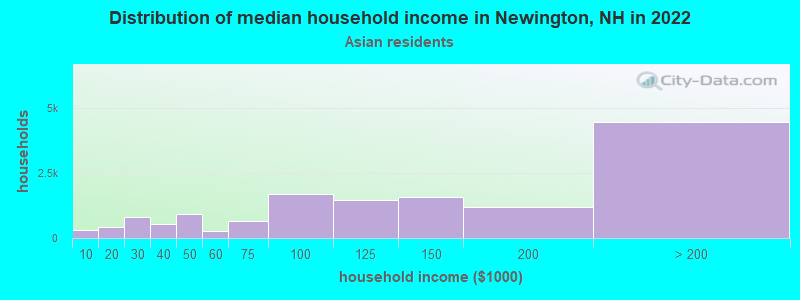
- $114,830Asian householders
- $196,201Some other race householders
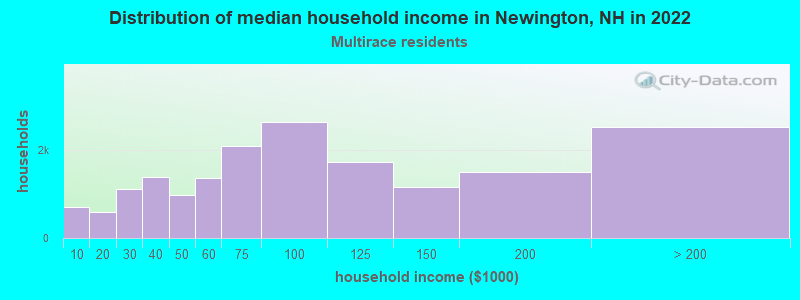
- $127,921Two or more races householders
- Median 2022 house value
- $784,675White Non-Hispanic householders
- over $1,000,000Asian householders
- $572,923Some other race householders
Household income for White non-Hispanic householders
Household income for Asian householders
Household income for Two or more races householders
Foreign-born residents in Newington
29 residents are foreign born (1.9% North America, 1.2% Europe, 0.6% Asia).
| This city: | 3.7% |
| New Hampshire: | 4.4% |
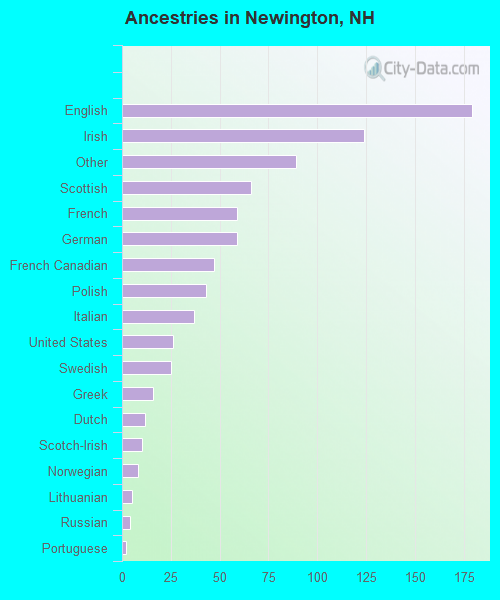
Ancestries in Newington

- 17922.1%English
- 12415.3%Irish
- 8911.0%Other
- 668.1%Scottish
- 597.3%French
- 597.3%German
- 475.8%French Canadian
- 435.3%Polish
- 374.6%Italian
- 263.2%United States
- 253.1%Swedish
- 162.0%Greek
- 121.5%Dutch
- 101.2%Scotch-Irish
- 81.0%Norwegian
- 50.6%Lithuanian
- 40.5%Russian
- 20.2%Portuguese
Zip codes: 03801.