Races in New Millford, Illinois (IL) Detailed Stats
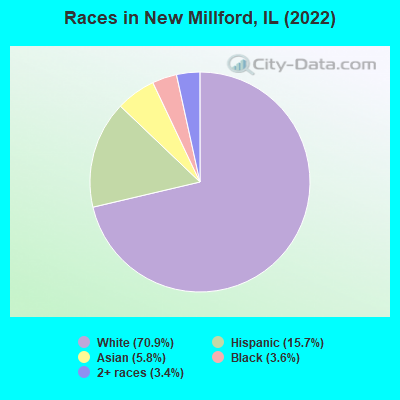
According to 2022 data, the most numerous races in New Millford, IL are White alone (894 residents), Hispanic (198 residents), and Black alone (45 residents). 82.7% of New Millford residents speak English at home. 6.7% of New Millford, IL residents are foreign-born (2.8% born in Latin America, 2.7% born in Asia, 1.0% born in Europe), which is 110.2% less than the foreign-born rate of 14.0% across the entire state of Illinois.
Race distribution in New Millford
2000 2022
8,424,140 67.8% White alone 1,856,152 14.9% Black alone 1,530,262 12.3% Hispanic 419,916 3.4% Asian alone 153,996 1.2% Two or more races 13,479 0.1% Other race alone 18,232 0.1% American Indian alone 3,116 0.03% Native Hawaiian and Other
7,356,301 58.5% White alone 2,299,726 18.3% Hispanic 1,660,423 13.2% Black alone 747,296 5.9% Asian alone 458,599 3.6% Two or more races 45,386 0.4% Other race alone 10,405 0.08% American Indian alone 3,896 0.03% Native Hawaiian and Other
Income and house value in New Millford Median household income in 2022 $65,340 White non-Hispanic householdersMedian 2022 house value $489,754 White Non-Hispanic householders$432,784 Black or African American householders$173,113 Some other race householders$173,113 Hispanic or Latino householders
Median age by race in New Millford
30.9 Median age for White residents30.1 35.6 18.0 Median age for Black or African American residents30.2 18.6 -671,485,943.1 Median age for American Indian / Alaska Native residents-367,313,915.5 -798,727,127.3 38.7 Median age for Asian residents40.0 34.0 -410,158,729.7 Median age for Native Hawaiian / Pacific Islander residents-580,818,242.2 -576,015,108.0 -624,263,839.2 Median age for Other race residents-617,131,062.3 -614,173,227.7 39.6 Median age for Two or more races residents43.6 39.9 30.6 Median age for White alone residents29.8 31.4 21.4 Median age for Hispanic or Latino residents20.8 33.8
Owner/renter occupied households by race in New Millford
House owners and renters - White residents 367 90.8% Owner occupied37 9.2% Renter occupiedHouse owners and renters - Black or African American residents 2 27.7% Owner occupied5 72.3% Renter occupiedHouse owners and renters - Asian residents 13 100.0% Owner occupiedHouse owners and renters - Two or more races residents 35 100.0% Owner occupiedHouse owners and renters - White alone residents 343 89.7% Owner occupied40 10.3% Renter occupiedHouse owners and renters - Hispanic or Latino residents 43 100.0% Owner occupied
Language usage in New Millford
English speakers - Total 82.7% of residents of New Millford speak English at home.
13.3% of residents speak Spanish at home 109 67.3% Speak English very well53 32.7% Speak English less than very well4.1% of residents speak other language at home 13 26.0% Speak English very well37 74.0% Speak English less than very well
English speakers - Born in the United States 84.3% of residents of New Millford speak English at home.
7.6% of residents speak Spanish at home 14 100.0% Speak English very well2.7% of residents speak other language at home 5 100.0% Speak English very well
English speakers - Native, born elsewhere 6.2% of residents of New Millford speak English at home.
56.2% of residents speak Spanish at home 18 100.0% Speak English very well
English speakers - Foreign-born 10.8% of residents of New Millford speak English at home.
44.6% of residents speak Spanish at home 30 90.9% Speak English very well3 9.1% Speak English less than very well44.6% of residents speak other language at home 3 9.1% Speak English very well30 90.9% Speak English less than very well
White (Caucasian) - Speak only English Native:
90.0% (859)Foreign-born:
21.5% (4)
White (Caucasian) - Speak another language Native:
5.4% (51)Foreign-born:
78.6% (14)
Asian - Speak only English Native:
95.8% (36)Foreign-born:
7.0% (2)
Asian - Speak another language Native:
15.5% (6)Foreign-born:
94.0% (30)
Two or more races - Speak another language Native:
25.7% (24)Foreign-born:
99.2% (9)
White alone - Speak only English Native:
99.1% (862)Foreign-born:
65.2% (4)
White alone - Speak another language Native:
1.0% (8)Foreign-born:
19.6% (1)
Hispanic or Latino - Speak another language Native:
86.0% (143)Foreign-born:
99.2% (33)
Foreign-born residents in New Millford 84 residents are foreign born (2.8% Latin America , 2.7% Asia , 1.0% Europe ).
This city:
6.7%Illinois:
14.1%
Marital status for residents in New Millford Marital status - White (Caucasian) population 15 years and over
Males 51.8% Never married38.9% Now married0.0% Separated1.3% Widowed8.0% DivorcedFemales 36.7% Never married39.8% Now married0.7% Separated20.1% Widowed2.7% DivorcedWomen who gave birth in the past 12 months Now married:
0.0% (0)Unmarried:
100.0% (9)
Women who did not give birth in the past 12 months Now married:
29.5% (49)Unmarried:
70.5% (117)
Marital status - Black or African American population 15 years and over
Males 100.0% Never married0.0% Now married0.0% Separated0.0% Widowed0.0% DivorcedFemales 57.9% Never married0.0% Now married0.0% Separated10.5% Widowed31.6% DivorcedWomen who gave birth in the past 12 months Now married:
0.0% (0)Unmarried:
100.0% (5)
Women who did not give birth in the past 12 months Now married:
0.0% (0)Unmarried:
100.0% (9)
Marital status - Asian population 15 years and over
Males 0.0% Never married100.0% Now married0.0% Separated0.0% Widowed0.0% DivorcedFemales 0.0% Never married100.0% Now married0.0% Separated0.0% Widowed0.0% DivorcedWomen who gave birth in the past 12 months Now married:
100.0% (18)Unmarried:
0.0% (0)
Marital status - Two or more races population 15 years and over
Males 41.4% Never married58.6% Now married0.0% Separated0.0% Widowed0.0% DivorcedFemales 26.1% Never married65.2% Now married0.0% Separated0.0% Widowed8.7% DivorcedWomen who did not give birth in the past 12 months Now married:
64.3% (15)Unmarried:
35.7% (8)
Marital status - White alone, not Hispanic / Latino population 15 years and over
Males 52.4% Never married36.5% Now married0.0% Separated1.6% Widowed9.5% DivorcedFemales 39.2% Never married35.2% Now married0.8% Separated22.0% Widowed2.9% DivorcedWomen who gave birth in the past 12 months Now married:
0.0% (0)Unmarried:
100.0% (10)
Women who did not give birth in the past 12 months Now married:
24.6% (40)Unmarried:
75.4% (122)
Marital status - Hispanic or Latino population 15 years and over
Males 47.8% Never married52.2% Now married0.0% Separated0.0% Widowed0.0% DivorcedFemales 17.4% Never married82.6% Now married0.0% Separated0.0% Widowed0.0% DivorcedWomen who did not give birth in the past 12 months Now married:
71.4% (21)Unmarried:
28.6% (9)
Ancestries in New Millford
44 9.4% German39 8.3% English30 6.4% Swedish28 6.0% Norwegian16 3.4% American16 3.4% Italian11 2.3% Scandinavian5 1.1% Irish5 1.1% Pennsylvania German3 0.6% European3 0.6% Polish2 0.4% Bulgarian2 0.4% Lithuanian1 0.2% Greek
Children Nativity (place of birth) in New Millford
Children under 6 years - Living with two parents Both parents native 20 100.0% NativeChildren under 6 years - Living with one parent Native parent 28 100.0% Native
Children 6 to 17 years - Living with two parents Both parents native 44 100.0% NativeOne native, one foreign-born parent 47 100.0% NativeChildren 6 to 17 years - Living with one parent Native parent 27 100.0% Native
Grandparents responsible for own grandchildren in New Millford
Grandparents (30 to 59 years) White / Caucasian 1 100.0% Not responsible for grandchildrenWhite alone, not Hispanic / Latino 1 100.0% Not responsible for grandchildren
Grandparents (60 years and over) White / Caucasian 24 100.0% Not responsible for grandchildrenWhite alone, not Hispanic / Latino 26 100.0% Not responsible for grandchildren