Races in New Cassel, New York (NY) Detailed Stats
Data:
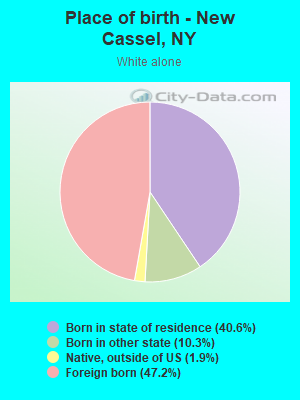
Races - White alone (%)
Races - White alone (% change since 2000)
Races - Black alone (%)
Races - Black alone (% change since 2000)
Races - American Indian alone (%)
Races - American Indian alone (% change since 2000)
Races - Asian alone (%)
Races - Asian alone (% change since 2000)
Races - Hispanic (%)
Races - Hispanic (% change since 2000)
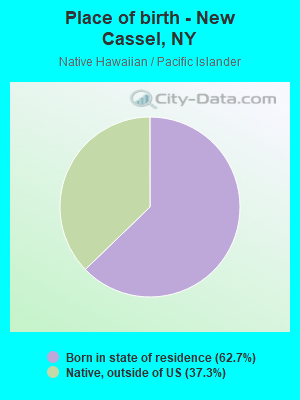
Races - Native Hawaiian and Other Pacific Islander alone (%)
Races - Native Hawaiian and Other Pacific Islander alone (% change since 2000)
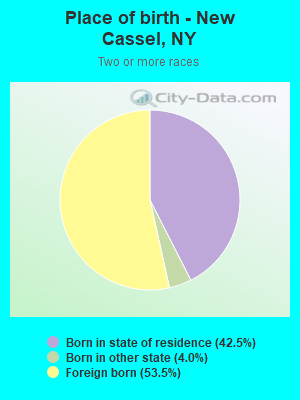
Races - Two or more races(%)
Races - Two or more races(% change since 2000)
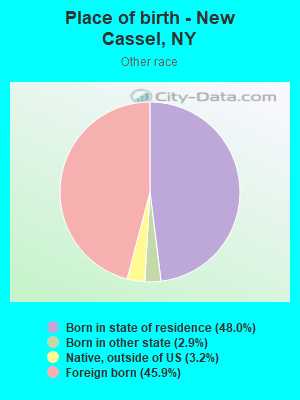
Races - Other race alone (%)
Races - Other race alone (% change since 2000)
Racial diversity
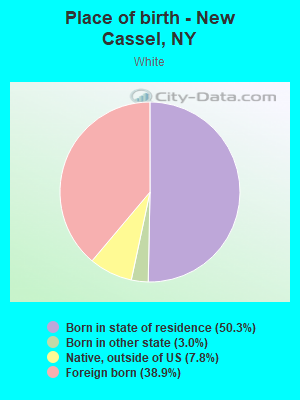
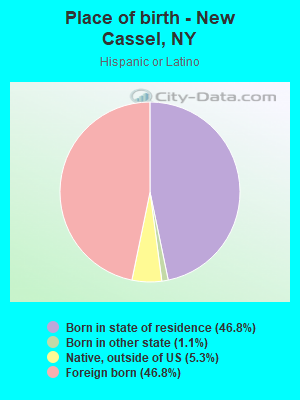
Place of birth - Born in state of residence (%)
Place of birth - Born in state of residence (%) - White
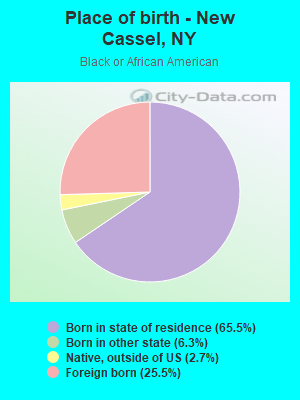
Place of birth - Born in state of residence (%) - Black or African American
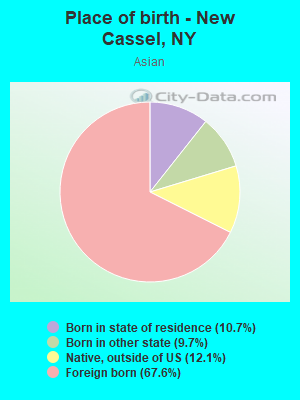
Place of birth - Born in state of residence (%) - Asian
Place of birth - Born in state of residence (%) - Hispanic or Latino
Place of birth - Born in state of residence (%) - American Indian and Alaska Native
Place of birth - Born in state of residence (%) - Multirace
Place of birth - Born in state of residence (%) - Other Race
Place of birth - Born in other state (%)
Place of birth - Born in other state (%) - White
Place of birth - Born in other state (%) - Black or African American
Place of birth - Born in other state (%) - Asian
Place of birth - Born in other state (%) - Hispanic or Latino
Place of birth - Born in other state (%) - American Indian and Alaska Native
Place of birth - Born in other state (%) - Multirace
Place of birth - Born in other state (%) - Other Race
Place of birth - Native, outside of US (%)
Place of birth - Native, outside of US (%) - White
Place of birth - Native, outside of US (%) - Black or African American
Place of birth - Native, outside of US (%) - Asian
Place of birth - Native, outside of US (%) - Hispanic or Latino
Place of birth - Native, outside of US (%) - American Indian and Alaska Native
Place of birth - Native, outside of US (%) - Multirace
Place of birth - Native, outside of US (%) - Other Race
Place of birth - Foreign born (%)
Place of birth - Foreign born (%) - White
Place of birth - Foreign born (%) - Black or African American
Place of birth - Foreign born (%) - Asian
Place of birth - Foreign born (%) - Hispanic or Latino
Place of birth - Foreign born (%) - American Indian and Alaska Native
Place of birth - Foreign born (%) - Multirace
Place of birth - Foreign born (%) - Other Race
Residents speaking English at home (%)
Residents speaking English at home - Born in the United States (%)
Residents speaking English at home - Native, born elsewhere (%)
Residents speaking English at home - Foreign born (%)
Residents speaking Spanish at home (%)
Residents speaking Spanish at home - Born in the United States (%)
Residents speaking Spanish at home - Native, born elsewhere (%)
Residents speaking Spanish at home - Foreign born (%)
Residents speaking other language at home (%)
Residents speaking other language at home - Born in the United States (%)
Residents speaking other language at home - Native, born elsewhere (%)
Residents speaking other language at home - Foreign born (%)
Marital status - Never married (%)
Marital status - Now married (%)
Marital status - Separated (%)
Marital status - Widowed (%)
Marital status - Divorced (%)
Ancestries Reported - Arab (%)
Ancestries Reported - Czech (%)
Ancestries Reported - Danish (%)
Ancestries Reported - Dutch (%)
Ancestries Reported - English (%)
Ancestries Reported - French (%)
Ancestries Reported - French Canadian (%)
Ancestries Reported - German (%)
Ancestries Reported - Greek (%)
Ancestries Reported - Hungarian (%)
Ancestries Reported - Irish (%)
Ancestries Reported - Italian (%)
Ancestries Reported - Lithuanian (%)
Ancestries Reported - Norwegian (%)
Ancestries Reported - Polish (%)
Ancestries Reported - Portuguese (%)
Ancestries Reported - Russian (%)
Ancestries Reported - Scotch-Irish (%)
Ancestries Reported - Scottish (%)
Ancestries Reported - Slovak (%)
Ancestries Reported - Subsaharan African (%)
Ancestries Reported - Swedish (%)
Ancestries Reported - Swiss (%)
Ancestries Reported - Ukrainian (%)
Ancestries Reported - United States (%)
Ancestries Reported - Welsh (%)
Ancestries Reported - West Indian (%)
Ancestries Reported - Other (%)
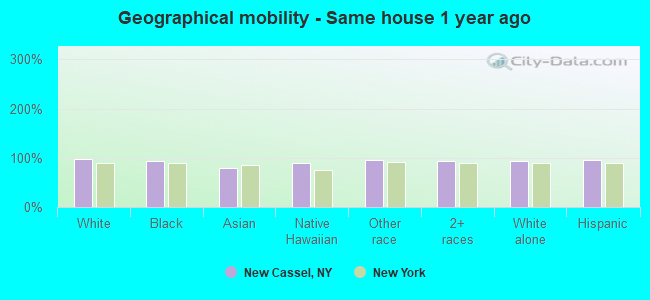
Geographical mobility - Same house 1 year ago (%)
Geographical mobility - Same house 1 year ago (%) - White
Geographical mobility - Same house 1 year ago (%) - Black or African American
Geographical mobility - Same house 1 year ago (%) - Asian
Geographical mobility - Same house 1 year ago (%) - Hispanic or Latino
Geographical mobility - Same house 1 year ago (%) - American Indian and Alaska Native
Geographical mobility - Same house 1 year ago (%) - Multirace
Geographical mobility - Same house 1 year ago (%) - Other Race
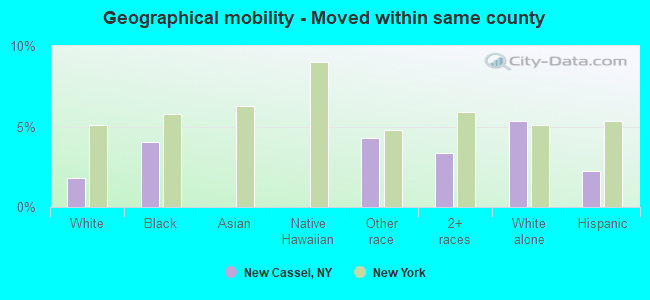
Geographical mobility - Moved within same county (%)
Geographical mobility - Moved within same county (%) - White
Geographical mobility - Moved within same county (%) - Black or African American
Geographical mobility - Moved within same county (%) - Asian
Geographical mobility - Moved within same county (%) - Hispanic or Latino
Geographical mobility - Moved within same county (%) - American Indian and Alaska Native
Geographical mobility - Moved within same county (%) - Multirace
Geographical mobility - Moved within same county (%) - Other Race
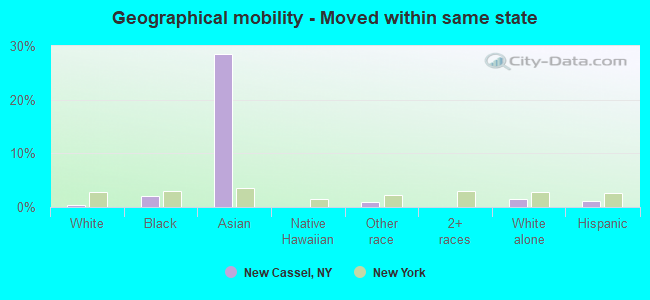
Geographical mobility - Moved from different county within same state (%)
Geographical mobility - Moved from different county within same state (%) - White
Geographical mobility - Moved from different county within same state (%) - Black or African American
Geographical mobility - Moved from different county within same state (%) - Asian
Geographical mobility - Moved from different county within same state (%) - Hispanic or Latino
Geographical mobility - Moved from different county within same state (%) - American Indian and Alaska Native
Geographical mobility - Moved from different county within same state (%) - Multirace
Geographical mobility - Moved from different county within same state (%) - Other Race
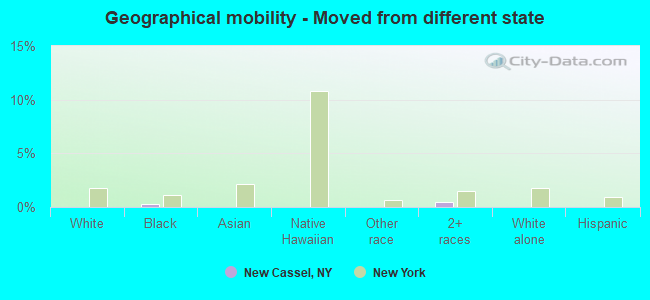
Geographical mobility - Moved from different state (%)
Geographical mobility - Moved from different state (%) - White
Geographical mobility - Moved from different state (%) - Black or African American
Geographical mobility - Moved from different state (%) - Asian
Geographical mobility - Moved from different state (%) - Hispanic or Latino
Geographical mobility - Moved from different state (%) - American Indian and Alaska Native
Geographical mobility - Moved from different state (%) - Multirace
Geographical mobility - Moved from different state (%) - Other Race
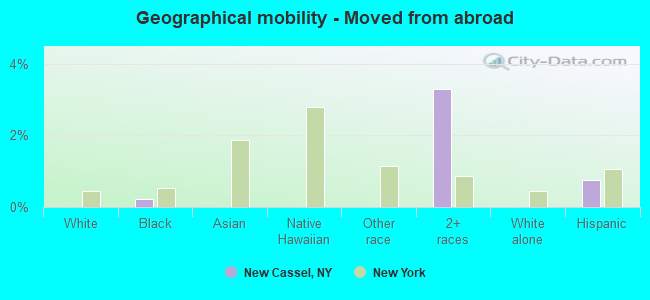
Geographical mobility - Moved from abroad (%)
Geographical mobility - Moved from abroad (%) - White
Geographical mobility - Moved from abroad (%) - Black or African American
Geographical mobility - Moved from abroad (%) - Asian
Geographical mobility - Moved from abroad (%) - Hispanic or Latino
Geographical mobility - Moved from abroad (%) - American Indian and Alaska Native
Geographical mobility - Moved from abroad (%) - Multirace
Geographical mobility - Moved from abroad (%) - Other Race
Place of birth for the foreign-born population - Ireland (%)
Place of birth for the foreign-born population - Denmark (%)
Place of birth for the foreign-born population - Norway (%)
Place of birth for the foreign-born population - Sweden (%)
Place of birth for the foreign-born population - United Kingdom (%)
Place of birth for the foreign-born population - England (%)
Place of birth for the foreign-born population - Scotland (%)
Place of birth for the foreign-born population - Other Northern Europe (%)
Place of birth for the foreign-born population - Austria (%)
Place of birth for the foreign-born population - Belgium (%)
Place of birth for the foreign-born population - France (%)
Place of birth for the foreign-born population - Germany (%)
Place of birth for the foreign-born population - Netherlands (%)
Place of birth for the foreign-born population - Switzerland (%)
Place of birth for the foreign-born population - Other Western Europe (%)
Place of birth for the foreign-born population - Greece (%)
Place of birth for the foreign-born population - Italy (%)
Place of birth for the foreign-born population - Portugal (%)
Place of birth for the foreign-born population - Spain (%)
Place of birth for the foreign-born population - Other Southern Europe (%)
Place of birth for the foreign-born population - Albania (%)
Place of birth for the foreign-born population - Belarus (%)
Place of birth for the foreign-born population - Bosnia and Herzegovina (%)
Place of birth for the foreign-born population - Bulgaria (%)
Place of birth for the foreign-born population - Croatia (%)
Place of birth for the foreign-born population - Czechoslovakia (%)
Place of birth for the foreign-born population - Hungary (%)
Place of birth for the foreign-born population - Latvia (%)
Place of birth for the foreign-born population - Lithuania (%)
Place of birth for the foreign-born population - North Macedonia (Macedonia) (%)
Place of birth for the foreign-born population - Moldova (%)
Place of birth for the foreign-born population - Poland (%)
Place of birth for the foreign-born population - Romania (%)
Place of birth for the foreign-born population - Russia (%)
Place of birth for the foreign-born population - Serbia (%)
Place of birth for the foreign-born population - Ukraine (%)
Place of birth for the foreign-born population - Other Eastern Europe (%)
Place of birth for the foreign-born population - China (%)
Place of birth for the foreign-born population - Hong Kong (%)
Place of birth for the foreign-born population - Taiwan (%)
Place of birth for the foreign-born population - Japan (%)
Place of birth for the foreign-born population - Korea (%)
Place of birth for the foreign-born population - Other Eastern Asia (%)
Place of birth for the foreign-born population - Afghanistan (%)
Place of birth for the foreign-born population - Bangladesh (%)
Place of birth for the foreign-born population - India (%)
Place of birth for the foreign-born population - Iran (%)
Place of birth for the foreign-born population - Kazakhstan (%)
Place of birth for the foreign-born population - Nepal (%)
Place of birth for the foreign-born population - Pakistan (%)
Place of birth for the foreign-born population - Sri Lanka (%)
Place of birth for the foreign-born population - Uzbekistan (%)
Place of birth for the foreign-born population - Other South Central Asia (%)
Place of birth for the foreign-born population - Burma (%)
Place of birth for the foreign-born population - Cambodia (%)
Place of birth for the foreign-born population - Indonesia (%)
Place of birth for the foreign-born population - Laos (%)
Place of birth for the foreign-born population - Malaysia (%)
Place of birth for the foreign-born population - Philippines (%)
Place of birth for the foreign-born population - Singapore (%)
Place of birth for the foreign-born population - Thailand (%)
Place of birth for the foreign-born population - Vietnam (%)
Place of birth for the foreign-born population - Other South Eastern Asia (%)
Place of birth for the foreign-born population - Armenia (%)
Place of birth for the foreign-born population - Iraq (%)
Place of birth for the foreign-born population - Israel (%)
Place of birth for the foreign-born population - Jordan (%)
Place of birth for the foreign-born population - Kuwait (%)
Place of birth for the foreign-born population - Lebanon (%)
Place of birth for the foreign-born population - Saudi Arabia (%)
Place of birth for the foreign-born population - Syria (%)
Place of birth for the foreign-born population - Turkey (%)
Place of birth for the foreign-born population - Yemen (%)
Place of birth for the foreign-born population - Other Western Asia (%)
Place of birth for the foreign-born population - Eritrea (%)
Place of birth for the foreign-born population - Ethiopia (%)
Place of birth for the foreign-born population - Kenya (%)
Place of birth for the foreign-born population - Somalia (%)
Place of birth for the foreign-born population - Uganda (%)
Place of birth for the foreign-born population - Zimbabwe (%)
Place of birth for the foreign-born population - Other Eastern Africa (%)
Place of birth for the foreign-born population - Cameroon (%)
Place of birth for the foreign-born population - Congo (%)
Place of birth for the foreign-born population - Democratic Republic of Congo (Zaire) (%)
Place of birth for the foreign-born population - Other Middle Africa (%)
Place of birth for the foreign-born population - Egypt (%)
Place of birth for the foreign-born population - Morocco (%)
Place of birth for the foreign-born population - Sudan (%)
Place of birth for the foreign-born population - Other Northern Africa (%)
Place of birth for the foreign-born population - South Africa (%)
Place of birth for the foreign-born population - Other Southern Africa (%)
Place of birth for the foreign-born population - Cabo Verde (%)
Place of birth for the foreign-born population - Ghana (%)
Place of birth for the foreign-born population - Liberia (%)
Place of birth for the foreign-born population - Nigeria (%)
Place of birth for the foreign-born population - Senegal (%)
Place of birth for the foreign-born population - Sierra Leone (%)
Place of birth for the foreign-born population - Other Western Africa (%)
Place of birth for the foreign-born population - Australia (%)
Place of birth for the foreign-born population - New Zealand (%)
Place of birth for the foreign-born population - Fiji (%)
Place of birth for the foreign-born population - Micronesia (%)
Place of birth for the foreign-born population - Bahamas (%)
Place of birth for the foreign-born population - Barbados (%)
Place of birth for the foreign-born population - Cuba (%)
Place of birth for the foreign-born population - Dominica (%)
Place of birth for the foreign-born population - Dominican Republic (%)
Place of birth for the foreign-born population - Grenada (%)
Place of birth for the foreign-born population - Haiti (%)
Place of birth for the foreign-born population - Jamaica (%)
Place of birth for the foreign-born population - St. Vincent and the Grenadines (%)
Place of birth for the foreign-born population - Trinidad and Tobago (%)
Place of birth for the foreign-born population - West Indies (%)
Place of birth for the foreign-born population - Other Caribbean (%)
Place of birth for the foreign-born population - Belize (%)
Place of birth for the foreign-born population - Costa Rica (%)
Place of birth for the foreign-born population - El Salvador (%)
Place of birth for the foreign-born population - Guatemala (%)
Place of birth for the foreign-born population - Honduras (%)
Place of birth for the foreign-born population - Mexico (%)
Place of birth for the foreign-born population - Nicaragua (%)
Place of birth for the foreign-born population - Panama (%)
Place of birth for the foreign-born population - Other Central America (%)
Place of birth for the foreign-born population - Argentina (%)
Place of birth for the foreign-born population - Bolivia (%)
Place of birth for the foreign-born population - Brazil (%)
Place of birth for the foreign-born population - Chile (%)
Place of birth for the foreign-born population - Colombia (%)
Place of birth for the foreign-born population - Ecuador (%)
Place of birth for the foreign-born population - Guyana (%)
Place of birth for the foreign-born population - Peru (%)
Place of birth for the foreign-born population - Uruguay (%)
Place of birth for the foreign-born population - Venezuela (%)
Place of birth for the foreign-born population - Other South America (%)
Place of birth for the foreign-born population - Canada (%)
Place of birth for the foreign-born population - Other Northern America (%)
Place of birth for the foreign-born population - Other (%)
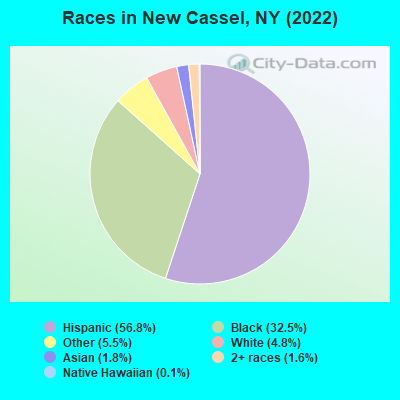
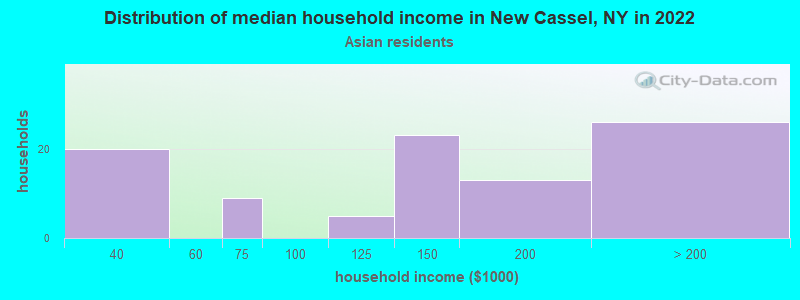
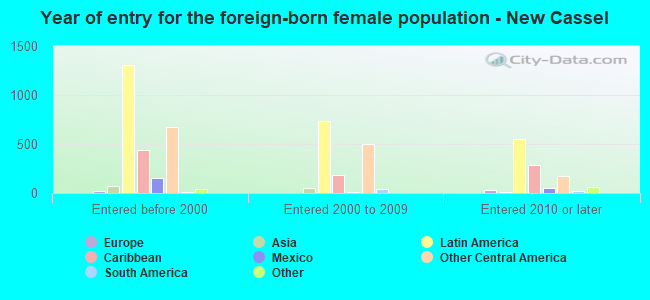
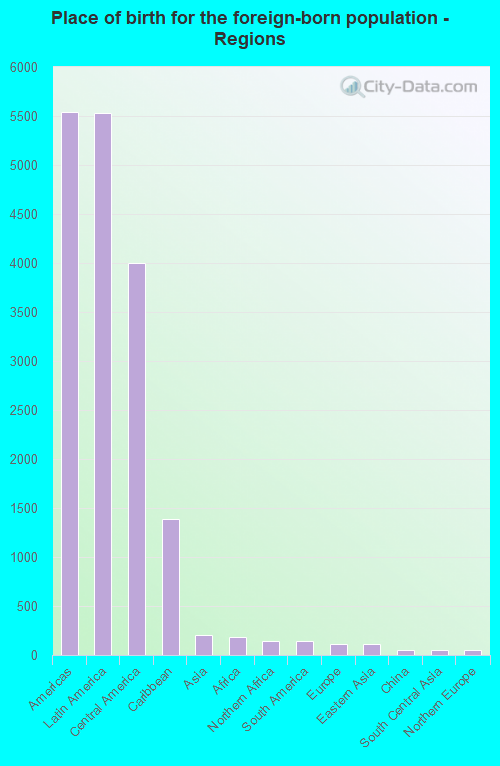
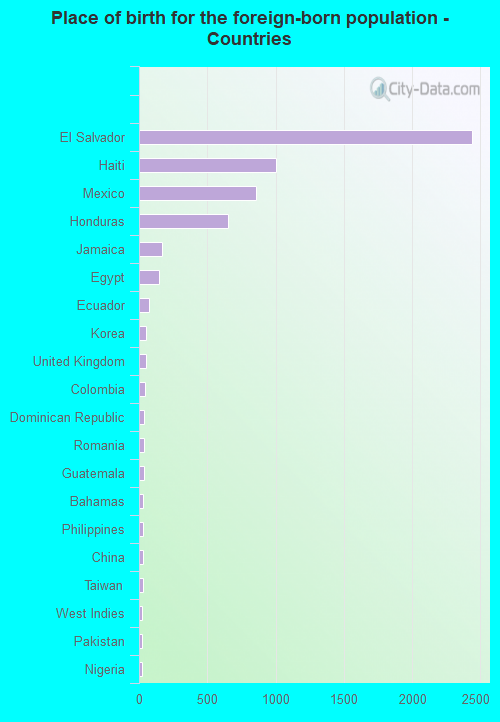
According to 2022 data, the most numerous races in New Cassel, NY are White alone (727 residents), Hispanic (8,558 residents), and Black alone (4,892 residents). 33.8% of New Cassel residents speak English at home. 40.1% of New Cassel, NY residents are foreign-born (36.9% born in Latin America), which is 45.1% greater than the foreign-born rate of 22.0% across the entire state of New York.
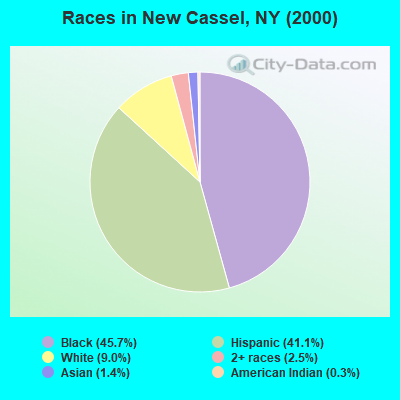
Race distribution in New Cassel
2000 2022
11,760,981 62.0% White alone 2,867,583 15.1% Hispanic 2,812,623 14.8% Black alone 1,035,926 5.5% Asian alone 366,116 1.9% Two or more races 75,499 0.4% Other race alone 52,499 0.3% American Indian alone 5,230 0.03% Native Hawaiian and Other
10,408,933 52.9% White alone 3,867,299 19.7% Hispanic 2,633,840 13.4% Black alone 1,776,286 9.0% Asian alone 732,670 3.7% Two or more races 216,110 1.1% Other race alone 35,082 0.2% American Indian alone 6,931 0.04% Native Hawaiian and Other
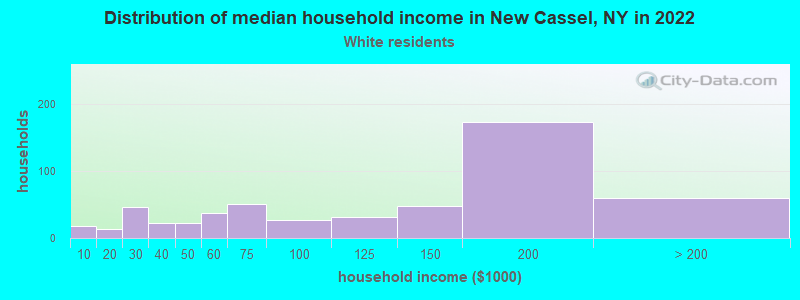
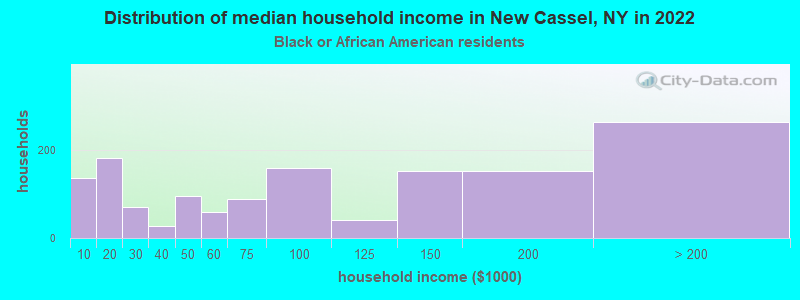
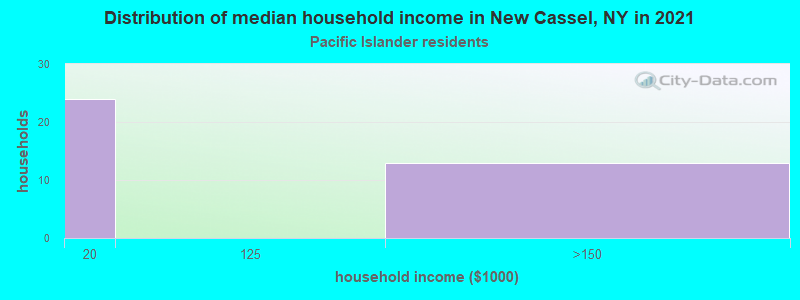
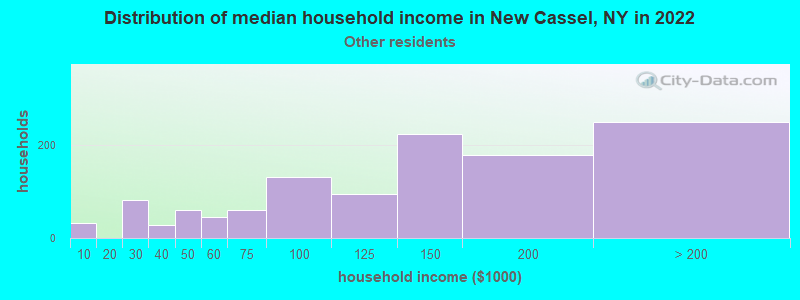
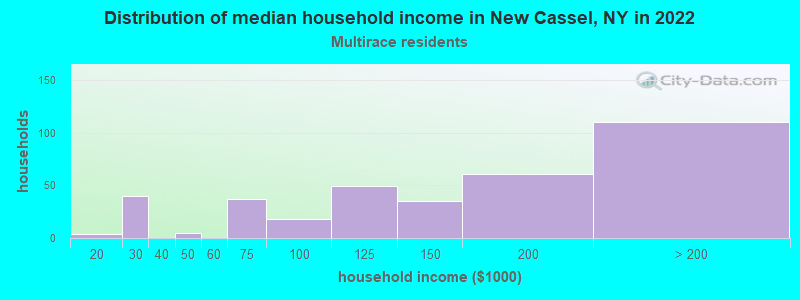
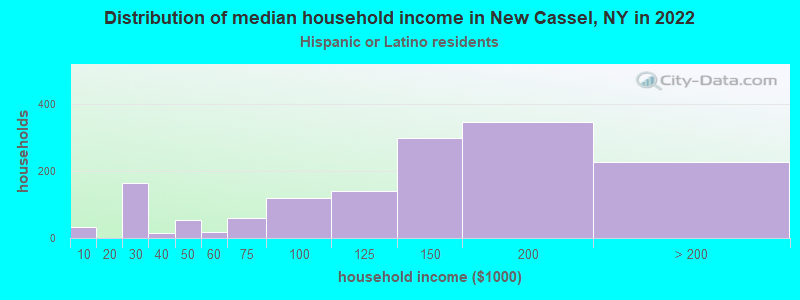
Income and house value in New Cassel Median household income in 2022 $68,599 White non-Hispanic householders$83,267 Black householders$132,082 Asian householders$140,975 Some other race householders$123,997 Two or more races householders$135,597 Hispanic or Latino race householdersMedian 2022 house value $484,616 White Non-Hispanic householders$483,722 Black or African American householders$670,182 American Indian or Alaska Native householders $573,378 Asian householders$514,402 Some other race householders$553,719 Two or more races householders$500,700 Hispanic or Latino householders
Median age by race in New Cassel
25.5 Median age for White residents24.9 27.4 34.0 Median age for Black or African American residents28.8 40.3 -855,158,729.3 Median age for American Indian / Alaska Native residents-607,543,322.5 -837,121,211.3 37.1 Median age for Asian residents37.5 38.7 30.2 Median age for Native Hawaiian / Pacific Islander residents-477,502,295.2 -497,387,669.3 29.0 Median age for Other race residents29.1 28.1 34.1 Median age for Two or more races residents34.3 32.6 53.9 Median age for White alone residents50.2 61.0 26.1 Median age for Hispanic or Latino residents25.0 27.2
Owner/renter occupied households by race in New Cassel
House owners and renters - White residents 431 76.7% Owner occupied131 23.3% Renter occupiedHouse owners and renters - Black or African American residents 885 64.4% Owner occupied489 35.6% Renter occupiedHouse owners and renters - Asian residents 90 100.0% Owner occupiedHouse owners and renters - Native Hawaiian / Pacific Islander residents 11 28.9% Owner occupied27 71.1% Renter occupiedHouse owners and renters - Other race residents 715 63.5% Owner occupied410 36.5% Renter occupiedHouse owners and renters - Two or more races residents 175 46.8% Owner occupied198 53.2% Renter occupiedHouse owners and renters - White alone residents 213 76.4% Owner occupied66 23.6% Renter occupiedHouse owners and renters - Hispanic or Latino residents 803 58.6% Owner occupied567 41.4% Renter occupied
Language usage in New Cassel
English speakers - Total 33.8% of residents of New Cassel speak English at home.
52.7% of residents speak Spanish at home 3,859 53.3% Speak English very well3,386 46.7% Speak English less than very well13.6% of residents speak other language at home 1,221 65.5% Speak English very well644 34.5% Speak English less than very well
English speakers - Born in the United States 80.3% of residents of New Cassel speak English at home.
20.3% of residents speak Spanish at home 129 100.0% Speak English very well4.7% of residents speak other language at home 17 56.7% Speak English very well13 43.3% Speak English less than very well
English speakers - Native, born elsewhere 30.4% of residents of New Cassel speak English at home.
59.9% of residents speak Spanish at home 205 85.4% Speak English very well35 14.6% Speak English less than very well6.2% of residents speak other language at home 25 100.0% Speak English very well
English speakers - Foreign-born 10.9% of residents of New Cassel speak English at home.
61.0% of residents speak Spanish at home 1,136 30.6% Speak English very well2,578 69.4% Speak English less than very well25.1% of residents speak other language at home 920 60.2% Speak English very well608 39.8% Speak English less than very well
White (Caucasian) - Speak only English Native:
25.7% (360)Foreign-born:
5.7% (57)
White (Caucasian) - Speak another language Native:
59.0% (826)Foreign-born:
89.1% (888)
Black or African American - Speak only English Native:
84.4% (2,957)Foreign-born:
32.5% (423)
Black or African American - Speak another language Native:
16.1% (565)Foreign-born:
68.2% (889)
Asian - Speak another language Native:
48.3% (45)Foreign-born:
100.0% (175)
Other race - Speak only English Native:
25.8% (677)Foreign-born:
5.1% (133)
Other race - Speak another language Native:
72.0% (1,894)Foreign-born:
95.6% (2,503)
Two or more races - Speak only English Native:
24.5% (188)Foreign-born:
4.2% (40)
Two or more races - Speak another language Native:
85.6% (655)Foreign-born:
98.0% (945)
White alone - Speak only English Native:
87.2% (307)Foreign-born:
2.5% (9)
White alone - Speak another language Native:
12.1% (43)Foreign-born:
98.3% (345)
Hispanic or Latino - Speak only English Native:
9.1% (345)Foreign-born:
5.3% (204)
Hispanic or Latino - Speak another language Native:
91.8% (3,496)Foreign-born:
94.7% (3,629)
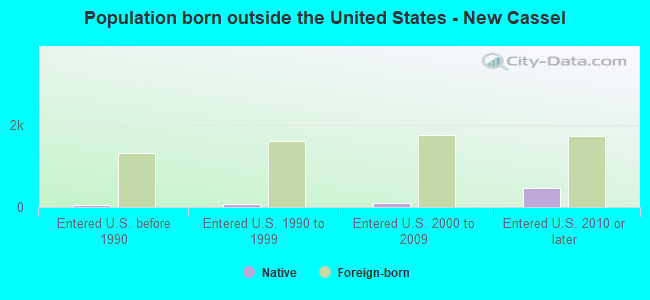
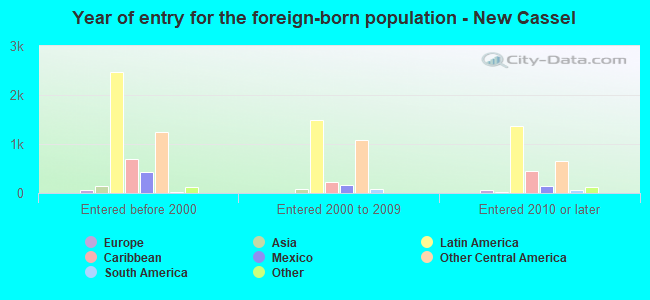
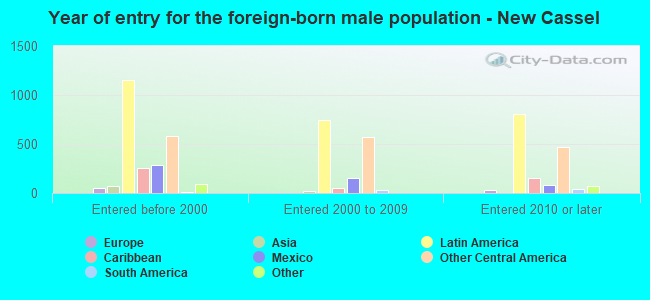
Foreign-born residents in New Cassel 6,038 residents are foreign born (36.9% Latin America ).
This city:
40.1%New York:
22.6%
Marital status for residents in New Cassel Marital status - White (Caucasian) population 15 years and over
Males 44.0% Never married49.0% Now married0.0% Separated0.5% Widowed6.5% DivorcedFemales 51.2% Never married35.5% Now married0.8% Separated8.9% Widowed3.5% DivorcedWomen who gave birth in the past 12 months Now married:
15.8% (22)Unmarried:
84.2% (119)
Women who did not give birth in the past 12 months Now married:
38.1% (241)Unmarried:
61.9% (391)
Marital status - Black or African American population 15 years and over
Males 53.9% Never married35.7% Now married1.7% Separated3.8% Widowed4.9% DivorcedFemales 53.4% Never married22.3% Now married3.9% Separated11.1% Widowed9.3% DivorcedWomen who gave birth in the past 12 months Now married:
21.4% (17)Unmarried:
78.6% (62)
Women who did not give birth in the past 12 months Now married:
20.2% (268)Unmarried:
79.8% (1,060)
Marital status - Asian population 15 years and over
Males 43.9% Never married56.1% Now married0.0% Separated0.0% Widowed0.0% DivorcedFemales 33.3% Never married47.9% Now married0.0% Separated6.8% Widowed12.0% DivorcedWomen who did not give birth in the past 12 months Now married:
44.9% (44)Unmarried:
55.1% (54)
Marital status - Native Hawaiian / Pacific Islander population 15 years and over
Males 100.0% Never married0.0% Now married0.0% Separated0.0% Widowed0.0% DivorcedFemales 19.4% Never married0.0% Now married0.0% Separated0.0% Widowed80.6% DivorcedWomen who did not give birth in the past 12 months Now married:
0.0% (0)Unmarried:
100.0% (38)
Marital status - Other race population 15 years and over
Males 49.0% Never married42.3% Now married0.0% Separated0.0% Widowed8.7% DivorcedFemales 51.8% Never married35.3% Now married1.1% Separated3.6% Widowed8.1% DivorcedWomen who gave birth in the past 12 months Now married:
35.4% (51)Unmarried:
64.6% (93)
Women who did not give birth in the past 12 months Now married:
34.9% (550)Unmarried:
65.1% (1,024)
Marital status - Two or more races population 15 years and over
Males 57.8% Never married35.0% Now married0.0% Separated0.0% Widowed7.2% DivorcedFemales 48.2% Never married40.6% Now married5.1% Separated1.5% Widowed4.7% DivorcedWomen who gave birth in the past 12 months Now married:
66.7% (36)Unmarried:
33.3% (18)
Women who did not give birth in the past 12 months Now married:
34.6% (166)Unmarried:
65.4% (314)
Marital status - White alone, not Hispanic / Latino population 15 years and over
Males 32.3% Never married57.7% Now married0.0% Separated1.7% Widowed8.3% DivorcedFemales 12.8% Never married37.8% Now married3.5% Separated37.2% Widowed8.7% DivorcedWomen who did not give birth in the past 12 months Now married:
36.7% (17)Unmarried:
63.3% (30)
Marital status - Hispanic or Latino population 15 years and over
Males 52.3% Never married41.8% Now married0.0% Separated0.0% Widowed5.8% DivorcedFemales 56.1% Never married35.3% Now married0.7% Separated1.2% Widowed6.7% DivorcedWomen who gave birth in the past 12 months Now married:
26.1% (79)Unmarried:
73.9% (225)
Women who did not give birth in the past 12 months Now married:
34.2% (747)Unmarried:
65.8% (1,438)
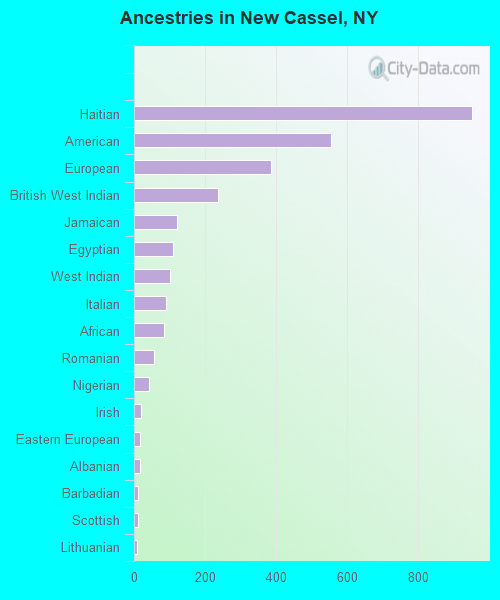
Ancestries in New Cassel
951 11.1% Haitian554 6.5% American386 4.5% European237 2.8% British West Indian121 1.4% Jamaican110 1.3% Egyptian102 1.2% West Indian89 1.0% Italian84 1.0% African57 0.7% Romanian42 0.5% Nigerian19 0.2% Irish18 0.2% Eastern European17 0.2% Albanian12 0.1% Barbadian10 0.1% Scottish9 0.1% Lithuanian5 0.06% Russian4 0.05% Polish2 0.02% German
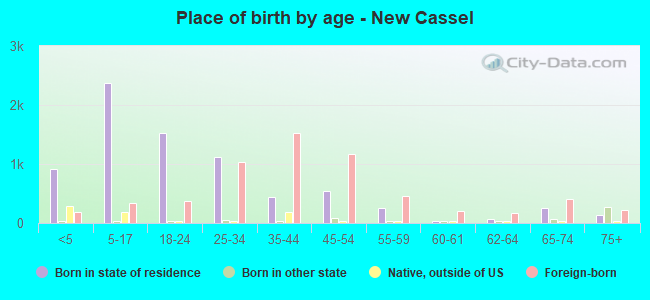
Children Nativity (place of birth) in New Cassel
Children under 6 years - Living with two parents Both parents native 34 100.0% NativeBoth parents foreign-born 366 73.7% Native131 26.3% Foreign-bornOne native, one foreign-born parent 77 100.0% NativeChildren under 6 years - Living with one parent Native parent 492 100.0% NativeForeign-born parent 121 67.6% Native58 32.4% Foreign-bornChildren 6 to 17 years - Living with two parents Both parents native 104 100.0% NativeBoth parents foreign-born 816 87.4% Native118 12.6% Foreign-bornOne native, one foreign-born parent 112 100.0% NativeChildren 6 to 17 years - Living with one parent Native parent 936 100.0% NativeForeign-born parent 377 52.6% Native339 47.4% Foreign-born
Grandparents responsible for own grandchildren in New Cassel
Grandparents (30 to 59 years) White / Caucasian 99 45.8% Responsible for grandchildren117 54.2% Not responsible for grandchildrenBlack or African American 69 30.3% Responsible for grandchildren159 69.7% Not responsible for grandchildrenOther race 193 100.0% Not responsible for grandchildrenHispanic or Latino 118 29.9% Responsible for grandchildren277 70.1% Not responsible for grandchildren
Grandparents (60 years and over) White / Caucasian 30 100.0% Not responsible for grandchildrenBlack or African American 2 0.9% Responsible for grandchildren196 99.1% Not responsible for grandchildrenOther race 18 100.0% Not responsible for grandchildrenHispanic or Latino 30 100.0% Not responsible for grandchildren