Races in New Brighton, Minnesota (MN) Detailed Stats
Data:
Races - White alone (%)
Races - White alone (% change since 2000)
Races - Black alone (%)
Races - Black alone (% change since 2000)
Races - American Indian alone (%)
Races - American Indian alone (% change since 2000)
Races - Asian alone (%)
Races - Asian alone (% change since 2000)
Races - Hispanic (%)
Races - Hispanic (% change since 2000)
Races - Native Hawaiian and Other Pacific Islander alone (%)
Races - Native Hawaiian and Other Pacific Islander alone (% change since 2000)
Races - Two or more races(%)
Races - Two or more races(% change since 2000)
Races - Other race alone (%)
Races - Other race alone (% change since 2000)
Racial diversity
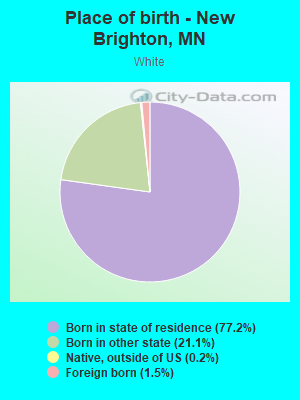
Place of birth - Born in state of residence (%)
Place of birth - Born in state of residence (%) - White
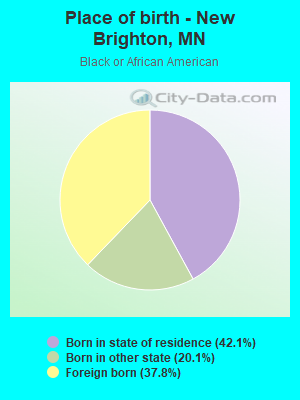
Place of birth - Born in state of residence (%) - Black or African American
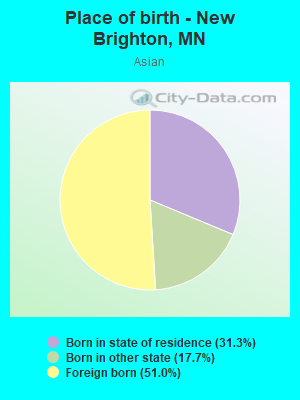
Place of birth - Born in state of residence (%) - Asian
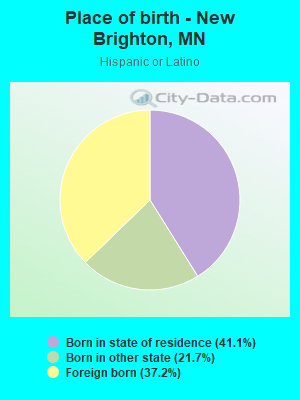
Place of birth - Born in state of residence (%) - Hispanic or Latino
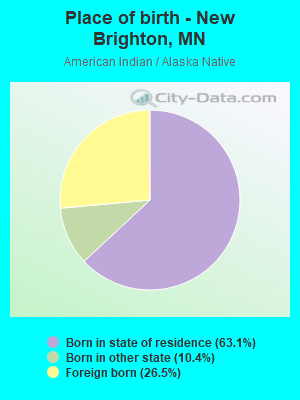
Place of birth - Born in state of residence (%) - American Indian and Alaska Native
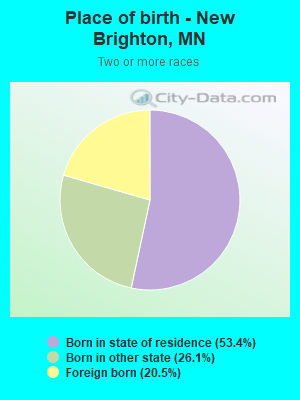
Place of birth - Born in state of residence (%) - Multirace
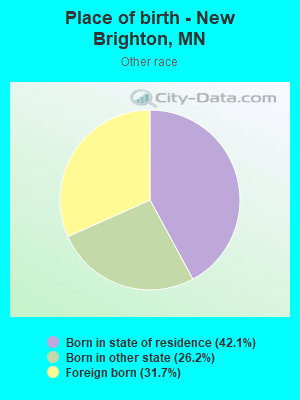
Place of birth - Born in state of residence (%) - Other Race
Place of birth - Born in other state (%)
Place of birth - Born in other state (%) - White
Place of birth - Born in other state (%) - Black or African American
Place of birth - Born in other state (%) - Asian
Place of birth - Born in other state (%) - Hispanic or Latino
Place of birth - Born in other state (%) - American Indian and Alaska Native
Place of birth - Born in other state (%) - Multirace
Place of birth - Born in other state (%) - Other Race
Place of birth - Native, outside of US (%)
Place of birth - Native, outside of US (%) - White
Place of birth - Native, outside of US (%) - Black or African American
Place of birth - Native, outside of US (%) - Asian
Place of birth - Native, outside of US (%) - Hispanic or Latino
Place of birth - Native, outside of US (%) - American Indian and Alaska Native
Place of birth - Native, outside of US (%) - Multirace
Place of birth - Native, outside of US (%) - Other Race
Place of birth - Foreign born (%)
Place of birth - Foreign born (%) - White
Place of birth - Foreign born (%) - Black or African American
Place of birth - Foreign born (%) - Asian
Place of birth - Foreign born (%) - Hispanic or Latino
Place of birth - Foreign born (%) - American Indian and Alaska Native
Place of birth - Foreign born (%) - Multirace
Place of birth - Foreign born (%) - Other Race
Residents speaking English at home (%)
Residents speaking English at home - Born in the United States (%)
Residents speaking English at home - Native, born elsewhere (%)
Residents speaking English at home - Foreign born (%)
Residents speaking Spanish at home (%)
Residents speaking Spanish at home - Born in the United States (%)
Residents speaking Spanish at home - Native, born elsewhere (%)
Residents speaking Spanish at home - Foreign born (%)
Residents speaking other language at home (%)
Residents speaking other language at home - Born in the United States (%)
Residents speaking other language at home - Native, born elsewhere (%)
Residents speaking other language at home - Foreign born (%)
Marital status - Never married (%)
Marital status - Now married (%)
Marital status - Separated (%)
Marital status - Widowed (%)
Marital status - Divorced (%)
Ancestries Reported - Arab (%)
Ancestries Reported - Czech (%)
Ancestries Reported - Danish (%)
Ancestries Reported - Dutch (%)
Ancestries Reported - English (%)
Ancestries Reported - French (%)
Ancestries Reported - French Canadian (%)
Ancestries Reported - German (%)
Ancestries Reported - Greek (%)
Ancestries Reported - Hungarian (%)
Ancestries Reported - Irish (%)
Ancestries Reported - Italian (%)
Ancestries Reported - Lithuanian (%)
Ancestries Reported - Norwegian (%)
Ancestries Reported - Polish (%)
Ancestries Reported - Portuguese (%)
Ancestries Reported - Russian (%)
Ancestries Reported - Scotch-Irish (%)
Ancestries Reported - Scottish (%)
Ancestries Reported - Slovak (%)
Ancestries Reported - Subsaharan African (%)
Ancestries Reported - Swedish (%)
Ancestries Reported - Swiss (%)
Ancestries Reported - Ukrainian (%)
Ancestries Reported - United States (%)
Ancestries Reported - Welsh (%)
Ancestries Reported - West Indian (%)
Ancestries Reported - Other (%)
Geographical mobility - Same house 1 year ago (%)
Geographical mobility - Same house 1 year ago (%) - White
Geographical mobility - Same house 1 year ago (%) - Black or African American
Geographical mobility - Same house 1 year ago (%) - Asian
Geographical mobility - Same house 1 year ago (%) - Hispanic or Latino
Geographical mobility - Same house 1 year ago (%) - American Indian and Alaska Native
Geographical mobility - Same house 1 year ago (%) - Multirace
Geographical mobility - Same house 1 year ago (%) - Other Race
Geographical mobility - Moved within same county (%)
Geographical mobility - Moved within same county (%) - White
Geographical mobility - Moved within same county (%) - Black or African American
Geographical mobility - Moved within same county (%) - Asian
Geographical mobility - Moved within same county (%) - Hispanic or Latino
Geographical mobility - Moved within same county (%) - American Indian and Alaska Native
Geographical mobility - Moved within same county (%) - Multirace
Geographical mobility - Moved within same county (%) - Other Race
Geographical mobility - Moved from different county within same state (%)
Geographical mobility - Moved from different county within same state (%) - White
Geographical mobility - Moved from different county within same state (%) - Black or African American
Geographical mobility - Moved from different county within same state (%) - Asian
Geographical mobility - Moved from different county within same state (%) - Hispanic or Latino
Geographical mobility - Moved from different county within same state (%) - American Indian and Alaska Native
Geographical mobility - Moved from different county within same state (%) - Multirace
Geographical mobility - Moved from different county within same state (%) - Other Race
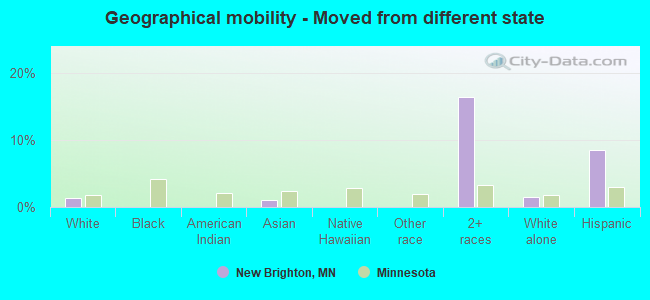
Geographical mobility - Moved from different state (%)
Geographical mobility - Moved from different state (%) - White
Geographical mobility - Moved from different state (%) - Black or African American
Geographical mobility - Moved from different state (%) - Asian
Geographical mobility - Moved from different state (%) - Hispanic or Latino
Geographical mobility - Moved from different state (%) - American Indian and Alaska Native
Geographical mobility - Moved from different state (%) - Multirace
Geographical mobility - Moved from different state (%) - Other Race
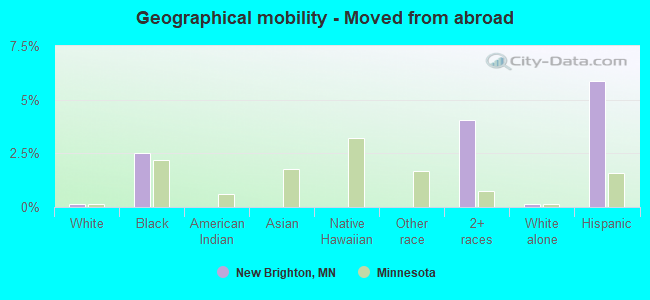
Geographical mobility - Moved from abroad (%)
Geographical mobility - Moved from abroad (%) - White
Geographical mobility - Moved from abroad (%) - Black or African American
Geographical mobility - Moved from abroad (%) - Asian
Geographical mobility - Moved from abroad (%) - Hispanic or Latino
Geographical mobility - Moved from abroad (%) - American Indian and Alaska Native
Geographical mobility - Moved from abroad (%) - Multirace
Geographical mobility - Moved from abroad (%) - Other Race
Place of birth for the foreign-born population - Ireland (%)
Place of birth for the foreign-born population - Denmark (%)
Place of birth for the foreign-born population - Norway (%)
Place of birth for the foreign-born population - Sweden (%)
Place of birth for the foreign-born population - United Kingdom (%)
Place of birth for the foreign-born population - England (%)
Place of birth for the foreign-born population - Scotland (%)
Place of birth for the foreign-born population - Other Northern Europe (%)
Place of birth for the foreign-born population - Austria (%)
Place of birth for the foreign-born population - Belgium (%)
Place of birth for the foreign-born population - France (%)
Place of birth for the foreign-born population - Germany (%)
Place of birth for the foreign-born population - Netherlands (%)
Place of birth for the foreign-born population - Switzerland (%)
Place of birth for the foreign-born population - Other Western Europe (%)
Place of birth for the foreign-born population - Greece (%)
Place of birth for the foreign-born population - Italy (%)
Place of birth for the foreign-born population - Portugal (%)
Place of birth for the foreign-born population - Spain (%)
Place of birth for the foreign-born population - Other Southern Europe (%)
Place of birth for the foreign-born population - Albania (%)
Place of birth for the foreign-born population - Belarus (%)
Place of birth for the foreign-born population - Bosnia and Herzegovina (%)
Place of birth for the foreign-born population - Bulgaria (%)
Place of birth for the foreign-born population - Croatia (%)
Place of birth for the foreign-born population - Czechoslovakia (%)
Place of birth for the foreign-born population - Hungary (%)
Place of birth for the foreign-born population - Latvia (%)
Place of birth for the foreign-born population - Lithuania (%)
Place of birth for the foreign-born population - North Macedonia (Macedonia) (%)
Place of birth for the foreign-born population - Moldova (%)
Place of birth for the foreign-born population - Poland (%)
Place of birth for the foreign-born population - Romania (%)
Place of birth for the foreign-born population - Russia (%)
Place of birth for the foreign-born population - Serbia (%)
Place of birth for the foreign-born population - Ukraine (%)
Place of birth for the foreign-born population - Other Eastern Europe (%)
Place of birth for the foreign-born population - China (%)
Place of birth for the foreign-born population - Hong Kong (%)
Place of birth for the foreign-born population - Taiwan (%)
Place of birth for the foreign-born population - Japan (%)
Place of birth for the foreign-born population - Korea (%)
Place of birth for the foreign-born population - Other Eastern Asia (%)
Place of birth for the foreign-born population - Afghanistan (%)
Place of birth for the foreign-born population - Bangladesh (%)
Place of birth for the foreign-born population - India (%)
Place of birth for the foreign-born population - Iran (%)
Place of birth for the foreign-born population - Kazakhstan (%)
Place of birth for the foreign-born population - Nepal (%)
Place of birth for the foreign-born population - Pakistan (%)
Place of birth for the foreign-born population - Sri Lanka (%)
Place of birth for the foreign-born population - Uzbekistan (%)
Place of birth for the foreign-born population - Other South Central Asia (%)
Place of birth for the foreign-born population - Burma (%)
Place of birth for the foreign-born population - Cambodia (%)
Place of birth for the foreign-born population - Indonesia (%)
Place of birth for the foreign-born population - Laos (%)
Place of birth for the foreign-born population - Malaysia (%)
Place of birth for the foreign-born population - Philippines (%)
Place of birth for the foreign-born population - Singapore (%)
Place of birth for the foreign-born population - Thailand (%)
Place of birth for the foreign-born population - Vietnam (%)
Place of birth for the foreign-born population - Other South Eastern Asia (%)
Place of birth for the foreign-born population - Armenia (%)
Place of birth for the foreign-born population - Iraq (%)
Place of birth for the foreign-born population - Israel (%)
Place of birth for the foreign-born population - Jordan (%)
Place of birth for the foreign-born population - Kuwait (%)
Place of birth for the foreign-born population - Lebanon (%)
Place of birth for the foreign-born population - Saudi Arabia (%)
Place of birth for the foreign-born population - Syria (%)
Place of birth for the foreign-born population - Turkey (%)
Place of birth for the foreign-born population - Yemen (%)
Place of birth for the foreign-born population - Other Western Asia (%)
Place of birth for the foreign-born population - Eritrea (%)
Place of birth for the foreign-born population - Ethiopia (%)
Place of birth for the foreign-born population - Kenya (%)
Place of birth for the foreign-born population - Somalia (%)
Place of birth for the foreign-born population - Uganda (%)
Place of birth for the foreign-born population - Zimbabwe (%)
Place of birth for the foreign-born population - Other Eastern Africa (%)
Place of birth for the foreign-born population - Cameroon (%)
Place of birth for the foreign-born population - Congo (%)
Place of birth for the foreign-born population - Democratic Republic of Congo (Zaire) (%)
Place of birth for the foreign-born population - Other Middle Africa (%)
Place of birth for the foreign-born population - Egypt (%)
Place of birth for the foreign-born population - Morocco (%)
Place of birth for the foreign-born population - Sudan (%)
Place of birth for the foreign-born population - Other Northern Africa (%)
Place of birth for the foreign-born population - South Africa (%)
Place of birth for the foreign-born population - Other Southern Africa (%)
Place of birth for the foreign-born population - Cabo Verde (%)
Place of birth for the foreign-born population - Ghana (%)
Place of birth for the foreign-born population - Liberia (%)
Place of birth for the foreign-born population - Nigeria (%)
Place of birth for the foreign-born population - Senegal (%)
Place of birth for the foreign-born population - Sierra Leone (%)
Place of birth for the foreign-born population - Other Western Africa (%)
Place of birth for the foreign-born population - Australia (%)
Place of birth for the foreign-born population - New Zealand (%)
Place of birth for the foreign-born population - Fiji (%)
Place of birth for the foreign-born population - Micronesia (%)
Place of birth for the foreign-born population - Bahamas (%)
Place of birth for the foreign-born population - Barbados (%)
Place of birth for the foreign-born population - Cuba (%)
Place of birth for the foreign-born population - Dominica (%)
Place of birth for the foreign-born population - Dominican Republic (%)
Place of birth for the foreign-born population - Grenada (%)
Place of birth for the foreign-born population - Haiti (%)
Place of birth for the foreign-born population - Jamaica (%)
Place of birth for the foreign-born population - St. Vincent and the Grenadines (%)
Place of birth for the foreign-born population - Trinidad and Tobago (%)
Place of birth for the foreign-born population - West Indies (%)
Place of birth for the foreign-born population - Other Caribbean (%)
Place of birth for the foreign-born population - Belize (%)
Place of birth for the foreign-born population - Costa Rica (%)
Place of birth for the foreign-born population - El Salvador (%)
Place of birth for the foreign-born population - Guatemala (%)
Place of birth for the foreign-born population - Honduras (%)
Place of birth for the foreign-born population - Mexico (%)
Place of birth for the foreign-born population - Nicaragua (%)
Place of birth for the foreign-born population - Panama (%)
Place of birth for the foreign-born population - Other Central America (%)
Place of birth for the foreign-born population - Argentina (%)
Place of birth for the foreign-born population - Bolivia (%)
Place of birth for the foreign-born population - Brazil (%)
Place of birth for the foreign-born population - Chile (%)
Place of birth for the foreign-born population - Colombia (%)
Place of birth for the foreign-born population - Ecuador (%)
Place of birth for the foreign-born population - Guyana (%)
Place of birth for the foreign-born population - Peru (%)
Place of birth for the foreign-born population - Uruguay (%)
Place of birth for the foreign-born population - Venezuela (%)
Place of birth for the foreign-born population - Other South America (%)
Place of birth for the foreign-born population - Canada (%)
Place of birth for the foreign-born population - Other Northern America (%)
Place of birth for the foreign-born population - Other (%)
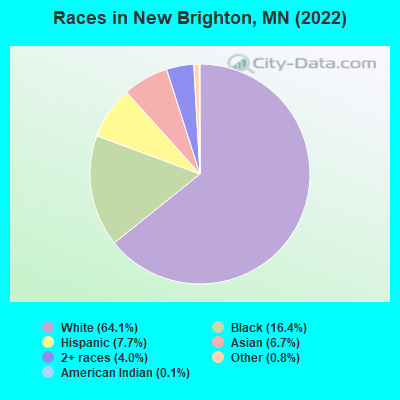
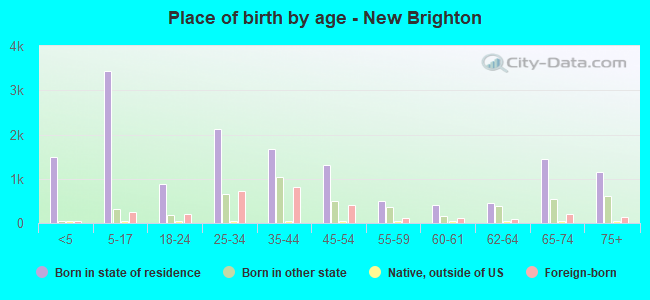
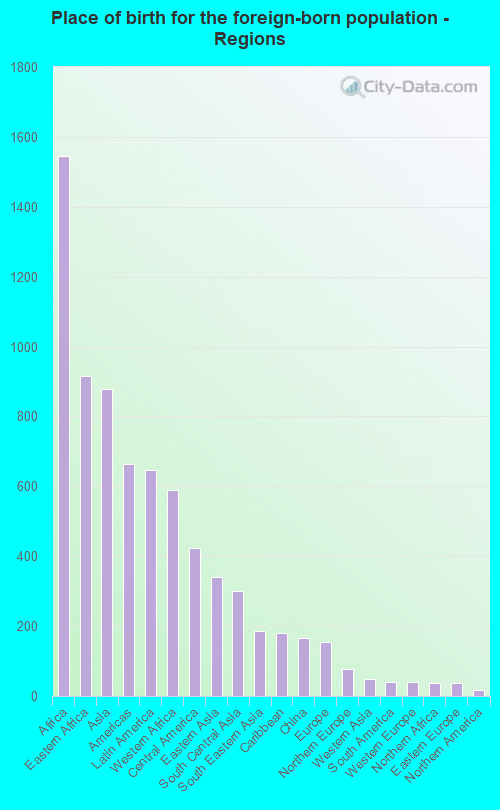
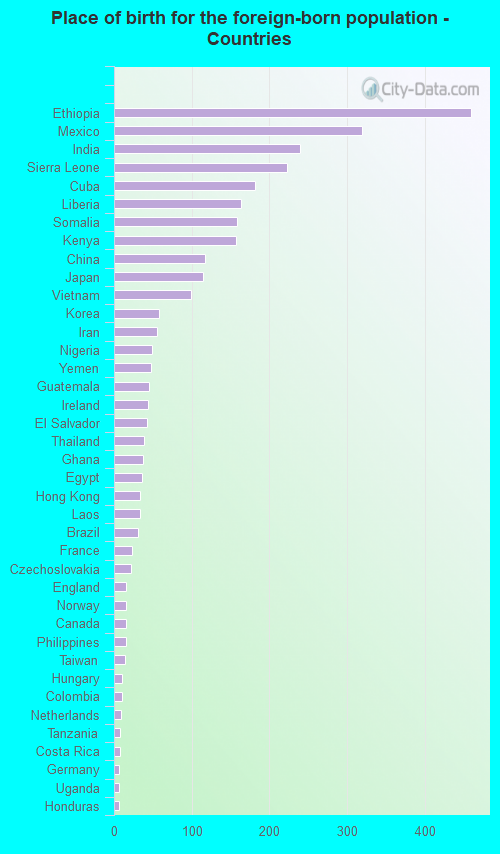
According to 2022 data, the most numerous races in New Brighton, MN are White alone (14,549 residents), Black alone (3,714 residents), and Hispanic (1,742 residents). 83.5% of New Brighton residents speak English at home. 14.3% of New Brighton, MN residents are foreign-born (6.4% born in Africa, 3.7% born in Asia, 2.7% born in Latin America), which is 44.0% greater than the foreign-born rate of 8.0% across the entire state of Minnesota.
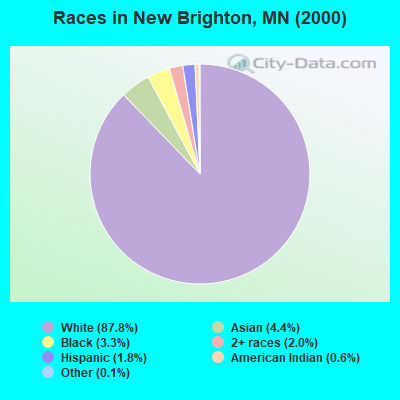
Race distribution in New Brighton
2000 2022
4,337,143 88.2% White alone 168,813 3.4% Black alone 143,382 2.9% Hispanic 141,083 2.9% Asian alone 70,304 1.4% Two or more races 52,009 1.1% American Indian alone 5,031 0.1% Other race alone 1,714 0.03% Native Hawaiian and Other
4,356,347 76.2% White alone 395,179 6.9% Black alone 333,830 5.8% Hispanic 294,800 5.2% Asian alone 259,649 4.5% Two or more races 42,125 0.7% American Indian alone 32,976 0.6% Other race alone 2,278 0.04% Native Hawaiian and Other
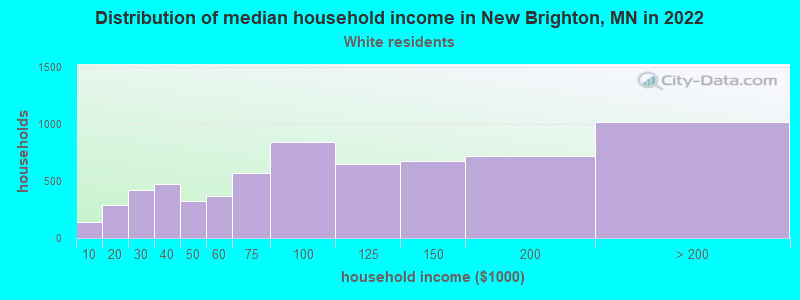
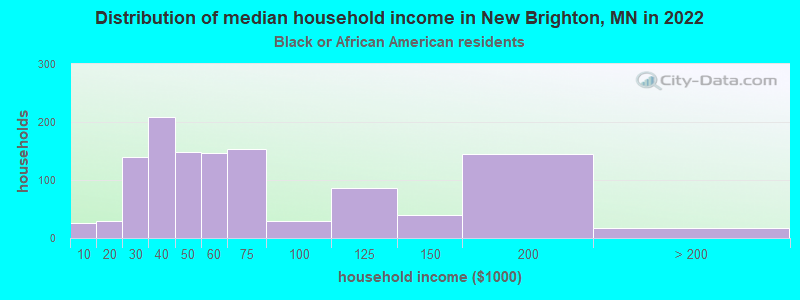
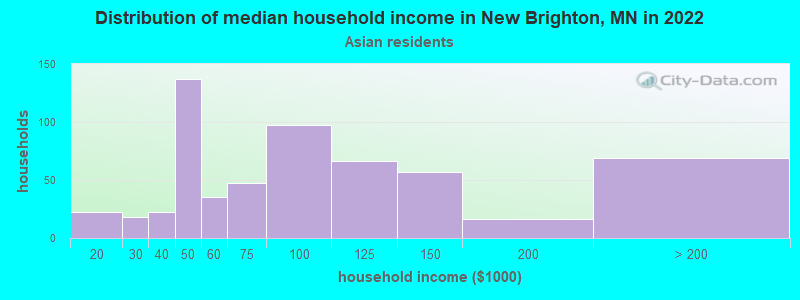
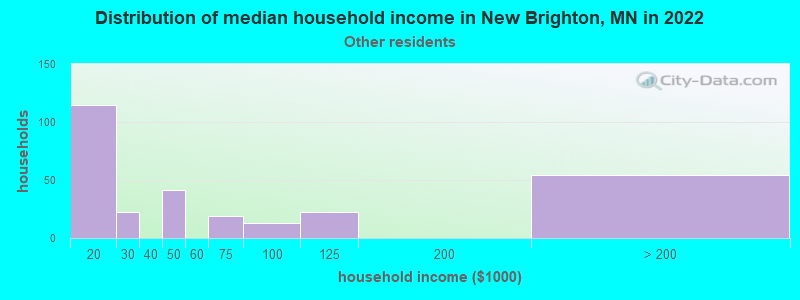
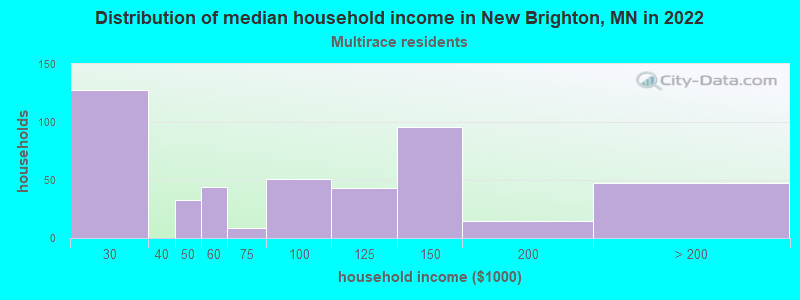
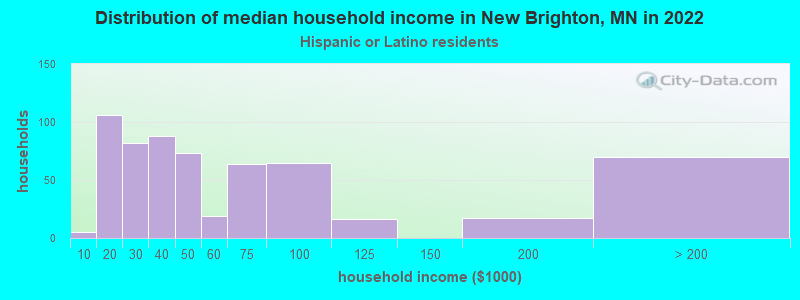
Income and house value in New Brighton Median household income in 2022 $98,240 White non-Hispanic householders$43,398 Black householders$54,016 Asian householders$72,126 Two or more races householders$40,391 Hispanic or Latino race householdersMedian 2022 house value $370,618 White Non-Hispanic householders$365,488 Black or African American householders$247,506 American Indian or Alaska Native householders $363,949 Asian householders$480,906 Some other race householders$130,806 Two or more races householders$468,851 Hispanic or Latino householders
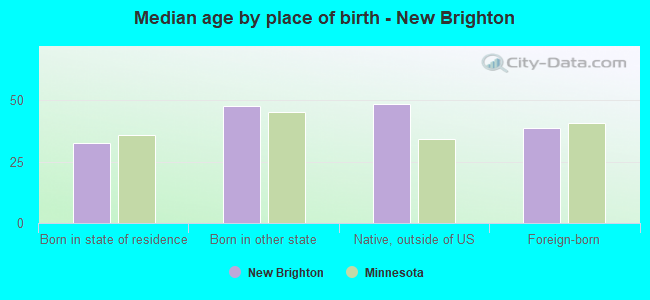
Median age by race in New Brighton
44.3 Median age for White residents43.2 45.0 25.4 Median age for Black or African American residents22.4 26.6 48.3 Median age for American Indian / Alaska Native residents-1,081,272,083.7 41.2 33.3 Median age for Asian residents37.4 33.7 -744,336,568.8 Median age for Native Hawaiian / Pacific Islander residents-856,799,036.4 -534,959,349.1 31.3 Median age for Other race residents26.8 32.4 30.5 Median age for Two or more races residents31.5 29.3 43.7 Median age for White alone residents42.9 44.2 30.9 Median age for Hispanic or Latino residents29.6 34.1
Owner/renter occupied households by race in New Brighton
House owners and renters - White residents 4,947 75.4% Owner occupied1,615 24.6% Renter occupiedHouse owners and renters - Black or African American residents 47 3.8% Owner occupied1,190 96.2% Renter occupiedHouse owners and renters - American Indian / Alaska Native residents 5 100.0% Owner occupiedHouse owners and renters - Asian residents 370 54.8% Owner occupied305 45.2% Renter occupiedHouse owners and renters - Other race residents 190 59.4% Owner occupied130 40.6% Renter occupiedHouse owners and renters - Two or more races residents 217 48.4% Owner occupied231 51.6% Renter occupiedHouse owners and renters - White alone residents 4,892 75.8% Owner occupied1,562 24.2% Renter occupiedHouse owners and renters - Hispanic or Latino residents 249 42.1% Owner occupied342 57.9% Renter occupied
Language usage in New Brighton
English speakers - Total 83.5% of residents of New Brighton speak English at home.
4.6% of residents speak Spanish at home 473 48.2% Speak English very well509 51.8% Speak English less than very well12.1% of residents speak other language at home 1,290 50.3% Speak English very well1,277 49.7% Speak English less than very well
English speakers - Born in the United States 92.6% of residents of New Brighton speak English at home.
2.2% of residents speak Spanish at home 62 59.0% Speak English very well43 41.0% Speak English less than very well4.6% of residents speak other language at home 217 100.0% Speak English very well
English speakers - Native, born elsewhere 86.3% of residents of New Brighton speak English at home.
English speakers - Foreign-born 14.9% of residents of New Brighton speak English at home.
20.8% of residents speak Spanish at home 201 31.7% Speak English very well434 68.3% Speak English less than very well64.6% of residents speak other language at home 825 41.7% Speak English very well1,152 58.3% Speak English less than very well
White (Caucasian) - Speak only English Native:
99.7% (13,715)Foreign-born:
52.0% (109)
White (Caucasian) - Speak another language Native:
1.0% (140)Foreign-born:
52.1% (109)
Black or African American - Speak only English Native:
98.9% (1,953)Foreign-born:
16.6% (223)
Black or African American - Speak another language Native:
2.1% (41)Foreign-born:
82.8% (1,114)
Asian - Speak only English Native:
25.4% (175)Foreign-born:
9.9% (77)
Asian - Speak another language Native:
72.8% (502)Foreign-born:
90.0% (697)
Other race - Speak only English Native:
49.8% (297)Foreign-born:
4.5% (14)
Other race - Speak another language Native:
50.4% (300)Foreign-born:
95.1% (300)
White alone - Speak only English Native:
99.2% (13,587)Foreign-born:
63.8% (122)
White alone - Speak another language Native:
1.0% (135)Foreign-born:
39.1% (75)
Hispanic or Latino - Speak only English Native:
66.0% (514)Foreign-born:
1.6% (10)
Hispanic or Latino - Speak another language Native:
33.0% (257)Foreign-born:
98.2% (626)
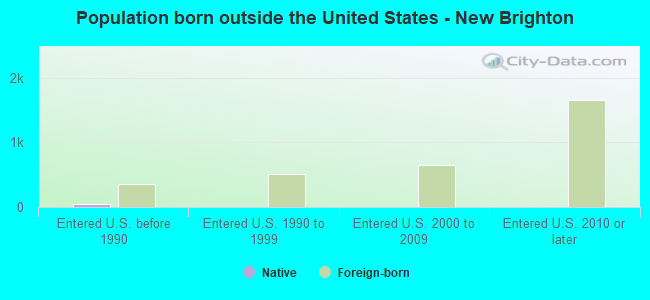
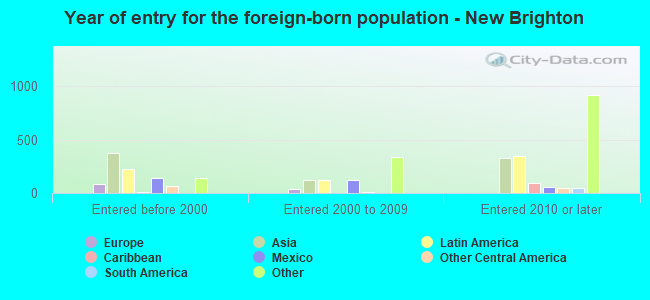
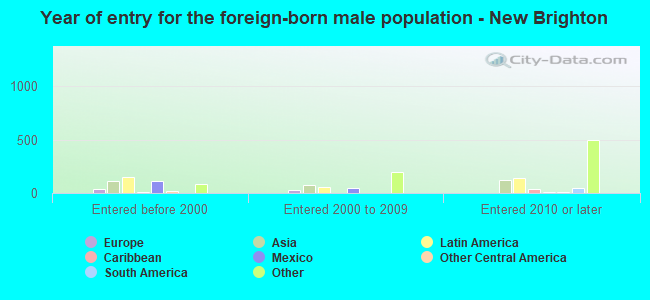
Foreign-born residents in New Brighton 3,241 residents are foreign born (6.4% Africa , 3.7% Asia , 2.7% Latin America ).
This city:
14.3%Minnesota:
8.5%
Marital status for residents in New Brighton Marital status - White (Caucasian) population 15 years and over
Males 30.4% Never married56.5% Now married0.7% Separated4.2% Widowed8.2% DivorcedFemales 26.0% Never married52.1% Now married1.1% Separated8.9% Widowed11.9% DivorcedWomen who gave birth in the past 12 months Now married:
90.0% (141)Unmarried:
10.0% (16)
Women who did not give birth in the past 12 months Now married:
47.6% (1,390)Unmarried:
52.4% (1,531)
Marital status - Black or African American population 15 years and over
Males 38.1% Never married47.9% Now married5.9% Separated1.7% Widowed6.3% DivorcedFemales 65.5% Never married28.0% Now married0.0% Separated1.2% Widowed5.2% DivorcedWomen who gave birth in the past 12 months Now married:
100.0% (46)Unmarried:
0.0% (0)
Women who did not give birth in the past 12 months Now married:
25.0% (265)Unmarried:
75.0% (796)
Marital status - American Indian / Alaska Native population 15 years and over
Males 0.0% Never married100.0% Now married0.0% Separated0.0% Widowed0.0% DivorcedFemales 52.3% Never married36.4% Now married0.0% Separated0.0% Widowed11.4% DivorcedWomen who did not give birth in the past 12 months Now married:
50.0% (17)Unmarried:
50.0% (17)
Marital status - Asian population 15 years and over
Males 21.2% Never married64.0% Now married0.0% Separated2.2% Widowed12.6% DivorcedFemales 51.5% Never married36.6% Now married1.6% Separated1.2% Widowed9.1% DivorcedWomen who gave birth in the past 12 months Now married:
100.0% (27)Unmarried:
0.0% (0)
Women who did not give birth in the past 12 months Now married:
30.7% (198)Unmarried:
69.3% (448)
Marital status - Other race population 15 years and over
Males 51.6% Never married48.4% Now married0.0% Separated0.0% Widowed0.0% DivorcedFemales 25.6% Never married74.4% Now married0.0% Separated0.0% Widowed0.0% DivorcedWomen who did not give birth in the past 12 months Now married:
68.3% (285)Unmarried:
31.7% (133)
Marital status - Two or more races population 15 years and over
Males 26.2% Never married66.6% Now married0.0% Separated2.0% Widowed5.2% DivorcedFemales 32.9% Never married61.5% Now married3.8% Separated0.0% Widowed1.9% DivorcedWomen who gave birth in the past 12 months Now married:
100.0% (8)Unmarried:
0.0% (0)
Women who did not give birth in the past 12 months Now married:
58.9% (205)Unmarried:
41.1% (143)
Marital status - White alone, not Hispanic / Latino population 15 years and over
Males 31.2% Never married56.7% Now married0.0% Separated4.2% Widowed7.9% DivorcedFemales 25.8% Never married52.5% Now married0.5% Separated9.1% Widowed12.0% DivorcedWomen who gave birth in the past 12 months Now married:
89.4% (136)Unmarried:
10.6% (16)
Women who did not give birth in the past 12 months Now married:
48.0% (1,412)Unmarried:
52.0% (1,529)
Marital status - Hispanic or Latino population 15 years and over
Males 29.1% Never married52.4% Now married7.5% Separated1.6% Widowed9.4% DivorcedFemales 27.1% Never married64.0% Now married7.0% Separated0.0% Widowed2.0% DivorcedWomen who gave birth in the past 12 months Now married:
100.0% (10)Unmarried:
0.0% (0)
Women who did not give birth in the past 12 months Now married:
67.1% (339)Unmarried:
32.9% (166)
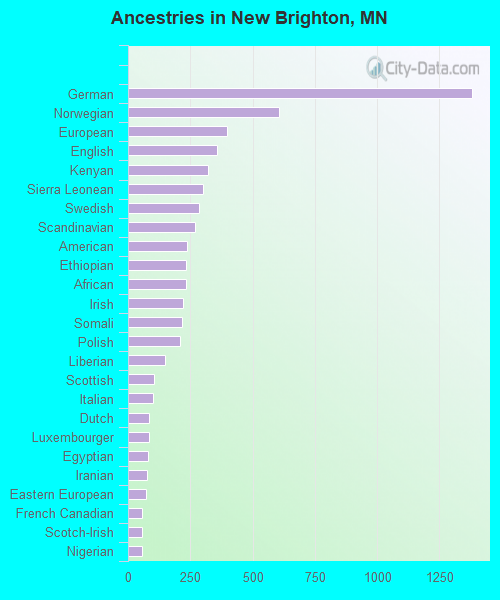
Ancestries in New Brighton
1,380 14.1% German608 6.2% Norwegian397 4.0% European359 3.7% English323 3.3% Kenyan301 3.1% Sierra Leonean283 2.9% Swedish267 2.7% Scandinavian235 2.4% American233 2.4% Ethiopian232 2.4% African220 2.2% Irish215 2.2% Somali208 2.1% Polish148 1.5% Liberian105 1.1% Scottish102 1.0% Italian83 0.8% Dutch83 0.8% Luxembourger82 0.8% Egyptian76 0.8% Iranian74 0.8% Eastern European56 0.6% French Canadian55 0.6% Scotch-Irish55 0.6% Nigerian41 0.4% Danish35 0.4% Croatian34 0.3% French31 0.3% Slovak30 0.3% Brazilian29 0.3% Czech28 0.3% Finnish21 0.2% Hungarian21 0.2% British15 0.2% Czechoslovakian13 0.1% Northern European12 0.1% Armenian10 0.1% Belgian7 0.07% Swiss3 0.03% Yugoslavian2 0.02% Russian1 0.01% Sudanese
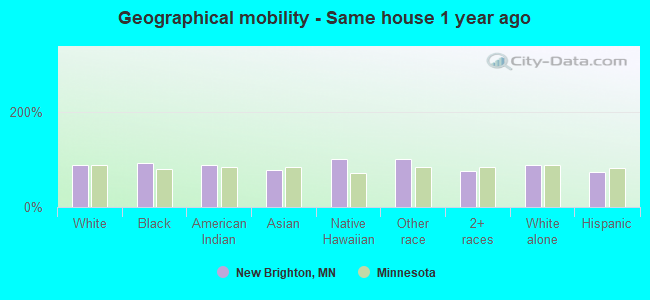
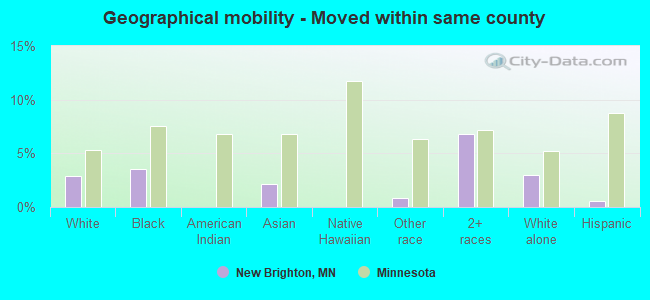
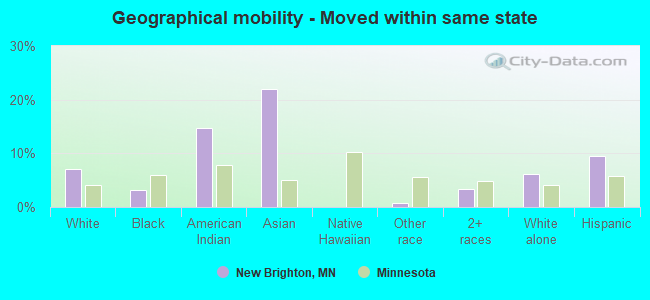
Geographical mobility in New Brighton Same house 1 year ago 12,714 87.9% White (Caucasian)3,364 92.4% Black or African American47 87.9% American Indian / Alaska Native1,179 78.3% Asian1 100.0% Native Hawaiian / Pacific Islander1,024 100.0% Other race1,212 74.8% Two or more races12,801 88.7% White alone, not Hispanic / Latino1,263 74.0% Hispanic or LatinoMoved within same county 417 2.9% White / Caucasian129 3.5% Black or African American32 2.1% Asian8 0.8% Other race110 6.8% Two or more races433 3.0% White alone, not Hispanic / Latino10 0.6% Hispanic or LatinoMoved within same state 1,035 7.1% White / Caucasian113 3.1% Black or African American8 14.7% American Indian / Alaska Native331 22.0% Asian8 0.8% Other race54 3.3% Two or more races894 6.2% White alone, not Hispanic / Latino164 9.6% Hispanic or LatinoMoved from different state 200 1.4% White / Caucasian1 0.0% Black or African American16 1.1% Asian266 16.4% Two or more races206 1.4% White alone, not Hispanic / Latino146 8.6% Hispanic or LatinoMoved from abroad 19 0.1% White92 2.5% Black or African American66 4.0% Two or more races19 0.1% White alone, not Hispanic / Latino100 5.9% Hispanic or Latino
Children Nativity (place of birth) in New Brighton
Children under 6 years - Living with two parents Both parents native 874 99.8% Native2 0.2% Foreign-bornBoth parents foreign-born 188 96.6% Native7 3.4% Foreign-bornOne native, one foreign-born parent 108 100.0% NativeChildren under 6 years - Living with one parent Native parent 225 100.0% NativeForeign-born parent 244 100.0% NativeChildren 6 to 17 years - Living with two parents Both parents native 1,999 100.0% NativeBoth parents foreign-born 174 54.6% Native145 45.4% Foreign-bornOne native, one foreign-born parent 277 100.0% NativeChildren 6 to 17 years - Living with one parent Native parent 503 100.0% NativeForeign-born parent 441 56.1% Native345 43.9% Foreign-born
Grandparents responsible for own grandchildren in New Brighton
Grandparents (30 to 59 years) Black or African American 4 100.0% Not responsible for grandchildren
Grandparents (60 years and over)