Races in New Bedford, Massachusetts (MA) Detailed Stats
Data:
Races - White alone (%)
Races - White alone (% change since 2000)
Races - Black alone (%)
Races - Black alone (% change since 2000)
Races - American Indian alone (%)
Races - American Indian alone (% change since 2000)
Races - Asian alone (%)
Races - Asian alone (% change since 2000)
Races - Hispanic (%)
Races - Hispanic (% change since 2000)
Races - Native Hawaiian and Other Pacific Islander alone (%)
Races - Native Hawaiian and Other Pacific Islander alone (% change since 2000)
Races - Two or more races(%)
Races - Two or more races(% change since 2000)
Races - Other race alone (%)
Races - Other race alone (% change since 2000)
Racial diversity
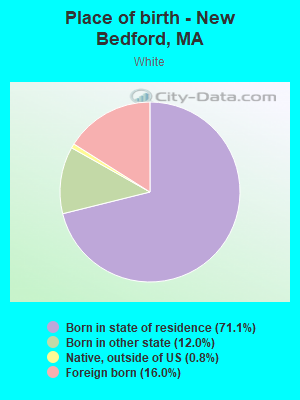
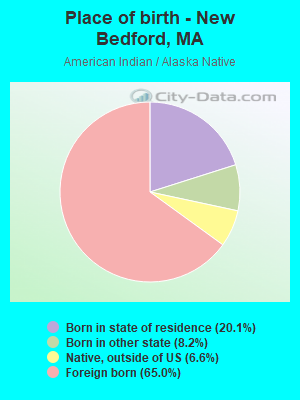
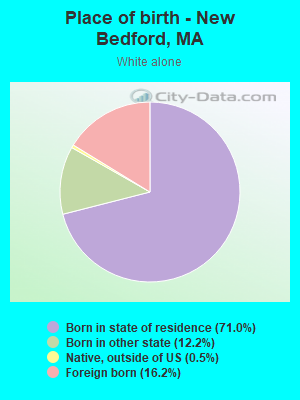
Place of birth - Born in state of residence (%)
Place of birth - Born in state of residence (%) - White
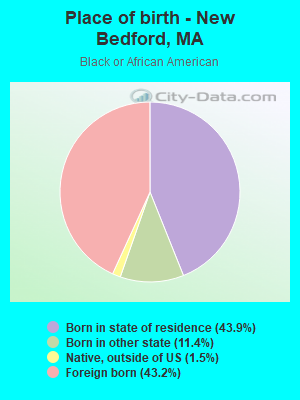
Place of birth - Born in state of residence (%) - Black or African American
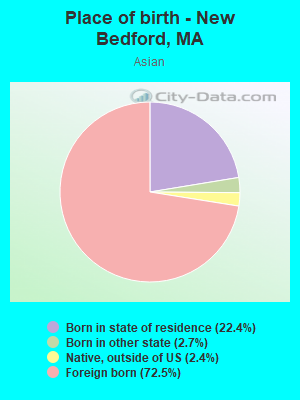
Place of birth - Born in state of residence (%) - Asian
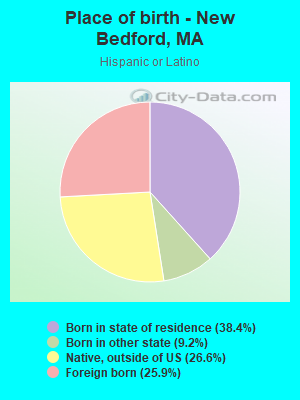
Place of birth - Born in state of residence (%) - Hispanic or Latino
Place of birth - Born in state of residence (%) - American Indian and Alaska Native
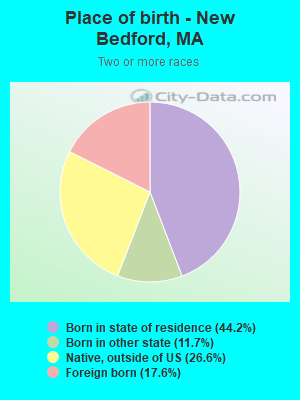
Place of birth - Born in state of residence (%) - Multirace
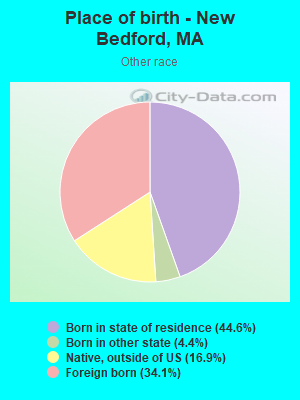
Place of birth - Born in state of residence (%) - Other Race
Place of birth - Born in other state (%)
Place of birth - Born in other state (%) - White
Place of birth - Born in other state (%) - Black or African American
Place of birth - Born in other state (%) - Asian
Place of birth - Born in other state (%) - Hispanic or Latino
Place of birth - Born in other state (%) - American Indian and Alaska Native
Place of birth - Born in other state (%) - Multirace
Place of birth - Born in other state (%) - Other Race
Place of birth - Native, outside of US (%)
Place of birth - Native, outside of US (%) - White
Place of birth - Native, outside of US (%) - Black or African American
Place of birth - Native, outside of US (%) - Asian
Place of birth - Native, outside of US (%) - Hispanic or Latino
Place of birth - Native, outside of US (%) - American Indian and Alaska Native
Place of birth - Native, outside of US (%) - Multirace
Place of birth - Native, outside of US (%) - Other Race
Place of birth - Foreign born (%)
Place of birth - Foreign born (%) - White
Place of birth - Foreign born (%) - Black or African American
Place of birth - Foreign born (%) - Asian
Place of birth - Foreign born (%) - Hispanic or Latino
Place of birth - Foreign born (%) - American Indian and Alaska Native
Place of birth - Foreign born (%) - Multirace
Place of birth - Foreign born (%) - Other Race
Residents speaking English at home (%)
Residents speaking English at home - Born in the United States (%)
Residents speaking English at home - Native, born elsewhere (%)
Residents speaking English at home - Foreign born (%)
Residents speaking Spanish at home (%)
Residents speaking Spanish at home - Born in the United States (%)
Residents speaking Spanish at home - Native, born elsewhere (%)
Residents speaking Spanish at home - Foreign born (%)
Residents speaking other language at home (%)
Residents speaking other language at home - Born in the United States (%)
Residents speaking other language at home - Native, born elsewhere (%)
Residents speaking other language at home - Foreign born (%)
Marital status - Never married (%)
Marital status - Now married (%)
Marital status - Separated (%)
Marital status - Widowed (%)
Marital status - Divorced (%)
Ancestries Reported - Arab (%)
Ancestries Reported - Czech (%)
Ancestries Reported - Danish (%)
Ancestries Reported - Dutch (%)
Ancestries Reported - English (%)
Ancestries Reported - French (%)
Ancestries Reported - French Canadian (%)
Ancestries Reported - German (%)
Ancestries Reported - Greek (%)
Ancestries Reported - Hungarian (%)
Ancestries Reported - Irish (%)
Ancestries Reported - Italian (%)
Ancestries Reported - Lithuanian (%)
Ancestries Reported - Norwegian (%)
Ancestries Reported - Polish (%)
Ancestries Reported - Portuguese (%)
Ancestries Reported - Russian (%)
Ancestries Reported - Scotch-Irish (%)
Ancestries Reported - Scottish (%)
Ancestries Reported - Slovak (%)
Ancestries Reported - Subsaharan African (%)
Ancestries Reported - Swedish (%)
Ancestries Reported - Swiss (%)
Ancestries Reported - Ukrainian (%)
Ancestries Reported - United States (%)
Ancestries Reported - Welsh (%)
Ancestries Reported - West Indian (%)
Ancestries Reported - Other (%)
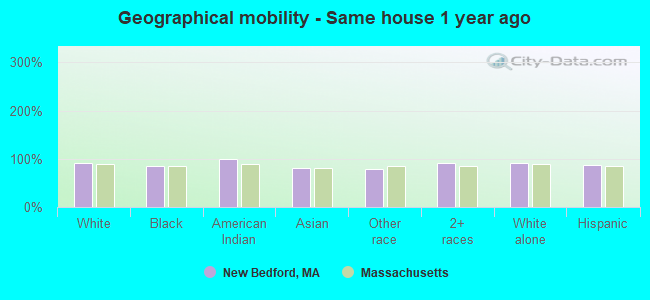
Geographical mobility - Same house 1 year ago (%)
Geographical mobility - Same house 1 year ago (%) - White
Geographical mobility - Same house 1 year ago (%) - Black or African American
Geographical mobility - Same house 1 year ago (%) - Asian
Geographical mobility - Same house 1 year ago (%) - Hispanic or Latino
Geographical mobility - Same house 1 year ago (%) - American Indian and Alaska Native
Geographical mobility - Same house 1 year ago (%) - Multirace
Geographical mobility - Same house 1 year ago (%) - Other Race
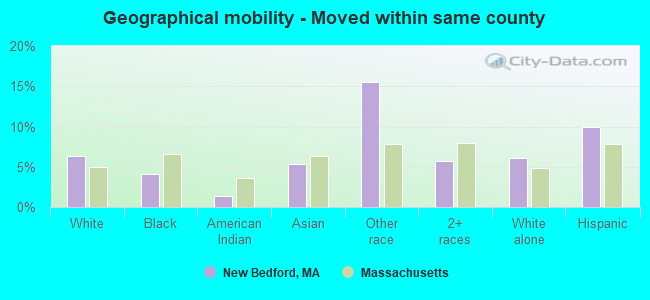
Geographical mobility - Moved within same county (%)
Geographical mobility - Moved within same county (%) - White
Geographical mobility - Moved within same county (%) - Black or African American
Geographical mobility - Moved within same county (%) - Asian
Geographical mobility - Moved within same county (%) - Hispanic or Latino
Geographical mobility - Moved within same county (%) - American Indian and Alaska Native
Geographical mobility - Moved within same county (%) - Multirace
Geographical mobility - Moved within same county (%) - Other Race
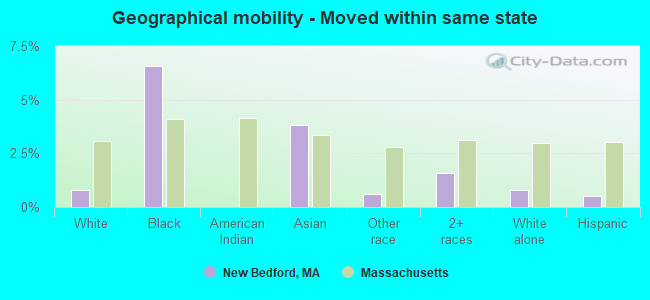
Geographical mobility - Moved from different county within same state (%)
Geographical mobility - Moved from different county within same state (%) - White
Geographical mobility - Moved from different county within same state (%) - Black or African American
Geographical mobility - Moved from different county within same state (%) - Asian
Geographical mobility - Moved from different county within same state (%) - Hispanic or Latino
Geographical mobility - Moved from different county within same state (%) - American Indian and Alaska Native
Geographical mobility - Moved from different county within same state (%) - Multirace
Geographical mobility - Moved from different county within same state (%) - Other Race
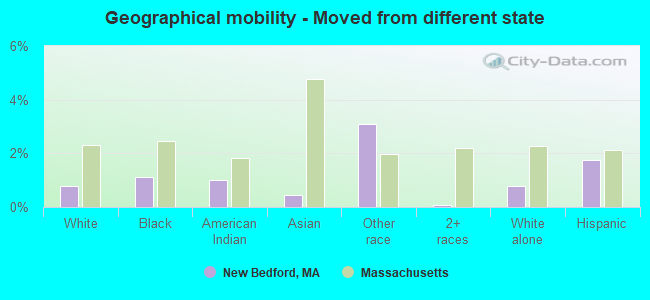
Geographical mobility - Moved from different state (%)
Geographical mobility - Moved from different state (%) - White
Geographical mobility - Moved from different state (%) - Black or African American
Geographical mobility - Moved from different state (%) - Asian
Geographical mobility - Moved from different state (%) - Hispanic or Latino
Geographical mobility - Moved from different state (%) - American Indian and Alaska Native
Geographical mobility - Moved from different state (%) - Multirace
Geographical mobility - Moved from different state (%) - Other Race
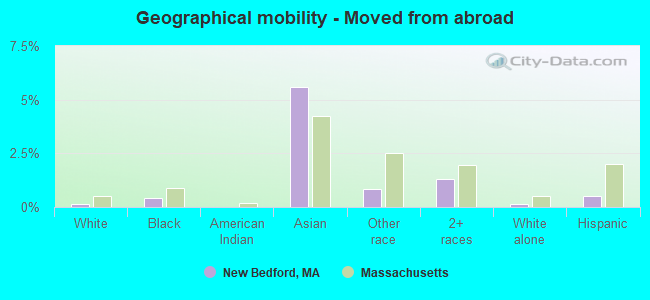
Geographical mobility - Moved from abroad (%)
Geographical mobility - Moved from abroad (%) - White
Geographical mobility - Moved from abroad (%) - Black or African American
Geographical mobility - Moved from abroad (%) - Asian
Geographical mobility - Moved from abroad (%) - Hispanic or Latino
Geographical mobility - Moved from abroad (%) - American Indian and Alaska Native
Geographical mobility - Moved from abroad (%) - Multirace
Geographical mobility - Moved from abroad (%) - Other Race
Place of birth for the foreign-born population - Ireland (%)
Place of birth for the foreign-born population - Denmark (%)
Place of birth for the foreign-born population - Norway (%)
Place of birth for the foreign-born population - Sweden (%)
Place of birth for the foreign-born population - United Kingdom (%)
Place of birth for the foreign-born population - England (%)
Place of birth for the foreign-born population - Scotland (%)
Place of birth for the foreign-born population - Other Northern Europe (%)
Place of birth for the foreign-born population - Austria (%)
Place of birth for the foreign-born population - Belgium (%)
Place of birth for the foreign-born population - France (%)
Place of birth for the foreign-born population - Germany (%)
Place of birth for the foreign-born population - Netherlands (%)
Place of birth for the foreign-born population - Switzerland (%)
Place of birth for the foreign-born population - Other Western Europe (%)
Place of birth for the foreign-born population - Greece (%)
Place of birth for the foreign-born population - Italy (%)
Place of birth for the foreign-born population - Portugal (%)
Place of birth for the foreign-born population - Spain (%)
Place of birth for the foreign-born population - Other Southern Europe (%)
Place of birth for the foreign-born population - Albania (%)
Place of birth for the foreign-born population - Belarus (%)
Place of birth for the foreign-born population - Bosnia and Herzegovina (%)
Place of birth for the foreign-born population - Bulgaria (%)
Place of birth for the foreign-born population - Croatia (%)
Place of birth for the foreign-born population - Czechoslovakia (%)
Place of birth for the foreign-born population - Hungary (%)
Place of birth for the foreign-born population - Latvia (%)
Place of birth for the foreign-born population - Lithuania (%)
Place of birth for the foreign-born population - North Macedonia (Macedonia) (%)
Place of birth for the foreign-born population - Moldova (%)
Place of birth for the foreign-born population - Poland (%)
Place of birth for the foreign-born population - Romania (%)
Place of birth for the foreign-born population - Russia (%)
Place of birth for the foreign-born population - Serbia (%)
Place of birth for the foreign-born population - Ukraine (%)
Place of birth for the foreign-born population - Other Eastern Europe (%)
Place of birth for the foreign-born population - China (%)
Place of birth for the foreign-born population - Hong Kong (%)
Place of birth for the foreign-born population - Taiwan (%)
Place of birth for the foreign-born population - Japan (%)
Place of birth for the foreign-born population - Korea (%)
Place of birth for the foreign-born population - Other Eastern Asia (%)
Place of birth for the foreign-born population - Afghanistan (%)
Place of birth for the foreign-born population - Bangladesh (%)
Place of birth for the foreign-born population - India (%)
Place of birth for the foreign-born population - Iran (%)
Place of birth for the foreign-born population - Kazakhstan (%)
Place of birth for the foreign-born population - Nepal (%)
Place of birth for the foreign-born population - Pakistan (%)
Place of birth for the foreign-born population - Sri Lanka (%)
Place of birth for the foreign-born population - Uzbekistan (%)
Place of birth for the foreign-born population - Other South Central Asia (%)
Place of birth for the foreign-born population - Burma (%)
Place of birth for the foreign-born population - Cambodia (%)
Place of birth for the foreign-born population - Indonesia (%)
Place of birth for the foreign-born population - Laos (%)
Place of birth for the foreign-born population - Malaysia (%)
Place of birth for the foreign-born population - Philippines (%)
Place of birth for the foreign-born population - Singapore (%)
Place of birth for the foreign-born population - Thailand (%)
Place of birth for the foreign-born population - Vietnam (%)
Place of birth for the foreign-born population - Other South Eastern Asia (%)
Place of birth for the foreign-born population - Armenia (%)
Place of birth for the foreign-born population - Iraq (%)
Place of birth for the foreign-born population - Israel (%)
Place of birth for the foreign-born population - Jordan (%)
Place of birth for the foreign-born population - Kuwait (%)
Place of birth for the foreign-born population - Lebanon (%)
Place of birth for the foreign-born population - Saudi Arabia (%)
Place of birth for the foreign-born population - Syria (%)
Place of birth for the foreign-born population - Turkey (%)
Place of birth for the foreign-born population - Yemen (%)
Place of birth for the foreign-born population - Other Western Asia (%)
Place of birth for the foreign-born population - Eritrea (%)
Place of birth for the foreign-born population - Ethiopia (%)
Place of birth for the foreign-born population - Kenya (%)
Place of birth for the foreign-born population - Somalia (%)
Place of birth for the foreign-born population - Uganda (%)
Place of birth for the foreign-born population - Zimbabwe (%)
Place of birth for the foreign-born population - Other Eastern Africa (%)
Place of birth for the foreign-born population - Cameroon (%)
Place of birth for the foreign-born population - Congo (%)
Place of birth for the foreign-born population - Democratic Republic of Congo (Zaire) (%)
Place of birth for the foreign-born population - Other Middle Africa (%)
Place of birth for the foreign-born population - Egypt (%)
Place of birth for the foreign-born population - Morocco (%)
Place of birth for the foreign-born population - Sudan (%)
Place of birth for the foreign-born population - Other Northern Africa (%)
Place of birth for the foreign-born population - South Africa (%)
Place of birth for the foreign-born population - Other Southern Africa (%)
Place of birth for the foreign-born population - Cabo Verde (%)
Place of birth for the foreign-born population - Ghana (%)
Place of birth for the foreign-born population - Liberia (%)
Place of birth for the foreign-born population - Nigeria (%)
Place of birth for the foreign-born population - Senegal (%)
Place of birth for the foreign-born population - Sierra Leone (%)
Place of birth for the foreign-born population - Other Western Africa (%)
Place of birth for the foreign-born population - Australia (%)
Place of birth for the foreign-born population - New Zealand (%)
Place of birth for the foreign-born population - Fiji (%)
Place of birth for the foreign-born population - Micronesia (%)
Place of birth for the foreign-born population - Bahamas (%)
Place of birth for the foreign-born population - Barbados (%)
Place of birth for the foreign-born population - Cuba (%)
Place of birth for the foreign-born population - Dominica (%)
Place of birth for the foreign-born population - Dominican Republic (%)
Place of birth for the foreign-born population - Grenada (%)
Place of birth for the foreign-born population - Haiti (%)
Place of birth for the foreign-born population - Jamaica (%)
Place of birth for the foreign-born population - St. Vincent and the Grenadines (%)
Place of birth for the foreign-born population - Trinidad and Tobago (%)
Place of birth for the foreign-born population - West Indies (%)
Place of birth for the foreign-born population - Other Caribbean (%)
Place of birth for the foreign-born population - Belize (%)
Place of birth for the foreign-born population - Costa Rica (%)
Place of birth for the foreign-born population - El Salvador (%)
Place of birth for the foreign-born population - Guatemala (%)
Place of birth for the foreign-born population - Honduras (%)
Place of birth for the foreign-born population - Mexico (%)
Place of birth for the foreign-born population - Nicaragua (%)
Place of birth for the foreign-born population - Panama (%)
Place of birth for the foreign-born population - Other Central America (%)
Place of birth for the foreign-born population - Argentina (%)
Place of birth for the foreign-born population - Bolivia (%)
Place of birth for the foreign-born population - Brazil (%)
Place of birth for the foreign-born population - Chile (%)
Place of birth for the foreign-born population - Colombia (%)
Place of birth for the foreign-born population - Ecuador (%)
Place of birth for the foreign-born population - Guyana (%)
Place of birth for the foreign-born population - Peru (%)
Place of birth for the foreign-born population - Uruguay (%)
Place of birth for the foreign-born population - Venezuela (%)
Place of birth for the foreign-born population - Other South America (%)
Place of birth for the foreign-born population - Canada (%)
Place of birth for the foreign-born population - Other Northern America (%)
Place of birth for the foreign-born population - Other (%)
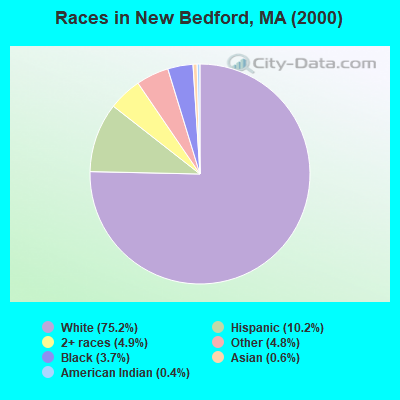
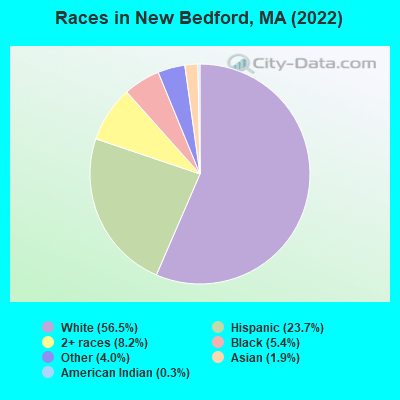
According to 2022 data, the most numerous races in New Bedford, MA are White alone (56,927 residents), Hispanic (23,902 residents), and Asian alone (1,938 residents). 62.0% of New Bedford residents speak English at home. 20.6% of New Bedford, MA residents are foreign-born (8.1% born in Europe, 7.4% born in Latin America, 3.5% born in Africa), which is 12.5% greater than the foreign-born rate of 18.0% across the entire state of Massachusetts.
Race distribution in New Bedford
2000 2022
70,520 75.2% White alone 9,576 10.2% Hispanic 4,638 4.9% Two or more races 4,503 4.8% Other race alone 3,503 3.7% Black alone 600 0.6% Asian alone 394 0.4% American Indian alone 34 0.04% Native Hawaiian and Other
56,927 56.5% White alone 23,902 23.7% Hispanic 8,231 8.2% Two or more races 5,424 5.4% Black alone 3,992 4.0% Other race alone 1,938 1.9% Asian alone 262 0.3% American Indian alone
2000 2022
5,198,359 81.9% White alone 428,729 6.8% Hispanic 318,329 5.0% Black alone 236,786 3.7% Asian alone 110,338 1.7% Two or more races 43,586 0.7% Other race alone 11,264 0.2% American Indian alone 1,706 0.03% Native Hawaiian and Other
4,676,627 67.0% White alone 911,038 13.0% Hispanic 501,463 7.2% Asian alone 459,740 6.6% Black alone 341,889 4.9% Two or more races 84,403 1.2% Other race alone 5,838 0.08% American Indian alone 976 0.01% Native Hawaiian and Other
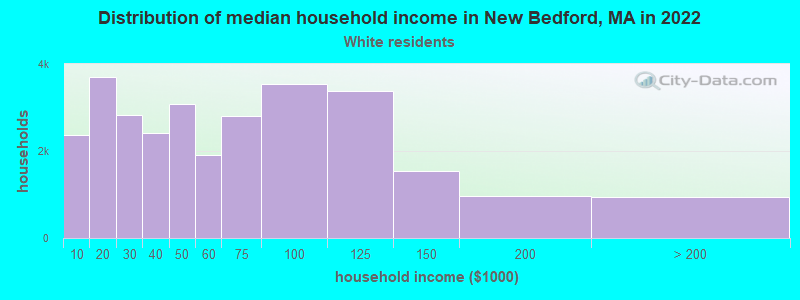
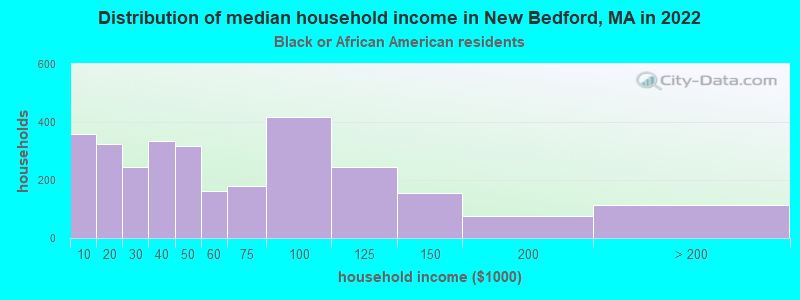
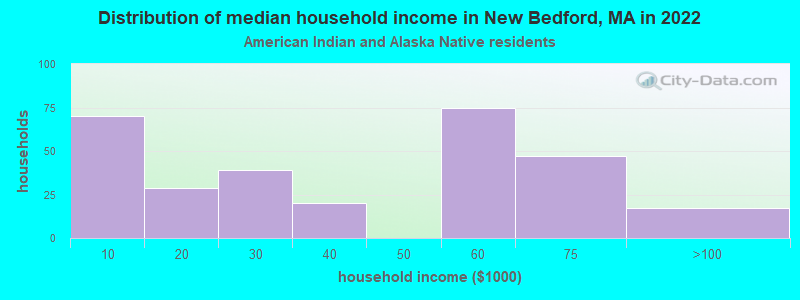
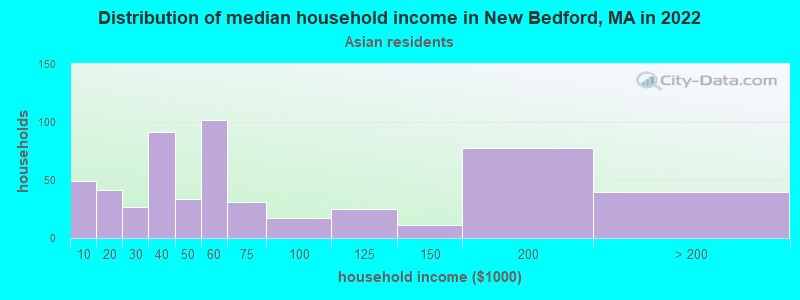
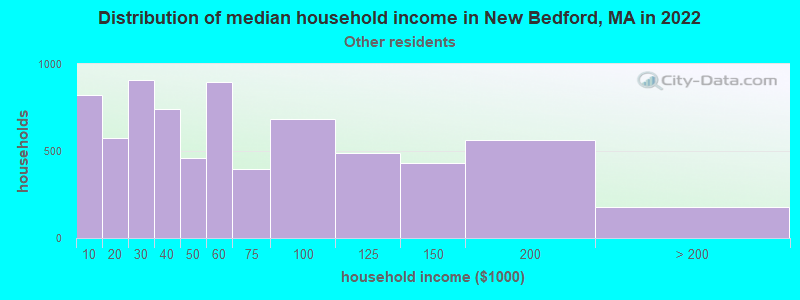
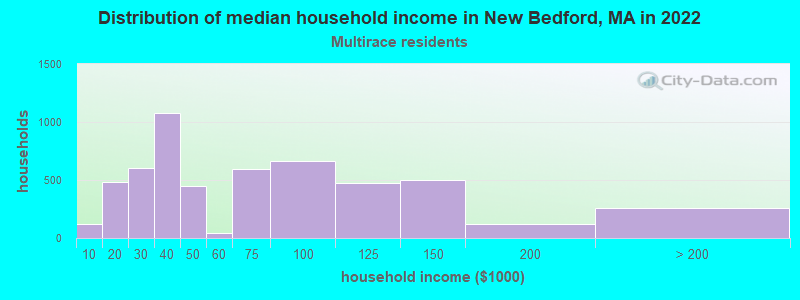
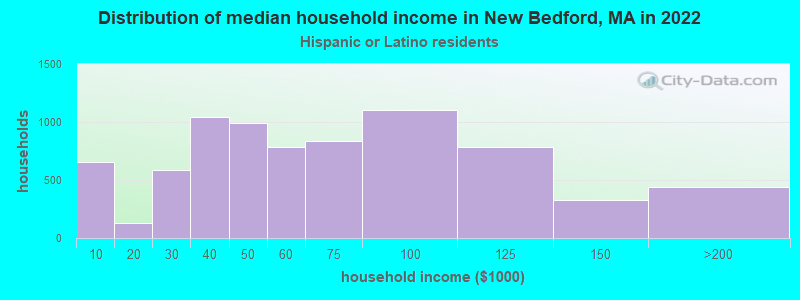
Income and house value in New Bedford Median household income in 2022 $53,212 White non-Hispanic householders$52,709 Black householders$37,951 American Indian and Alaska Native householders$101,968 Asian householders$53,112 Some other race householders$47,068 Two or more races householders$56,209 Hispanic or Latino race householdersMedian 2022 house value $338,685 White Non-Hispanic householders$311,352 Black or African American householders$264,412 American Indian or Alaska Native householders $341,953 Asian householders$817,004 Native Hawaiian and other Pacific Islander householders$296,795 Some other race householders$345,518 Two or more races householders$283,129 Hispanic or Latino householders
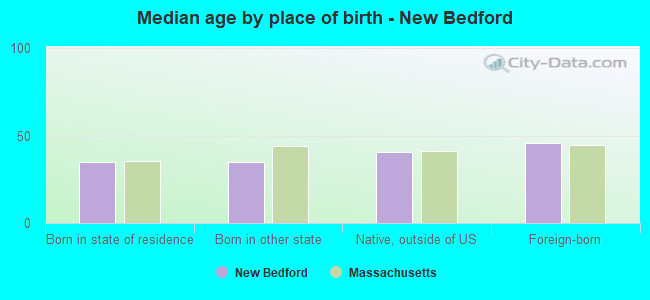
Median age by race in New Bedford
46.5 Median age for White residents45.3 49.2 29.1 Median age for Black or African American residents30.9 19.9 26.9 Median age for American Indian / Alaska Native residents29.0 17.5 32.9 Median age for Asian residents28.7 36.3 -666,666,666.0 Median age for Native Hawaiian / Pacific Islander residents-666,666,666.0 -666,666,666.0 27.4 Median age for Other race residents25.7 35.3 30.1 Median age for Two or more races residents30.9 29.4 46.8 Median age for White alone residents45.3 50.1 25.3 Median age for Hispanic or Latino residents25.8 24.5
Owner/renter occupied households by race in New Bedford
House owners and renters - White residents 13,267 45.0% Owner occupied16,209 55.0% Renter occupiedHouse owners and renters - Black or African American residents 711 31.1% Owner occupied1,574 68.9% Renter occupiedHouse owners and renters - American Indian / Alaska Native residents 81 26.7% Owner occupied222 73.3% Renter occupiedHouse owners and renters - Asian residents 282 61.2% Owner occupied179 38.8% Renter occupiedHouse owners and renters - Other race residents 1,269 20.4% Owner occupied4,952 79.6% Renter occupiedHouse owners and renters - Two or more races residents 1,638 30.3% Owner occupied3,760 69.7% Renter occupiedHouse owners and renters - White alone residents 13,162 45.3% Owner occupied15,910 54.7% Renter occupiedHouse owners and renters - Hispanic or Latino residents 1,852 24.1% Owner occupied5,832 75.9% Renter occupied
Language usage in New Bedford
English speakers - Total 62.0% of residents of New Bedford speak English at home.
16.7% of residents speak Spanish at home 10,355 65.1% Speak English very well5,562 34.9% Speak English less than very well21.4% of residents speak other language at home 12,658 62.0% Speak English very well7,748 38.0% Speak English less than very well
English speakers - Born in the United States 79.7% of residents of New Bedford speak English at home.
17.5% of residents speak Spanish at home 1,665 97.0% Speak English very well52 3.0% Speak English less than very well2.8% of residents speak other language at home 217 78.3% Speak English very well60 21.7% Speak English less than very well
English speakers - Native, born elsewhere 22.7% of residents of New Bedford speak English at home.
68.3% of residents speak Spanish at home 3,167 60.5% Speak English very well2,070 39.5% Speak English less than very well9.1% of residents speak other language at home 435 62.6% Speak English very well260 37.4% Speak English less than very well
English speakers - Foreign-born 16.2% of residents of New Bedford speak English at home.
20.7% of residents speak Spanish at home 1,499 32.4% Speak English very well3,128 67.6% Speak English less than very well63.0% of residents speak other language at home 6,945 49.4% Speak English very well7,122 50.6% Speak English less than very well
White (Caucasian) - Speak only English Native:
90.5% (42,186)Foreign-born:
25.5% (2,371)
White (Caucasian) - Speak another language Native:
9.5% (4,446)Foreign-born:
74.5% (6,914)
Black or African American - Speak only English Native:
86.8% (2,599)Foreign-born:
7.7% (186)
Black or African American - Speak another language Native:
13.2% (396)Foreign-born:
92.3% (2,241)
American Indian / Alaska Native - Speak only English Native:
28.6% (93)Foreign-born:
1.7% (10)
American Indian / Alaska Native - Speak another language Native:
89.5% (290)Foreign-born:
100.0% (579)
Asian - Speak only English Native:
74.2% (518)Foreign-born:
18.8% (216)
Asian - Speak another language Native:
25.8% (180)Foreign-born:
81.2% (933)
Other race - Speak only English Native:
44.6% (4,510)Foreign-born:
13.1% (758)
Other race - Speak another language Native:
55.4% (5,591)Foreign-born:
86.9% (5,032)
Two or more races - Speak only English Native:
46.1% (5,704)Foreign-born:
3.2% (91)
Two or more races - Speak another language Native:
53.9% (6,661)Foreign-born:
96.8% (2,791)
White alone - Speak only English Native:
90.6% (41,436)Foreign-born:
25.2% (2,335)
White alone - Speak another language Native:
9.4% (4,300)Foreign-born:
74.8% (6,914)
Hispanic or Latino - Speak only English Native:
30.1% (4,842)Foreign-born:
13.0% (794)
Hispanic or Latino - Speak another language Native:
69.9% (11,242)Foreign-born:
87.0% (5,317)
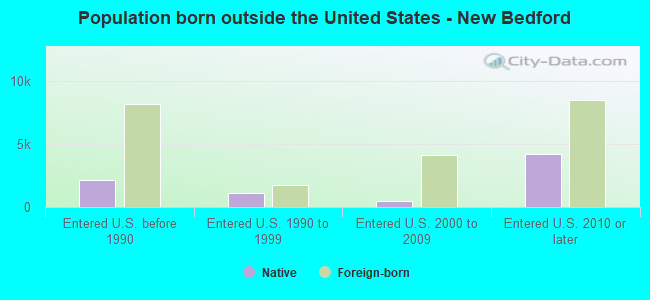
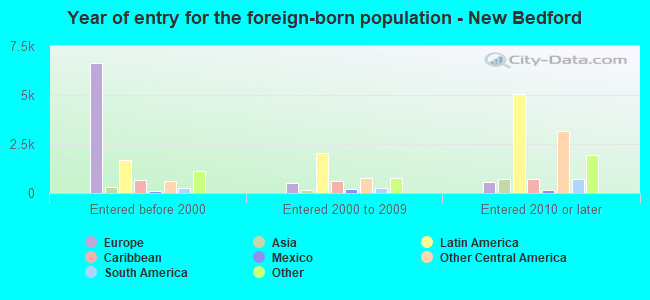
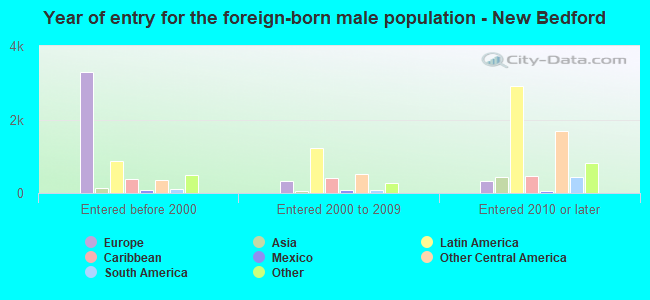
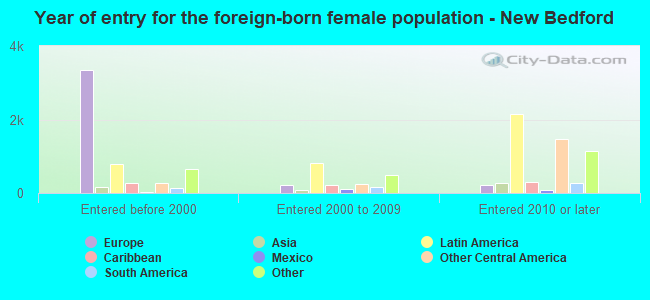
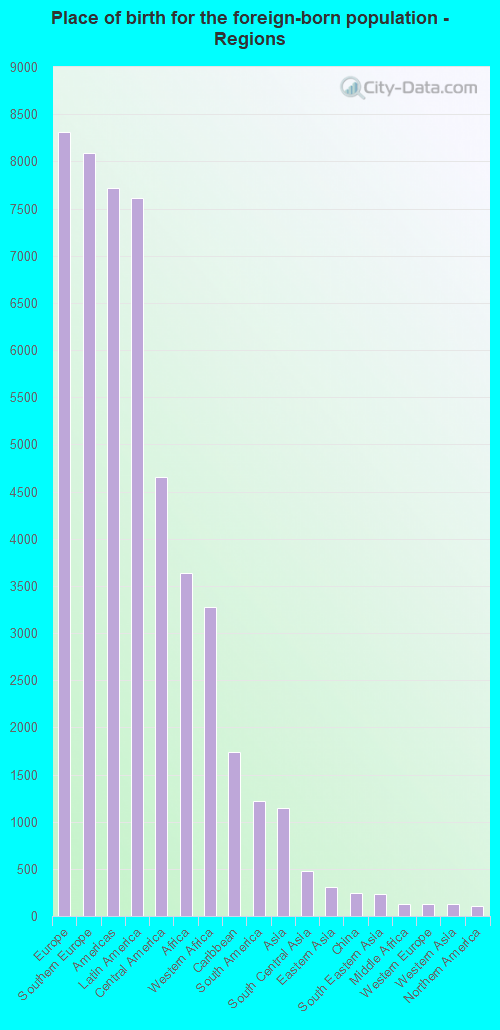
Foreign-born residents in New Bedford 20,819 residents are foreign born (8.1% Europe , 7.4% Latin America , 3.5% Africa ).
This city:
20.6%Massachusetts:
17.6%
Marital status for residents in New Bedford Marital status - White (Caucasian) population 15 years and over
Males 45.0% Never married34.9% Now married2.5% Separated1.8% Widowed15.8% DivorcedFemales 34.2% Never married34.0% Now married3.0% Separated14.5% Widowed14.4% DivorcedWomen who gave birth in the past 12 months Now married:
71.2% (592)Unmarried:
28.8% (239)
Women who did not give birth in the past 12 months Now married:
28.3% (3,362)Unmarried:
71.7% (8,519)
Marital status - Black or African American population 15 years and over
Males 52.8% Never married33.1% Now married1.4% Separated2.6% Widowed10.1% DivorcedFemales 45.5% Never married30.2% Now married11.0% Separated3.4% Widowed9.9% DivorcedWomen who gave birth in the past 12 months Now married:
25.9% (40)Unmarried:
74.1% (113)
Women who did not give birth in the past 12 months Now married:
32.6% (539)Unmarried:
67.4% (1,115)
Marital status - American Indian / Alaska Native population 15 years and over
Males 47.6% Never married34.1% Now married0.0% Separated10.0% Widowed8.3% DivorcedFemales 60.2% Never married17.8% Now married14.1% Separated4.2% Widowed3.7% DivorcedWomen who did not give birth in the past 12 months Now married:
30.1% (40)Unmarried:
69.9% (93)
Marital status - Asian population 15 years and over
Males 71.6% Never married24.5% Now married0.0% Separated0.0% Widowed3.9% DivorcedFemales 15.9% Never married75.6% Now married0.0% Separated3.6% Widowed5.0% DivorcedWomen who gave birth in the past 12 months Now married:
100.0% (5)Unmarried:
0.0% (0)
Women who did not give birth in the past 12 months Now married:
79.8% (326)Unmarried:
20.2% (83)
Marital status - Other race population 15 years and over
Males 49.9% Never married33.8% Now married3.4% Separated4.1% Widowed8.7% DivorcedFemales 52.5% Never married27.9% Now married6.5% Separated3.8% Widowed9.3% DivorcedWomen who gave birth in the past 12 months Now married:
45.0% (214)Unmarried:
55.0% (262)
Women who did not give birth in the past 12 months Now married:
21.8% (1,025)Unmarried:
78.2% (3,670)
Marital status - Two or more races population 15 years and over
Males 50.9% Never married28.3% Now married0.0% Separated0.0% Widowed20.9% DivorcedFemales 54.9% Never married29.8% Now married1.1% Separated3.1% Widowed11.0% DivorcedWomen who gave birth in the past 12 months Now married:
28.0% (113)Unmarried:
72.0% (291)
Women who did not give birth in the past 12 months Now married:
21.8% (888)Unmarried:
78.2% (3,190)
Marital status - White alone, not Hispanic / Latino population 15 years and over
Males 45.6% Never married34.8% Now married2.5% Separated1.8% Widowed15.4% DivorcedFemales 34.1% Never married33.6% Now married3.1% Separated14.6% Widowed14.5% DivorcedWomen who gave birth in the past 12 months Now married:
71.2% (592)Unmarried:
28.8% (239)
Women who did not give birth in the past 12 months Now married:
27.5% (3,185)Unmarried:
72.5% (8,415)
Marital status - Hispanic or Latino population 15 years and over
Males 52.8% Never married34.7% Now married4.1% Separated0.1% Widowed8.2% DivorcedFemales 62.7% Never married27.9% Now married0.0% Separated1.2% Widowed8.2% DivorcedWomen who gave birth in the past 12 months Now married:
10.7% (54)Unmarried:
89.3% (453)
Women who did not give birth in the past 12 months Now married:
19.1% (1,211)Unmarried:
80.9% (5,138)
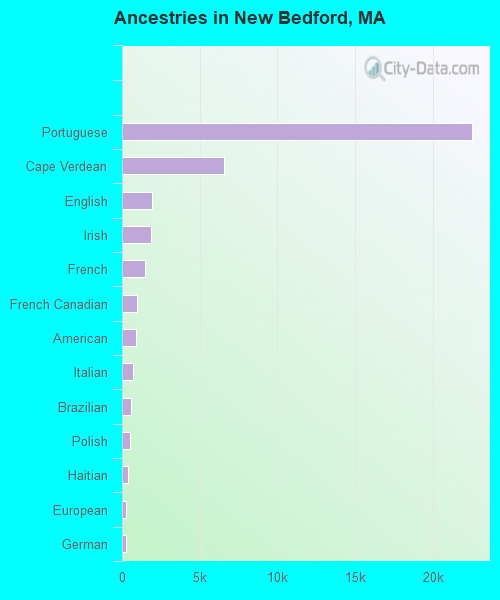
Ancestries in New Bedford
22,498 37.0% Portuguese6,566 10.8% Cape Verdean1,920 3.2% English1,884 3.1% Irish1,459 2.4% French996 1.6% French Canadian927 1.5% American740 1.2% Italian573 0.9% Brazilian539 0.9% Polish418 0.7% Haitian246 0.4% European238 0.4% German105 0.2% Canadian105 0.2% African101 0.2% Armenian100 0.2% Swedish98 0.2% Lebanese75 0.1% Jamaican72 0.1% Norwegian59 0.10% Egyptian58 0.10% South African58 0.10% Barbadian57 0.09% Scotch-Irish31 0.05% Scottish30 0.05% Nigerian30 0.05% Greek23 0.04% Eastern European20 0.03% Russian18 0.03% Jordanian16 0.03% Austrian15 0.02% West Indian14 0.02% Arab14 0.02% Scandinavian14 0.02% British West Indian13 0.02% Ethiopian12 0.02% Czech11 0.02% British10 0.02% Serbian8 0.01% Kenyan8 0.01% Lithuanian7 0.01% Danish7 0.01% Swiss7 0.01% Senegalese5 0.01% Ukrainian5 0.01% Bahamian
Geographical mobility in New Bedford Same house 1 year ago 52,566 91.9% White (Caucasian)6,151 85.1% Black or African American864 99.1% American Indian / Alaska Native1,140 81.6% Asian15,383 79.6% Other race14,468 90.5% Two or more races51,785 92.1% White alone, not Hispanic / Latino21,325 87.5% Hispanic or LatinoMoved within same county 3,646 6.4% White / Caucasian297 4.1% Black or African American12 1.4% American Indian / Alaska Native75 5.4% Asian2,999 15.5% Other race904 5.7% Two or more races3,451 6.1% White alone, not Hispanic / Latino2,436 10.0% Hispanic or LatinoMoved within same state 456 0.8% White / Caucasian475 6.6% Black or African American53 3.8% Asian121 0.6% Other race254 1.6% Two or more races456 0.8% White alone, not Hispanic / Latino126 0.5% Hispanic or LatinoMoved from different state 437 0.8% White / Caucasian82 1.1% Black or African American9 1.0% American Indian / Alaska Native6 0.4% Asian600 3.1% Other race13 0.1% Two or more races437 0.8% White alone, not Hispanic / Latino429 1.8% Hispanic or LatinoMoved from abroad 82 0.1% White29 0.4% Black or African American78 5.6% Asian166 0.9% Other race206 1.3% Two or more races82 0.1% White alone, not Hispanic / Latino122 0.5% Hispanic or Latino
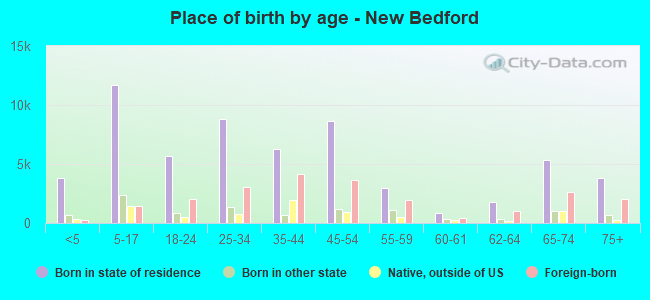
Children Nativity (place of birth) in New Bedford
Children under 6 years - Living with two parents Both parents native 1,149 100.0% NativeBoth parents foreign-born 635 72.8% Native237 27.2% Foreign-bornOne native, one foreign-born parent 177 100.0% NativeChildren under 6 years - Living with one parent Native parent 2,357 100.0% NativeForeign-born parent 1,008 100.0% NativeChildren 6 to 17 years - Living with two parents Both parents native 3,009 100.0% NativeBoth parents foreign-born 1,152 64.5% Native634 35.5% Foreign-bornOne native, one foreign-born parent 605 100.0% NativeChildren 6 to 17 years - Living with one parent Native parent 6,227 100.0% NativeForeign-born parent 2,340 54.2% Native1,977 45.8% Foreign-born
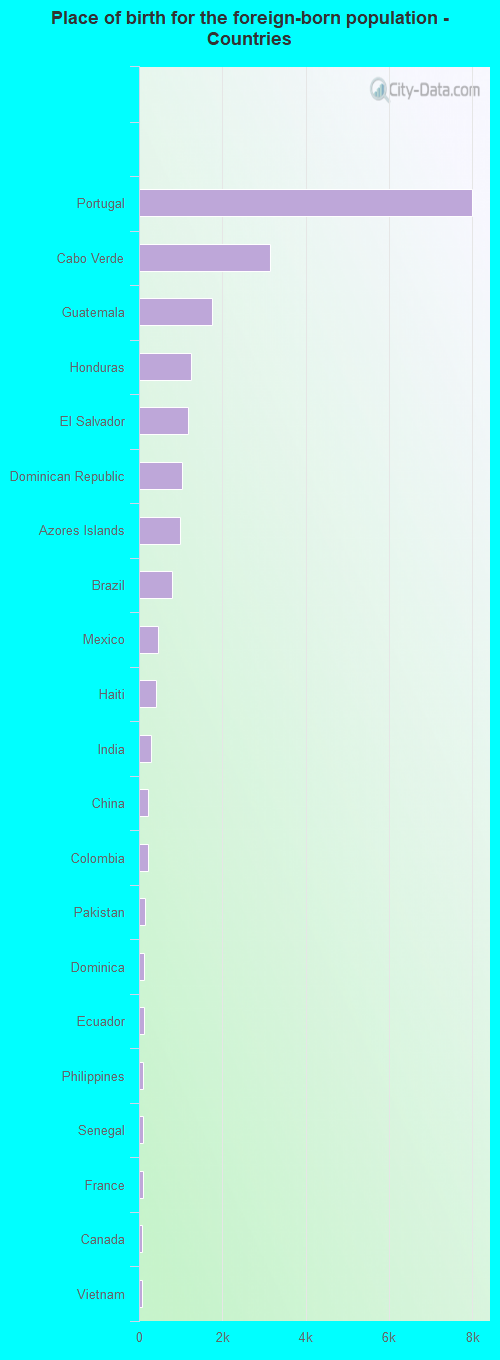
Place of birth for residents in New Bedford 8,314 Europe8,087 Southern Europe7,718 Americas7,610 Latin America4,652 Central America3,634 Africa3,273 Western Africa1,740 Caribbean1,217 South America1,143 Asia475 South Central Asia311 Eastern Asia247 China231 South Eastern Asia128 Middle Africa124 Western Europe124 Western Asia107 Northern America69 Northern Europe59 Northern Africa32 Eastern Europe31 Eastern Africa29 Southern Africa9 Oceania9 Australia and New Zealand Subregion8,007 Portugal3,135 Cabo Verde1,744 Guatemala1,241 Honduras1,179 El Salvador1,026 Dominican Republic973 Azores Islands783 Brazil461 Mexico397 Haiti292 India227 China222 Colombia143 Pakistan131 Dominica122 Ecuador98 Philippines91 Senegal86 France77 Canada74 Vietnam68 Jamaica64 Venezuela62 Cameroon52 Cambodia47 Armenia46 Italy43 Barbados40 Ivory Coast36 Trinidad and Tobago34 Lebanon33 Japan30 Korea29 Saudi Arabia29 South Africa26 Egypt25 Germany25 Spain24 Costa Rica23 Uruguay22 United Kingdom21 Bangladesh20 Grenada19 Hong Kong17 Iran17 Poland16 Cuba15 England14 Sweden13 Czechoslovakia12 Switzerland11 Zimbabwe10 Ireland9 Australia8 Greece7 Morocco7 Denmark6 Thailand6 Kenya6 Jordan6 Nigeria6 United Arab Emirates2 Democratic Republic of Congo (Zaire)2 Russia1 Peru
Grandparents responsible for own grandchildren in New Bedford
Grandparents (30 to 59 years) White / Caucasian 244 33.4% Responsible for grandchildren486 66.6% Not responsible for grandchildrenAsian 7 100.0% Responsible for grandchildrenOther race 75 11.5% Responsible for grandchildren576 88.5% Not responsible for grandchildrenTwo or more races 64 31.5% Responsible for grandchildren140 68.5% Not responsible for grandchildrenWhite alone, not Hispanic / Latino 244 33.4% Responsible for grandchildren486 66.6% Not responsible for grandchildrenHispanic or Latino 51 12.7% Responsible for grandchildren353 87.3% Not responsible for grandchildrenGrandparents (60 years and over) White / Caucasian 311 35.9% Responsible for grandchildren555 64.1% Not responsible for grandchildrenAsian 5 42.4% Responsible for grandchildren7 57.6% Not responsible for grandchildrenOther race 64 34.4% Responsible for grandchildren123 65.6% Not responsible for grandchildrenTwo or more races 275 61.5% Responsible for grandchildren172 38.5% Not responsible for grandchildrenWhite alone, not Hispanic / Latino 311 35.9% Responsible for grandchildren555 64.1% Not responsible for grandchildrenHispanic or Latino 191 69.9% Responsible for grandchildren82 30.1% Not responsible for grandchildren