Races in Nashville, Wisconsin (WI) Detailed Stats
Ancestries, Foreign-born residents, place of birth

Recent posts about races in Nashville, Wisconsin on our local forum with over 2,400,000 registered users:
 | Was it a mistake moving to Wisconsin? (63 replies) |
| Considering relocating to Madison from Nashville, Tn (21 replies) |
| Thinking of Moving to Southern WI (11 replies) |
| Do Wisconsin taxes affect your quality of life? (320 replies) |
| Studying Abroad in Milwaukee, Wisconsin... (British student) (43 replies) |
| Which NHL team has the most support in Wisconsin? (40 replies) |
Latest news about races in Nashville, WI collected exclusively by city-data.com from local newspapers, TV, and radio stations
1.9% of Nashville, WI residents are foreign-born , which is 163.0% less than the foreign-born rate of 5.0% across the entire state of Wisconsin.
Race distribution in Nashville

- 78467.8%White alone
- 36031.1%American Indian alone
- 80.7%Two or more races
- 40.3%Hispanic
- 10.09%Other race alone

2000
2022
-
- 4,681,63087.3%White alone
- 300,2455.6%Black alone
- 192,9213.6%Hispanic
- 87,9951.6%Asian alone
- 51,9211.0%Two or more races
- 43,9800.8%American Indian alone
- 3,6370.07%Other race alone
- 1,3460.03%Native Hawaiian and Other
Pacific Islander alone

-
- 4,654,03179.0%White alone
- 447,0227.6%Hispanic
- 345,6785.9%Black alone
- 217,5323.7%Two or more races
- 172,2422.9%Asian alone
- 33,7620.6%American Indian alone
- 19,6800.3%Other race alone
- 2,5920.04%Native Hawaiian and Other
Pacific Islander alone

Income and house value in Nashville
- Median household income in 2022
- $56,209White non-Hispanic householders
- $31,848American Indian and Alaska Native householders
- $112,684Asian householders
- $52,972Native Hawaiian and other Pacific Islander householders
- $13,295Some other race householders
- $20,421Two or more races householders
- $51,639Hispanic or Latino race householders
- Median 2022 house value
- $254,450White Non-Hispanic householders
- $201,038American Indian or Alaska Native householders
- $515,778Asian householders
Household income for White non-Hispanic householders

Household income for American Indian and Alaska Native householders

Household income for Asian householders

Household income for Native Hawaiian and other Pacific Islander householders

Household income for Two or more races householders

Household income for Hispanic or Latino race householders

Foreign-born residents in Nashville
22 residents are foreign born
| This city: | 1.9% |
| Wisconsin: | 3.6% |
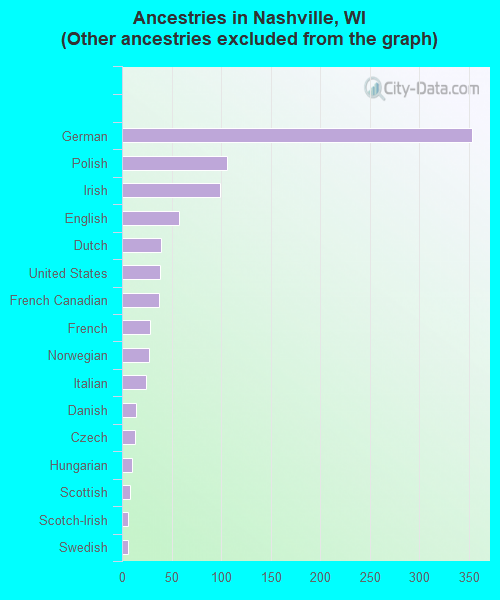
Ancestries in Nashville

- 42432.5%Other
- 35327.1%German
- 1068.1%Polish
- 997.6%Irish
- 584.5%English
- 393.0%Dutch
- 382.9%United States
- 372.8%French Canadian
- 282.1%French
- 272.1%Norwegian
- 241.8%Italian
- 141.1%Danish
- 131.0%Czech
- 100.8%Hungarian
- 80.6%Scottish
- 60.5%Scotch-Irish
- 60.5%Swedish
- 30.2%Lithuanian
- 30.2%Russian
- 30.2%Slovak
- 20.2%Swiss
- 20.2%Welsh
Zip codes: 54520.