Races in Naples Manor, Florida (FL) Detailed Stats
Data:
Races - White alone (%)
Races - White alone (% change since 2000)
Races - Black alone (%)
Races - Black alone (% change since 2000)
Races - American Indian alone (%)
Races - American Indian alone (% change since 2000)
Races - Asian alone (%)
Races - Asian alone (% change since 2000)
Races - Hispanic (%)
Races - Hispanic (% change since 2000)
Races - Native Hawaiian and Other Pacific Islander alone (%)
Races - Native Hawaiian and Other Pacific Islander alone (% change since 2000)
Races - Two or more races(%)
Races - Two or more races(% change since 2000)
Races - Other race alone (%)
Races - Other race alone (% change since 2000)
Racial diversity
Place of birth - Born in state of residence (%)
Place of birth - Born in state of residence (%) - White
Place of birth - Born in state of residence (%) - Black or African American
Place of birth - Born in state of residence (%) - Asian
Place of birth - Born in state of residence (%) - Hispanic or Latino
Place of birth - Born in state of residence (%) - American Indian and Alaska Native
Place of birth - Born in state of residence (%) - Multirace
Place of birth - Born in state of residence (%) - Other Race
Place of birth - Born in other state (%)
Place of birth - Born in other state (%) - White
Place of birth - Born in other state (%) - Black or African American
Place of birth - Born in other state (%) - Asian
Place of birth - Born in other state (%) - Hispanic or Latino
Place of birth - Born in other state (%) - American Indian and Alaska Native
Place of birth - Born in other state (%) - Multirace
Place of birth - Born in other state (%) - Other Race
Place of birth - Native, outside of US (%)
Place of birth - Native, outside of US (%) - White
Place of birth - Native, outside of US (%) - Black or African American
Place of birth - Native, outside of US (%) - Asian
Place of birth - Native, outside of US (%) - Hispanic or Latino
Place of birth - Native, outside of US (%) - American Indian and Alaska Native
Place of birth - Native, outside of US (%) - Multirace
Place of birth - Native, outside of US (%) - Other Race
Place of birth - Foreign born (%)
Place of birth - Foreign born (%) - White
Place of birth - Foreign born (%) - Black or African American
Place of birth - Foreign born (%) - Asian
Place of birth - Foreign born (%) - Hispanic or Latino
Place of birth - Foreign born (%) - American Indian and Alaska Native
Place of birth - Foreign born (%) - Multirace
Place of birth - Foreign born (%) - Other Race
Residents speaking English at home (%)
Residents speaking English at home - Born in the United States (%)
Residents speaking English at home - Native, born elsewhere (%)
Residents speaking English at home - Foreign born (%)
Residents speaking Spanish at home (%)
Residents speaking Spanish at home - Born in the United States (%)
Residents speaking Spanish at home - Native, born elsewhere (%)
Residents speaking Spanish at home - Foreign born (%)
Residents speaking other language at home (%)
Residents speaking other language at home - Born in the United States (%)
Residents speaking other language at home - Native, born elsewhere (%)
Residents speaking other language at home - Foreign born (%)
Marital status - Never married (%)
Marital status - Now married (%)
Marital status - Separated (%)
Marital status - Widowed (%)
Marital status - Divorced (%)
Ancestries Reported - Arab (%)
Ancestries Reported - Czech (%)
Ancestries Reported - Danish (%)
Ancestries Reported - Dutch (%)
Ancestries Reported - English (%)
Ancestries Reported - French (%)
Ancestries Reported - French Canadian (%)
Ancestries Reported - German (%)
Ancestries Reported - Greek (%)
Ancestries Reported - Hungarian (%)
Ancestries Reported - Irish (%)
Ancestries Reported - Italian (%)
Ancestries Reported - Lithuanian (%)
Ancestries Reported - Norwegian (%)
Ancestries Reported - Polish (%)
Ancestries Reported - Portuguese (%)
Ancestries Reported - Russian (%)
Ancestries Reported - Scotch-Irish (%)
Ancestries Reported - Scottish (%)
Ancestries Reported - Slovak (%)
Ancestries Reported - Subsaharan African (%)
Ancestries Reported - Swedish (%)
Ancestries Reported - Swiss (%)
Ancestries Reported - Ukrainian (%)
Ancestries Reported - United States (%)
Ancestries Reported - Welsh (%)
Ancestries Reported - West Indian (%)
Ancestries Reported - Other (%)
Geographical mobility - Same house 1 year ago (%)
Geographical mobility - Same house 1 year ago (%) - White
Geographical mobility - Same house 1 year ago (%) - Black or African American
Geographical mobility - Same house 1 year ago (%) - Asian
Geographical mobility - Same house 1 year ago (%) - Hispanic or Latino
Geographical mobility - Same house 1 year ago (%) - American Indian and Alaska Native
Geographical mobility - Same house 1 year ago (%) - Multirace
Geographical mobility - Same house 1 year ago (%) - Other Race
Geographical mobility - Moved within same county (%)
Geographical mobility - Moved within same county (%) - White
Geographical mobility - Moved within same county (%) - Black or African American
Geographical mobility - Moved within same county (%) - Asian
Geographical mobility - Moved within same county (%) - Hispanic or Latino
Geographical mobility - Moved within same county (%) - American Indian and Alaska Native
Geographical mobility - Moved within same county (%) - Multirace
Geographical mobility - Moved within same county (%) - Other Race
Geographical mobility - Moved from different county within same state (%)
Geographical mobility - Moved from different county within same state (%) - White
Geographical mobility - Moved from different county within same state (%) - Black or African American
Geographical mobility - Moved from different county within same state (%) - Asian
Geographical mobility - Moved from different county within same state (%) - Hispanic or Latino
Geographical mobility - Moved from different county within same state (%) - American Indian and Alaska Native
Geographical mobility - Moved from different county within same state (%) - Multirace
Geographical mobility - Moved from different county within same state (%) - Other Race
Geographical mobility - Moved from different state (%)
Geographical mobility - Moved from different state (%) - White
Geographical mobility - Moved from different state (%) - Black or African American
Geographical mobility - Moved from different state (%) - Asian
Geographical mobility - Moved from different state (%) - Hispanic or Latino
Geographical mobility - Moved from different state (%) - American Indian and Alaska Native
Geographical mobility - Moved from different state (%) - Multirace
Geographical mobility - Moved from different state (%) - Other Race
Geographical mobility - Moved from abroad (%)
Geographical mobility - Moved from abroad (%) - White
Geographical mobility - Moved from abroad (%) - Black or African American
Geographical mobility - Moved from abroad (%) - Asian
Geographical mobility - Moved from abroad (%) - Hispanic or Latino
Geographical mobility - Moved from abroad (%) - American Indian and Alaska Native
Geographical mobility - Moved from abroad (%) - Multirace
Geographical mobility - Moved from abroad (%) - Other Race
Place of birth for the foreign-born population - Ireland (%)
Place of birth for the foreign-born population - Denmark (%)
Place of birth for the foreign-born population - Norway (%)
Place of birth for the foreign-born population - Sweden (%)
Place of birth for the foreign-born population - United Kingdom (%)
Place of birth for the foreign-born population - England (%)
Place of birth for the foreign-born population - Scotland (%)
Place of birth for the foreign-born population - Other Northern Europe (%)
Place of birth for the foreign-born population - Austria (%)
Place of birth for the foreign-born population - Belgium (%)
Place of birth for the foreign-born population - France (%)
Place of birth for the foreign-born population - Germany (%)
Place of birth for the foreign-born population - Netherlands (%)
Place of birth for the foreign-born population - Switzerland (%)
Place of birth for the foreign-born population - Other Western Europe (%)
Place of birth for the foreign-born population - Greece (%)
Place of birth for the foreign-born population - Italy (%)
Place of birth for the foreign-born population - Portugal (%)
Place of birth for the foreign-born population - Spain (%)
Place of birth for the foreign-born population - Other Southern Europe (%)
Place of birth for the foreign-born population - Albania (%)
Place of birth for the foreign-born population - Belarus (%)
Place of birth for the foreign-born population - Bosnia and Herzegovina (%)
Place of birth for the foreign-born population - Bulgaria (%)
Place of birth for the foreign-born population - Croatia (%)
Place of birth for the foreign-born population - Czechoslovakia (%)
Place of birth for the foreign-born population - Hungary (%)
Place of birth for the foreign-born population - Latvia (%)
Place of birth for the foreign-born population - Lithuania (%)
Place of birth for the foreign-born population - North Macedonia (Macedonia) (%)
Place of birth for the foreign-born population - Moldova (%)
Place of birth for the foreign-born population - Poland (%)
Place of birth for the foreign-born population - Romania (%)
Place of birth for the foreign-born population - Russia (%)
Place of birth for the foreign-born population - Serbia (%)
Place of birth for the foreign-born population - Ukraine (%)
Place of birth for the foreign-born population - Other Eastern Europe (%)
Place of birth for the foreign-born population - China (%)
Place of birth for the foreign-born population - Hong Kong (%)
Place of birth for the foreign-born population - Taiwan (%)
Place of birth for the foreign-born population - Japan (%)
Place of birth for the foreign-born population - Korea (%)
Place of birth for the foreign-born population - Other Eastern Asia (%)
Place of birth for the foreign-born population - Afghanistan (%)
Place of birth for the foreign-born population - Bangladesh (%)
Place of birth for the foreign-born population - India (%)
Place of birth for the foreign-born population - Iran (%)
Place of birth for the foreign-born population - Kazakhstan (%)
Place of birth for the foreign-born population - Nepal (%)
Place of birth for the foreign-born population - Pakistan (%)
Place of birth for the foreign-born population - Sri Lanka (%)
Place of birth for the foreign-born population - Uzbekistan (%)
Place of birth for the foreign-born population - Other South Central Asia (%)
Place of birth for the foreign-born population - Burma (%)
Place of birth for the foreign-born population - Cambodia (%)
Place of birth for the foreign-born population - Indonesia (%)
Place of birth for the foreign-born population - Laos (%)
Place of birth for the foreign-born population - Malaysia (%)
Place of birth for the foreign-born population - Philippines (%)
Place of birth for the foreign-born population - Singapore (%)
Place of birth for the foreign-born population - Thailand (%)
Place of birth for the foreign-born population - Vietnam (%)
Place of birth for the foreign-born population - Other South Eastern Asia (%)
Place of birth for the foreign-born population - Armenia (%)
Place of birth for the foreign-born population - Iraq (%)
Place of birth for the foreign-born population - Israel (%)
Place of birth for the foreign-born population - Jordan (%)
Place of birth for the foreign-born population - Kuwait (%)
Place of birth for the foreign-born population - Lebanon (%)
Place of birth for the foreign-born population - Saudi Arabia (%)
Place of birth for the foreign-born population - Syria (%)
Place of birth for the foreign-born population - Turkey (%)
Place of birth for the foreign-born population - Yemen (%)
Place of birth for the foreign-born population - Other Western Asia (%)
Place of birth for the foreign-born population - Eritrea (%)
Place of birth for the foreign-born population - Ethiopia (%)
Place of birth for the foreign-born population - Kenya (%)
Place of birth for the foreign-born population - Somalia (%)
Place of birth for the foreign-born population - Uganda (%)
Place of birth for the foreign-born population - Zimbabwe (%)
Place of birth for the foreign-born population - Other Eastern Africa (%)
Place of birth for the foreign-born population - Cameroon (%)
Place of birth for the foreign-born population - Congo (%)
Place of birth for the foreign-born population - Democratic Republic of Congo (Zaire) (%)
Place of birth for the foreign-born population - Other Middle Africa (%)
Place of birth for the foreign-born population - Egypt (%)
Place of birth for the foreign-born population - Morocco (%)
Place of birth for the foreign-born population - Sudan (%)
Place of birth for the foreign-born population - Other Northern Africa (%)
Place of birth for the foreign-born population - South Africa (%)
Place of birth for the foreign-born population - Other Southern Africa (%)
Place of birth for the foreign-born population - Cabo Verde (%)
Place of birth for the foreign-born population - Ghana (%)
Place of birth for the foreign-born population - Liberia (%)
Place of birth for the foreign-born population - Nigeria (%)
Place of birth for the foreign-born population - Senegal (%)
Place of birth for the foreign-born population - Sierra Leone (%)
Place of birth for the foreign-born population - Other Western Africa (%)
Place of birth for the foreign-born population - Australia (%)
Place of birth for the foreign-born population - New Zealand (%)
Place of birth for the foreign-born population - Fiji (%)
Place of birth for the foreign-born population - Micronesia (%)
Place of birth for the foreign-born population - Bahamas (%)
Place of birth for the foreign-born population - Barbados (%)
Place of birth for the foreign-born population - Cuba (%)
Place of birth for the foreign-born population - Dominica (%)
Place of birth for the foreign-born population - Dominican Republic (%)
Place of birth for the foreign-born population - Grenada (%)
Place of birth for the foreign-born population - Haiti (%)
Place of birth for the foreign-born population - Jamaica (%)
Place of birth for the foreign-born population - St. Vincent and the Grenadines (%)
Place of birth for the foreign-born population - Trinidad and Tobago (%)
Place of birth for the foreign-born population - West Indies (%)
Place of birth for the foreign-born population - Other Caribbean (%)
Place of birth for the foreign-born population - Belize (%)
Place of birth for the foreign-born population - Costa Rica (%)
Place of birth for the foreign-born population - El Salvador (%)
Place of birth for the foreign-born population - Guatemala (%)
Place of birth for the foreign-born population - Honduras (%)
Place of birth for the foreign-born population - Mexico (%)
Place of birth for the foreign-born population - Nicaragua (%)
Place of birth for the foreign-born population - Panama (%)
Place of birth for the foreign-born population - Other Central America (%)
Place of birth for the foreign-born population - Argentina (%)
Place of birth for the foreign-born population - Bolivia (%)
Place of birth for the foreign-born population - Brazil (%)
Place of birth for the foreign-born population - Chile (%)
Place of birth for the foreign-born population - Colombia (%)
Place of birth for the foreign-born population - Ecuador (%)
Place of birth for the foreign-born population - Guyana (%)
Place of birth for the foreign-born population - Peru (%)
Place of birth for the foreign-born population - Uruguay (%)
Place of birth for the foreign-born population - Venezuela (%)
Place of birth for the foreign-born population - Other South America (%)
Place of birth for the foreign-born population - Canada (%)
Place of birth for the foreign-born population - Other Northern America (%)
Place of birth for the foreign-born population - Other (%)
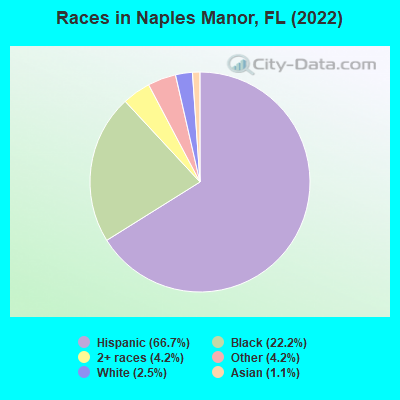
According to 2022 data, the most numerous races in Naples Manor, FL are White alone (151 residents), Hispanic (4,105 residents), and Black alone (1,364 residents). 10.9% of Naples Manor residents speak English at home. 47.8% of Naples Manor, FL residents are foreign-born (43.2% born in Latin America), which is 56.1% greater than the foreign-born rate of 21.0% across the entire state of Florida.
Race distribution in Naples Manor
2000 2022
10,458,509 65.4% White alone 2,682,715 16.8% Hispanic 2,264,268 14.2% Black alone 261,693 1.6% Asian alone 236,954 1.5% Two or more races 42,358 0.3% American Indian alone 28,994 0.2% Other race alone 6,887 0.04% Native Hawaiian and Other
11,309,403 50.8% White alone 6,025,039 27.1% Hispanic 3,241,015 14.6% Black alone 861,630 3.9% Two or more races 623,692 2.8% Asian alone 152,054 0.7% Other race alone 22,504 0.1% American Indian alone 9,486 0.04% Native Hawaiian and Other
Income and house value in Naples Manor Median household income in 2022 $55,707 Two or more races householders$53,449 Hispanic or Latino race householdersMedian 2022 house value $363,510 White Non-Hispanic householders$380,951 Black or African American householders$516,349 American Indian or Alaska Native householders$392,884 Some other race householders$286,860 Two or more races householders$386,458 Hispanic or Latino householders
Median age by race in Naples Manor
40.6 Median age for White residents26.0 50.4 35.2 Median age for Black or African American residents29.8 57.8 19.8 Median age for American Indian / Alaska Native residents18.5 33.9 41.9 Median age for Asian residents-700,515,083.9 41.9 -679,849,340.2 Median age for Native Hawaiian / Pacific Islander residents-858,307,848.3 -666,666,666.0 27.2 Median age for Other race residents25.8 30.5 13.7 Median age for Two or more races residents13.1 20.5 23.0 Median age for White alone residents-671,999,999.3 45.7 28.3 Median age for Hispanic or Latino residents25.5 31.3
Owner/renter occupied households by race in Naples Manor
House owners and renters - White residents 359 77.3% Owner occupied106 22.7% Renter occupiedHouse owners and renters - Black or African American residents 115 100.0% Owner occupiedHouse owners and renters - American Indian / Alaska Native residents 40 100.0% Owner occupiedHouse owners and renters - Asian residents 18 100.0% Renter occupiedHouse owners and renters - Other race residents 190 55.1% Owner occupied155 44.9% Renter occupiedHouse owners and renters - Two or more races residents 446 69.7% Owner occupied193 30.3% Renter occupiedHouse owners and renters - White alone residents 43 67.8% Owner occupied20 32.2% Renter occupiedHouse owners and renters - Hispanic or Latino residents 748 65.1% Owner occupied402 34.9% Renter occupied
Language usage in Naples Manor
English speakers - Total 10.9% of residents of Naples Manor speak English at home.
60.7% of residents speak Spanish at home 1,372 41.1% Speak English very well1,964 58.9% Speak English less than very well29.7% of residents speak other language at home 1,249 76.5% Speak English very well383 23.5% Speak English less than very well
English speakers - Born in the United States 60.2% of residents of Naples Manor speak English at home.
38.8% of residents speak Spanish at home 188 100.0% Speak English very well
English speakers - Native, born elsewhere 0.0% of residents of Naples Manor speak English at home.
83.2% of residents speak Spanish at home 99 100.0% Speak English very well33.6% of residents speak other language at home 40 100.0% Speak English less than very well
English speakers - Foreign-born 5.4% of residents of Naples Manor speak English at home.
77.6% of residents speak Spanish at home 303 13.7% Speak English very well1,909 86.3% Speak English less than very well20.8% of residents speak other language at home 241 40.6% Speak English very well353 59.4% Speak English less than very well
White (Caucasian) - Speak only English Native:
18.2% (159)Foreign-born:
5.4% (33)
White (Caucasian) - Speak another language Native:
51.9% (455)Foreign-born:
77.3% (482)
Black or African American - Speak another language Native:
92.0% (856)Foreign-born:
100.0% (505)
American Indian / Alaska Native - Speak another language Native:
100.0% (156)Foreign-born:
100.0% (119)
Asian - Speak another language Native:
100.0% (31)Foreign-born:
63.8% (26)
Other race - Speak only English Native:
31.8% (64)Foreign-born:
19.3% (149)
Other race - Speak another language Native:
68.2% (138)Foreign-born:
83.3% (644)
Two or more races - Speak another language Native:
49.4% (309)Foreign-born:
100.0% (551)
Hispanic or Latino - Speak only English Native:
20.3% (290)Foreign-born:
2.9% (61)
Hispanic or Latino - Speak another language Native:
79.1% (1,132)Foreign-born:
96.7% (2,012)
Foreign-born residents in Naples Manor 2,943 residents are foreign born (43.2% Latin America ).
This city:
47.8%Florida:
21.1%
Marital status for residents in Naples Manor Marital status - White (Caucasian) population 15 years and over
Males 46.4% Never married46.8% Now married0.0% Separated0.0% Widowed6.8% DivorcedFemales 18.0% Never married57.7% Now married0.0% Separated15.2% Widowed9.1% DivorcedWomen who gave birth in the past 12 months Now married:
100.0% (39)Unmarried:
0.0% (0)
Women who did not give birth in the past 12 months Now married:
71.0% (195)Unmarried:
29.0% (80)
Marital status - Black or African American population 15 years and over
Males 84.5% Never married0.0% Now married0.0% Separated0.0% Widowed15.5% DivorcedFemales 23.5% Never married23.5% Now married0.0% Separated52.9% Widowed0.0% DivorcedWomen who did not give birth in the past 12 months Now married:
35.0% (76)Unmarried:
65.0% (142)
Marital status - American Indian / Alaska Native population 15 years and over
Males 34.5% Never married27.4% Now married0.0% Separated0.0% Widowed38.1% DivorcedFemales 38.7% Never married61.3% Now married0.0% Separated0.0% Widowed0.0% DivorcedWomen who did not give birth in the past 12 months Now married:
61.3% (31)Unmarried:
38.7% (20)
Marital status - Asian population 15 years and over
Males 0.0% Never married100.0% Now married0.0% Separated0.0% Widowed0.0% DivorcedFemales 36.2% Never married38.3% Now married0.0% Separated0.0% Widowed25.5% DivorcedWomen who did not give birth in the past 12 months Now married:
38.3% (19)Unmarried:
61.7% (30)
Marital status - Other race population 15 years and over
Males 51.9% Never married48.1% Now married0.0% Separated0.0% Widowed0.0% DivorcedFemales 0.0% Never married90.2% Now married9.8% Separated0.0% Widowed0.0% DivorcedWomen who gave birth in the past 12 months Now married:
100.0% (37)Unmarried:
0.0% (0)
Women who did not give birth in the past 12 months Now married:
100.0% (358)Unmarried:
0.0% (0)
Marital status - Two or more races population 15 years and over
Males 46.6% Never married17.3% Now married0.0% Separated36.1% Widowed0.0% DivorcedFemales 89.2% Never married10.8% Now married0.0% Separated0.0% Widowed0.0% DivorcedWomen who did not give birth in the past 12 months Now married:
10.8% (49)Unmarried:
89.2% (406)
Marital status - White alone, not Hispanic / Latino population 15 years and over
Males 0.0% Never married100.0% Now married0.0% Separated0.0% Widowed0.0% DivorcedFemales 47.9% Never married21.4% Now married0.0% Separated0.0% Widowed30.8% DivorcedWomen who did not give birth in the past 12 months Now married:
27.3% (21)Unmarried:
72.7% (56)
Marital status - Hispanic or Latino population 15 years and over
Males 49.0% Never married44.6% Now married0.0% Separated0.0% Widowed6.4% DivorcedFemales 27.5% Never married58.8% Now married2.9% Separated8.6% Widowed2.2% DivorcedWomen who gave birth in the past 12 months Now married:
100.0% (50)Unmarried:
0.0% (0)
Women who did not give birth in the past 12 months Now married:
65.9% (628)Unmarried:
34.1% (324)
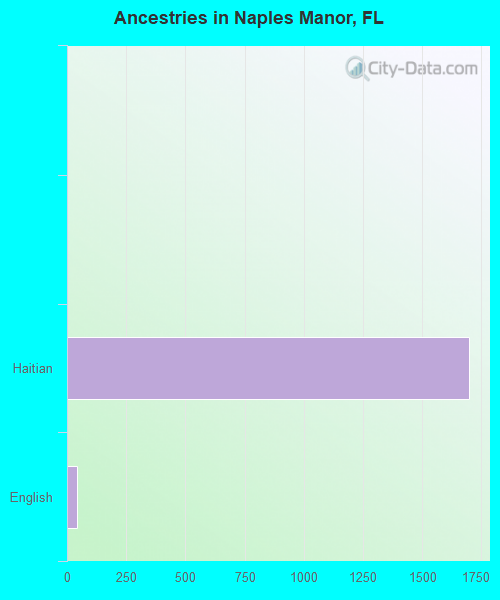
Ancestries in Naples Manor
1,698 33.7% Haitian43 0.9% English7 0.1% American
Children Nativity (place of birth) in Naples Manor
Children under 6 years - Living with two parents Both parents native 90 83.9% Native17 16.1% Foreign-bornBoth parents foreign-born 115 100.0% NativeOne native, one foreign-born parent 148 80.8% Native35 19.2% Foreign-bornChildren under 6 years - Living with one parent Foreign-born parent 329 100.0% NativeChildren 6 to 17 years - Living with two parents Both parents native 57 100.0% NativeBoth parents foreign-born 221 93.3% Native16 6.7% Foreign-bornOne native, one foreign-born parent 177 100.0% NativeChildren 6 to 17 years - Living with one parent Foreign-born parent 318 52.6% Native286 47.4% Foreign-born
Grandparents responsible for own grandchildren in Naples Manor
Grandparents (30 to 59 years) White / Caucasian 13 20.3% Responsible for grandchildren50 79.7% Not responsible for grandchildrenAmerican Indian / Alaska Native 51 100.0% Not responsible for grandchildrenOther race 160 100.0% Not responsible for grandchildrenWhite alone, not Hispanic / Latino 15 100.0% Responsible for grandchildrenHispanic or Latino 108 100.0% Not responsible for grandchildren
Grandparents (60 years and over) White / Caucasian 55 100.0% Not responsible for grandchildrenHispanic or Latino 43 100.0% Not responsible for grandchildren