Races in Napili-Honokowai, Hawaii (HI) Detailed Stats
Data:
Races - White alone (%)
Races - White alone (% change since 2000)
Races - Black alone (%)
Races - Black alone (% change since 2000)
Races - American Indian alone (%)
Races - American Indian alone (% change since 2000)
Races - Asian alone (%)
Races - Asian alone (% change since 2000)
Races - Hispanic (%)
Races - Hispanic (% change since 2000)
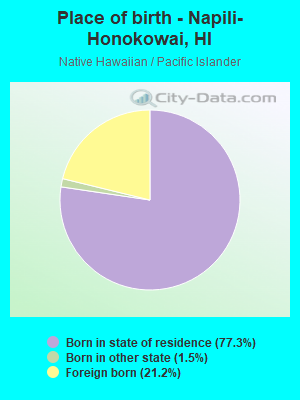
Races - Native Hawaiian and Other Pacific Islander alone (%)
Races - Native Hawaiian and Other Pacific Islander alone (% change since 2000)
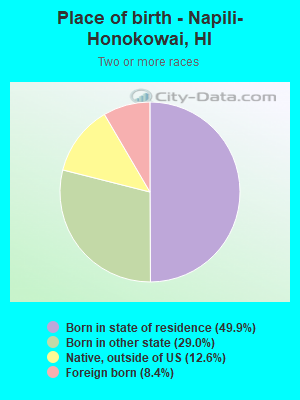
Races - Two or more races(%)
Races - Two or more races(% change since 2000)
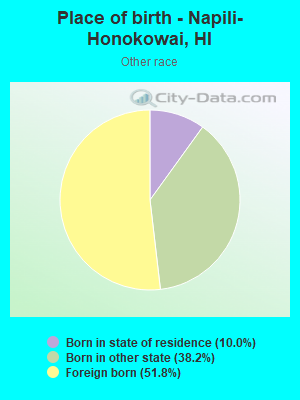
Races - Other race alone (%)
Races - Other race alone (% change since 2000)
Racial diversity
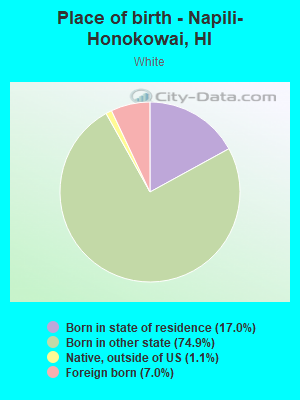
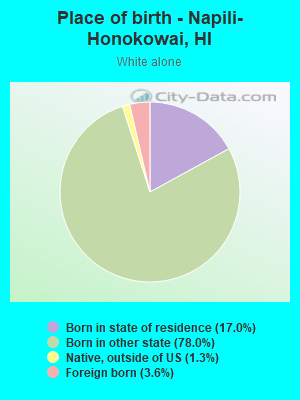
Place of birth - Born in state of residence (%)
Place of birth - Born in state of residence (%) - White
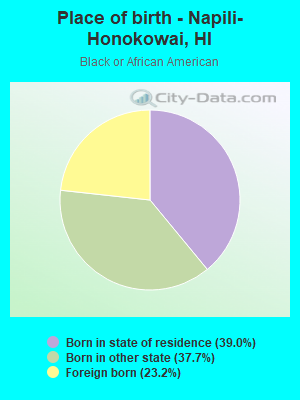
Place of birth - Born in state of residence (%) - Black or African American
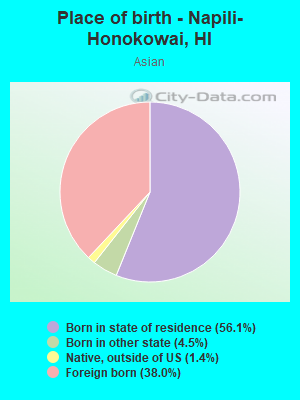
Place of birth - Born in state of residence (%) - Asian
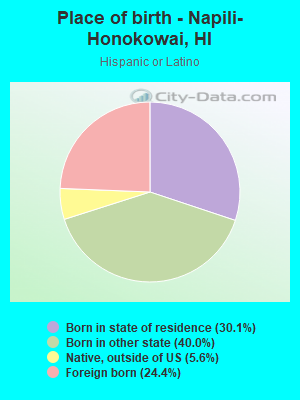
Place of birth - Born in state of residence (%) - Hispanic or Latino
Place of birth - Born in state of residence (%) - American Indian and Alaska Native
Place of birth - Born in state of residence (%) - Multirace
Place of birth - Born in state of residence (%) - Other Race
Place of birth - Born in other state (%)
Place of birth - Born in other state (%) - White
Place of birth - Born in other state (%) - Black or African American
Place of birth - Born in other state (%) - Asian
Place of birth - Born in other state (%) - Hispanic or Latino
Place of birth - Born in other state (%) - American Indian and Alaska Native
Place of birth - Born in other state (%) - Multirace
Place of birth - Born in other state (%) - Other Race
Place of birth - Native, outside of US (%)
Place of birth - Native, outside of US (%) - White
Place of birth - Native, outside of US (%) - Black or African American
Place of birth - Native, outside of US (%) - Asian
Place of birth - Native, outside of US (%) - Hispanic or Latino
Place of birth - Native, outside of US (%) - American Indian and Alaska Native
Place of birth - Native, outside of US (%) - Multirace
Place of birth - Native, outside of US (%) - Other Race
Place of birth - Foreign born (%)
Place of birth - Foreign born (%) - White
Place of birth - Foreign born (%) - Black or African American
Place of birth - Foreign born (%) - Asian
Place of birth - Foreign born (%) - Hispanic or Latino
Place of birth - Foreign born (%) - American Indian and Alaska Native
Place of birth - Foreign born (%) - Multirace
Place of birth - Foreign born (%) - Other Race
Residents speaking English at home (%)
Residents speaking English at home - Born in the United States (%)
Residents speaking English at home - Native, born elsewhere (%)
Residents speaking English at home - Foreign born (%)
Residents speaking Spanish at home (%)
Residents speaking Spanish at home - Born in the United States (%)
Residents speaking Spanish at home - Native, born elsewhere (%)
Residents speaking Spanish at home - Foreign born (%)
Residents speaking other language at home (%)
Residents speaking other language at home - Born in the United States (%)
Residents speaking other language at home - Native, born elsewhere (%)
Residents speaking other language at home - Foreign born (%)
Marital status - Never married (%)
Marital status - Now married (%)
Marital status - Separated (%)
Marital status - Widowed (%)
Marital status - Divorced (%)
Ancestries Reported - Arab (%)
Ancestries Reported - Czech (%)
Ancestries Reported - Danish (%)
Ancestries Reported - Dutch (%)
Ancestries Reported - English (%)
Ancestries Reported - French (%)
Ancestries Reported - French Canadian (%)
Ancestries Reported - German (%)
Ancestries Reported - Greek (%)
Ancestries Reported - Hungarian (%)
Ancestries Reported - Irish (%)
Ancestries Reported - Italian (%)
Ancestries Reported - Lithuanian (%)
Ancestries Reported - Norwegian (%)
Ancestries Reported - Polish (%)
Ancestries Reported - Portuguese (%)
Ancestries Reported - Russian (%)
Ancestries Reported - Scotch-Irish (%)
Ancestries Reported - Scottish (%)
Ancestries Reported - Slovak (%)
Ancestries Reported - Subsaharan African (%)
Ancestries Reported - Swedish (%)
Ancestries Reported - Swiss (%)
Ancestries Reported - Ukrainian (%)
Ancestries Reported - United States (%)
Ancestries Reported - Welsh (%)
Ancestries Reported - West Indian (%)
Ancestries Reported - Other (%)
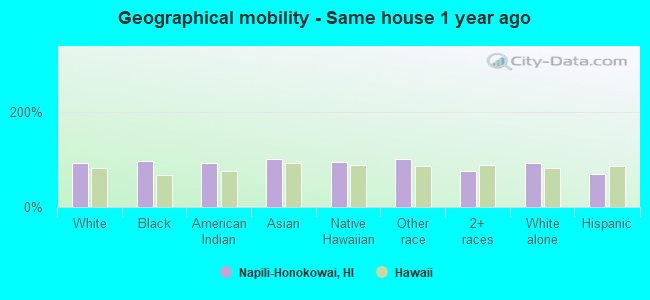
Geographical mobility - Same house 1 year ago (%)
Geographical mobility - Same house 1 year ago (%) - White
Geographical mobility - Same house 1 year ago (%) - Black or African American
Geographical mobility - Same house 1 year ago (%) - Asian
Geographical mobility - Same house 1 year ago (%) - Hispanic or Latino
Geographical mobility - Same house 1 year ago (%) - American Indian and Alaska Native
Geographical mobility - Same house 1 year ago (%) - Multirace
Geographical mobility - Same house 1 year ago (%) - Other Race
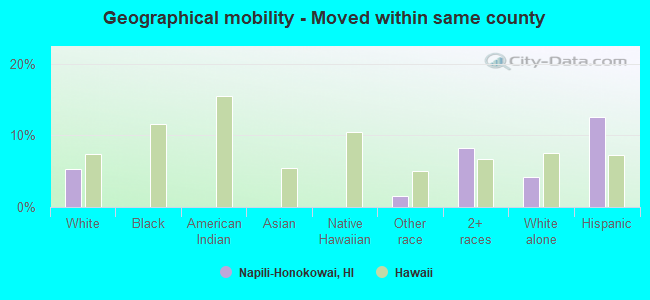
Geographical mobility - Moved within same county (%)
Geographical mobility - Moved within same county (%) - White
Geographical mobility - Moved within same county (%) - Black or African American
Geographical mobility - Moved within same county (%) - Asian
Geographical mobility - Moved within same county (%) - Hispanic or Latino
Geographical mobility - Moved within same county (%) - American Indian and Alaska Native
Geographical mobility - Moved within same county (%) - Multirace
Geographical mobility - Moved within same county (%) - Other Race
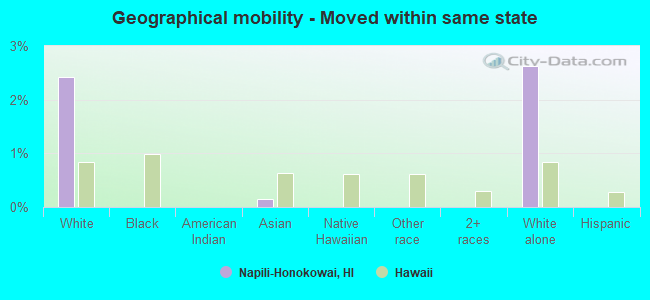
Geographical mobility - Moved from different county within same state (%)
Geographical mobility - Moved from different county within same state (%) - White
Geographical mobility - Moved from different county within same state (%) - Black or African American
Geographical mobility - Moved from different county within same state (%) - Asian
Geographical mobility - Moved from different county within same state (%) - Hispanic or Latino
Geographical mobility - Moved from different county within same state (%) - American Indian and Alaska Native
Geographical mobility - Moved from different county within same state (%) - Multirace
Geographical mobility - Moved from different county within same state (%) - Other Race
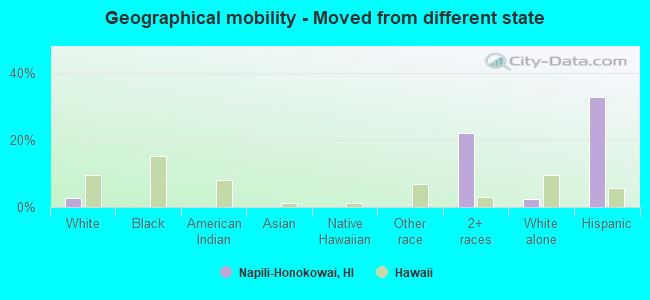
Geographical mobility - Moved from different state (%)
Geographical mobility - Moved from different state (%) - White
Geographical mobility - Moved from different state (%) - Black or African American
Geographical mobility - Moved from different state (%) - Asian
Geographical mobility - Moved from different state (%) - Hispanic or Latino
Geographical mobility - Moved from different state (%) - American Indian and Alaska Native
Geographical mobility - Moved from different state (%) - Multirace
Geographical mobility - Moved from different state (%) - Other Race
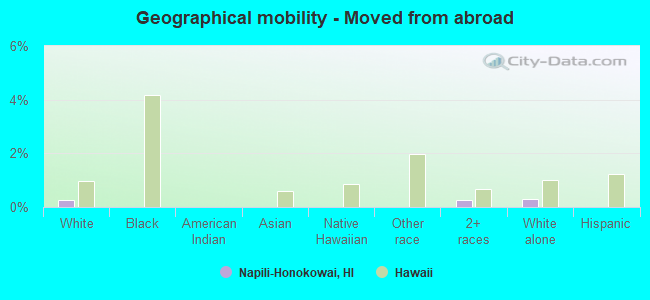
Geographical mobility - Moved from abroad (%)
Geographical mobility - Moved from abroad (%) - White
Geographical mobility - Moved from abroad (%) - Black or African American
Geographical mobility - Moved from abroad (%) - Asian
Geographical mobility - Moved from abroad (%) - Hispanic or Latino
Geographical mobility - Moved from abroad (%) - American Indian and Alaska Native
Geographical mobility - Moved from abroad (%) - Multirace
Geographical mobility - Moved from abroad (%) - Other Race
Place of birth for the foreign-born population - Ireland (%)
Place of birth for the foreign-born population - Denmark (%)
Place of birth for the foreign-born population - Norway (%)
Place of birth for the foreign-born population - Sweden (%)
Place of birth for the foreign-born population - United Kingdom (%)
Place of birth for the foreign-born population - England (%)
Place of birth for the foreign-born population - Scotland (%)
Place of birth for the foreign-born population - Other Northern Europe (%)
Place of birth for the foreign-born population - Austria (%)
Place of birth for the foreign-born population - Belgium (%)
Place of birth for the foreign-born population - France (%)
Place of birth for the foreign-born population - Germany (%)
Place of birth for the foreign-born population - Netherlands (%)
Place of birth for the foreign-born population - Switzerland (%)
Place of birth for the foreign-born population - Other Western Europe (%)
Place of birth for the foreign-born population - Greece (%)
Place of birth for the foreign-born population - Italy (%)
Place of birth for the foreign-born population - Portugal (%)
Place of birth for the foreign-born population - Spain (%)
Place of birth for the foreign-born population - Other Southern Europe (%)
Place of birth for the foreign-born population - Albania (%)
Place of birth for the foreign-born population - Belarus (%)
Place of birth for the foreign-born population - Bosnia and Herzegovina (%)
Place of birth for the foreign-born population - Bulgaria (%)
Place of birth for the foreign-born population - Croatia (%)
Place of birth for the foreign-born population - Czechoslovakia (%)
Place of birth for the foreign-born population - Hungary (%)
Place of birth for the foreign-born population - Latvia (%)
Place of birth for the foreign-born population - Lithuania (%)
Place of birth for the foreign-born population - North Macedonia (Macedonia) (%)
Place of birth for the foreign-born population - Moldova (%)
Place of birth for the foreign-born population - Poland (%)
Place of birth for the foreign-born population - Romania (%)
Place of birth for the foreign-born population - Russia (%)
Place of birth for the foreign-born population - Serbia (%)
Place of birth for the foreign-born population - Ukraine (%)
Place of birth for the foreign-born population - Other Eastern Europe (%)
Place of birth for the foreign-born population - China (%)
Place of birth for the foreign-born population - Hong Kong (%)
Place of birth for the foreign-born population - Taiwan (%)
Place of birth for the foreign-born population - Japan (%)
Place of birth for the foreign-born population - Korea (%)
Place of birth for the foreign-born population - Other Eastern Asia (%)
Place of birth for the foreign-born population - Afghanistan (%)
Place of birth for the foreign-born population - Bangladesh (%)
Place of birth for the foreign-born population - India (%)
Place of birth for the foreign-born population - Iran (%)
Place of birth for the foreign-born population - Kazakhstan (%)
Place of birth for the foreign-born population - Nepal (%)
Place of birth for the foreign-born population - Pakistan (%)
Place of birth for the foreign-born population - Sri Lanka (%)
Place of birth for the foreign-born population - Uzbekistan (%)
Place of birth for the foreign-born population - Other South Central Asia (%)
Place of birth for the foreign-born population - Burma (%)
Place of birth for the foreign-born population - Cambodia (%)
Place of birth for the foreign-born population - Indonesia (%)
Place of birth for the foreign-born population - Laos (%)
Place of birth for the foreign-born population - Malaysia (%)
Place of birth for the foreign-born population - Philippines (%)
Place of birth for the foreign-born population - Singapore (%)
Place of birth for the foreign-born population - Thailand (%)
Place of birth for the foreign-born population - Vietnam (%)
Place of birth for the foreign-born population - Other South Eastern Asia (%)
Place of birth for the foreign-born population - Armenia (%)
Place of birth for the foreign-born population - Iraq (%)
Place of birth for the foreign-born population - Israel (%)
Place of birth for the foreign-born population - Jordan (%)
Place of birth for the foreign-born population - Kuwait (%)
Place of birth for the foreign-born population - Lebanon (%)
Place of birth for the foreign-born population - Saudi Arabia (%)
Place of birth for the foreign-born population - Syria (%)
Place of birth for the foreign-born population - Turkey (%)
Place of birth for the foreign-born population - Yemen (%)
Place of birth for the foreign-born population - Other Western Asia (%)
Place of birth for the foreign-born population - Eritrea (%)
Place of birth for the foreign-born population - Ethiopia (%)
Place of birth for the foreign-born population - Kenya (%)
Place of birth for the foreign-born population - Somalia (%)
Place of birth for the foreign-born population - Uganda (%)
Place of birth for the foreign-born population - Zimbabwe (%)
Place of birth for the foreign-born population - Other Eastern Africa (%)
Place of birth for the foreign-born population - Cameroon (%)
Place of birth for the foreign-born population - Congo (%)
Place of birth for the foreign-born population - Democratic Republic of Congo (Zaire) (%)
Place of birth for the foreign-born population - Other Middle Africa (%)
Place of birth for the foreign-born population - Egypt (%)
Place of birth for the foreign-born population - Morocco (%)
Place of birth for the foreign-born population - Sudan (%)
Place of birth for the foreign-born population - Other Northern Africa (%)
Place of birth for the foreign-born population - South Africa (%)
Place of birth for the foreign-born population - Other Southern Africa (%)
Place of birth for the foreign-born population - Cabo Verde (%)
Place of birth for the foreign-born population - Ghana (%)
Place of birth for the foreign-born population - Liberia (%)
Place of birth for the foreign-born population - Nigeria (%)
Place of birth for the foreign-born population - Senegal (%)
Place of birth for the foreign-born population - Sierra Leone (%)
Place of birth for the foreign-born population - Other Western Africa (%)
Place of birth for the foreign-born population - Australia (%)
Place of birth for the foreign-born population - New Zealand (%)
Place of birth for the foreign-born population - Fiji (%)
Place of birth for the foreign-born population - Micronesia (%)
Place of birth for the foreign-born population - Bahamas (%)
Place of birth for the foreign-born population - Barbados (%)
Place of birth for the foreign-born population - Cuba (%)
Place of birth for the foreign-born population - Dominica (%)
Place of birth for the foreign-born population - Dominican Republic (%)
Place of birth for the foreign-born population - Grenada (%)
Place of birth for the foreign-born population - Haiti (%)
Place of birth for the foreign-born population - Jamaica (%)
Place of birth for the foreign-born population - St. Vincent and the Grenadines (%)
Place of birth for the foreign-born population - Trinidad and Tobago (%)
Place of birth for the foreign-born population - West Indies (%)
Place of birth for the foreign-born population - Other Caribbean (%)
Place of birth for the foreign-born population - Belize (%)
Place of birth for the foreign-born population - Costa Rica (%)
Place of birth for the foreign-born population - El Salvador (%)
Place of birth for the foreign-born population - Guatemala (%)
Place of birth for the foreign-born population - Honduras (%)
Place of birth for the foreign-born population - Mexico (%)
Place of birth for the foreign-born population - Nicaragua (%)
Place of birth for the foreign-born population - Panama (%)
Place of birth for the foreign-born population - Other Central America (%)
Place of birth for the foreign-born population - Argentina (%)
Place of birth for the foreign-born population - Bolivia (%)
Place of birth for the foreign-born population - Brazil (%)
Place of birth for the foreign-born population - Chile (%)
Place of birth for the foreign-born population - Colombia (%)
Place of birth for the foreign-born population - Ecuador (%)
Place of birth for the foreign-born population - Guyana (%)
Place of birth for the foreign-born population - Peru (%)
Place of birth for the foreign-born population - Uruguay (%)
Place of birth for the foreign-born population - Venezuela (%)
Place of birth for the foreign-born population - Other South America (%)
Place of birth for the foreign-born population - Canada (%)
Place of birth for the foreign-born population - Other Northern America (%)
Place of birth for the foreign-born population - Other (%)
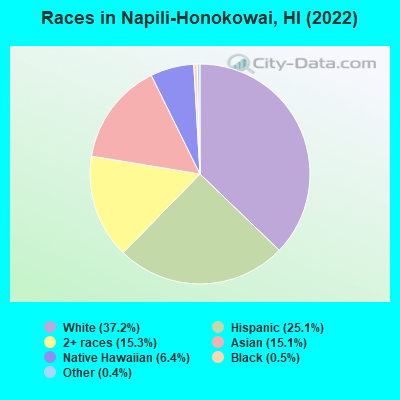
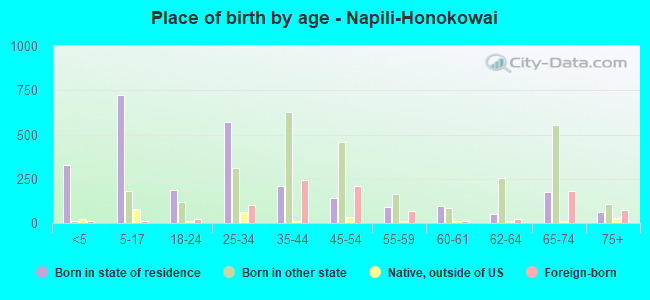
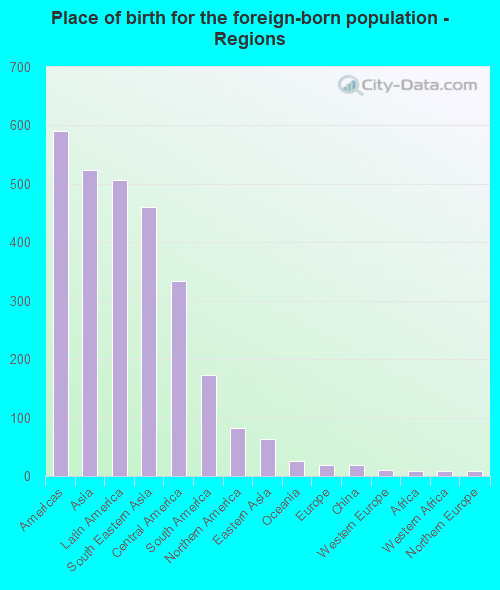
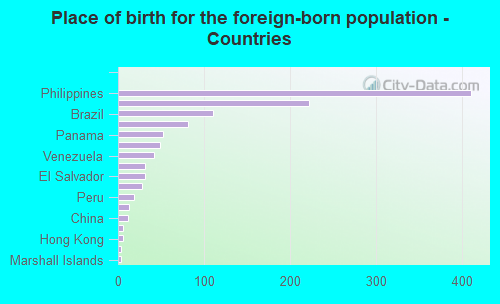
According to 2022 data, the most numerous races in Napili-Honokowai, HI are Asian alone (1,019 residents), Two or more races (1,037 residents), and White alone (2,515 residents). 83.5% of Napili-Honokowai residents speak English at home. 17.3% of Napili-Honokowai, HI residents are foreign-born (7.6% born in Asia, 7.3% born in Latin America), which is 4.3% less than the foreign-born rate of 18.0% across the entire state of Hawaii.
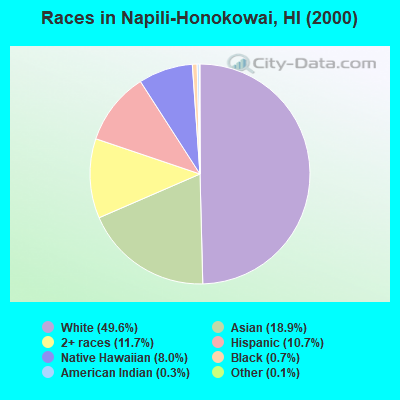
Race distribution in Napili-Honokowai
2000 2022
494,149 40.8% Asian alone 277,091 22.9% White alone 218,700 18.1% Two or more races 108,441 9.0% Native Hawaiian and Other 87,699 7.2% Hispanic 20,829 1.7% Black alone 2,089 0.2% Other race alone 2,539 0.2% American Indian alone
498,125 34.6% Asian alone 318,574 22.1% Two or more races 297,937 20.7% White alone 160,103 11.1% Hispanic 134,567 9.3% Native Hawaiian and Other 23,682 1.6% Black alone 5,378 0.4% Other race alone 1,830 0.1% American Indian alone
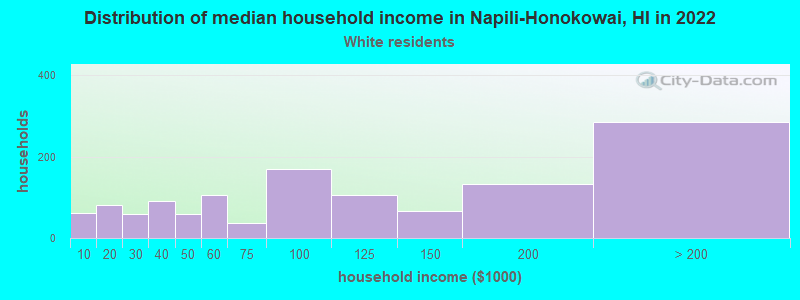
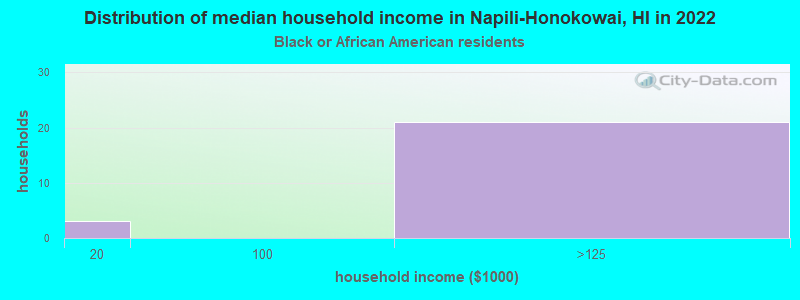
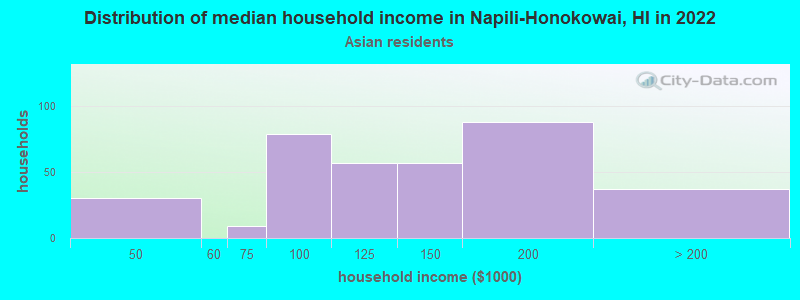
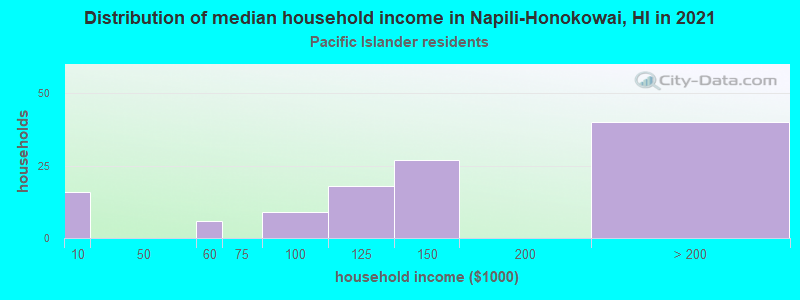
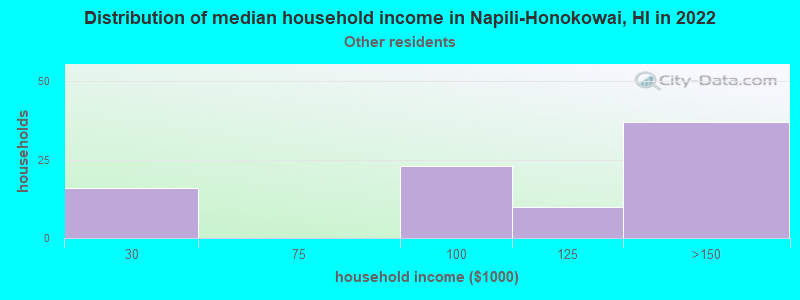
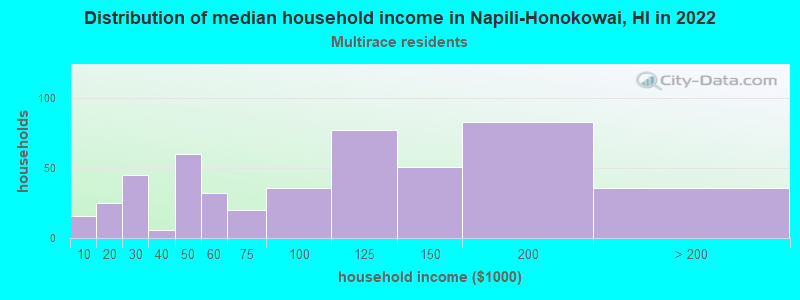
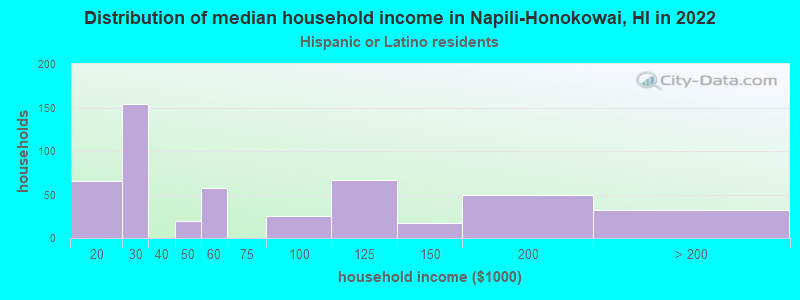
Income and house value in Napili-Honokowai Median household income in 2022 $95,793 White non-Hispanic householders$137,394 Asian householders$120,083 Native Hawaiian and other Pacific Islander householders$45,646 Some other race householders$85,290 Two or more races householders$49,963 Hispanic or Latino race householdersMedian 2022 house value over $1,000,000 White Non-Hispanic householdersover $1,000,000 American Indian or Alaska Native householders $977,019 Asian householders$860,698 Native Hawaiian and other Pacific Islander householders$797,928 Some other race householders$943,683 Two or more races householdersover $1,000,000 Hispanic or Latino householders
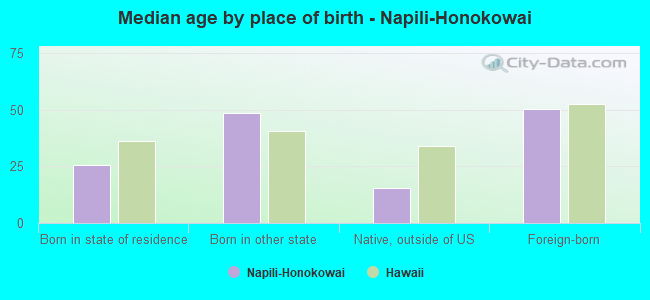
Median age by race in Napili-Honokowai
46.7 Median age for White residents48.4 43.4 43.8 Median age for Black or African American residents-767,462,421.9 -743,362,831.1 -505,841,923.9 Median age for American Indian / Alaska Native residents-496,598,639.0 -904,439,427.2 44.2 Median age for Asian residents37.0 55.0 28.1 Median age for Native Hawaiian / Pacific Islander residents43.8 10.7 45.2 Median age for Other race residents36.1 64.9 33.8 Median age for Two or more races residents26.7 42.4 48.1 Median age for White alone residents50.9 45.4 35.5 Median age for Hispanic or Latino residents27.8 44.2
Owner/renter occupied households by race in Napili-Honokowai
House owners and renters - White residents 734 58.8% Owner occupied514 41.2% Renter occupiedHouse owners and renters - Black or African American residents 27 100.0% Renter occupiedHouse owners and renters - American Indian / Alaska Native residents 54 100.0% Renter occupiedHouse owners and renters - Asian residents 206 62.5% Owner occupied124 37.5% Renter occupiedHouse owners and renters - Native Hawaiian / Pacific Islander residents 90 73.4% Owner occupied33 26.6% Renter occupiedHouse owners and renters - Other race residents 45 32.1% Owner occupied94 67.9% Renter occupiedHouse owners and renters - Two or more races residents 125 23.1% Owner occupied416 76.9% Renter occupiedHouse owners and renters - White alone residents 725 59.0% Owner occupied503 41.0% Renter occupiedHouse owners and renters - Hispanic or Latino residents 106 20.9% Owner occupied401 79.1% Renter occupied
Language usage in Napili-Honokowai
English speakers - Total 83.5% of residents of Napili-Honokowai speak English at home.
7.8% of residents speak Spanish at home 132 26.6% Speak English very well365 73.4% Speak English less than very well9.7% of residents speak other language at home 351 56.7% Speak English very well268 43.3% Speak English less than very well
English speakers - Born in the United States 97.5% of residents of Napili-Honokowai speak English at home.
2.5% of residents speak Spanish at home 19 26.4% Speak English very well53 73.6% Speak English less than very well1.3% of residents speak other language at home 39 100.0% Speak English very well
All residents speak only English at home
English speakers - Foreign-born 28.1% of residents of Napili-Honokowai speak English at home.
28.4% of residents speak Spanish at home 65 25.1% Speak English very well194 74.9% Speak English less than very well42.4% of residents speak other language at home 165 42.6% Speak English very well222 57.4% Speak English less than very well
White (Caucasian) - Speak only English Native:
99.5% (2,402)Foreign-born:
38.5% (71)
White (Caucasian) - Speak another language Native:
1.5% (37)Foreign-born:
63.2% (117)
Black or African American - Speak only English Native:
100.0% (34)Foreign-born:
100.0% (5)
Asian - Speak only English Native:
95.5% (584)Foreign-born:
13.9% (55)
Asian - Speak another language Native:
5.9% (36)Foreign-born:
85.0% (336)
Native Hawaiian / Pacific Islander - Speak only English Native:
80.7% (259)Foreign-born:
73.5% (76)
Native Hawaiian / Pacific Islander - Speak another language Native:
10.8% (35)Foreign-born:
13.3% (14)
Other race - Speak another language Native:
71.3% (87)Foreign-born:
72.0% (86)
Two or more races - Speak only English Native:
89.1% (1,674)Foreign-born:
37.5% (78)
Two or more races - Speak another language Native:
11.0% (206)Foreign-born:
57.7% (120)
White alone - Speak only English Native:
99.8% (2,381)Foreign-born:
78.3% (70)
White alone - Speak another language Native:
1.1% (26)Foreign-born:
19.7% (18)
Hispanic or Latino - Speak only English Native:
84.4% (899)Foreign-born:
22.1% (95)
Hispanic or Latino - Speak another language Native:
15.2% (162)Foreign-born:
65.4% (281)
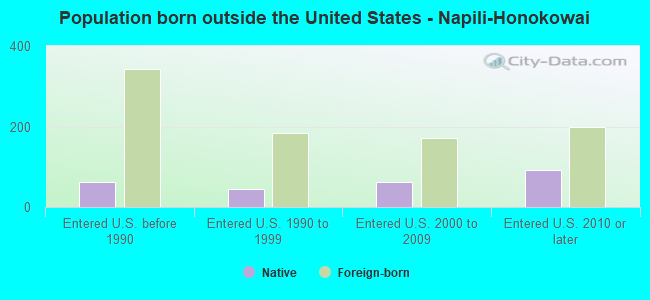
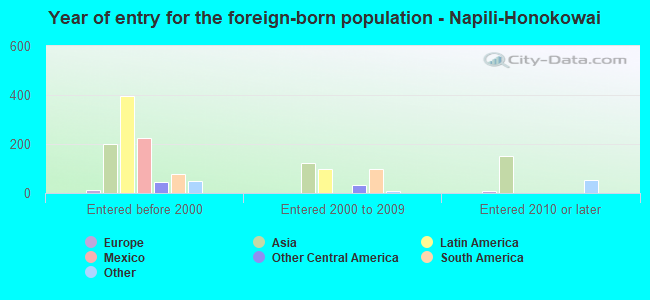
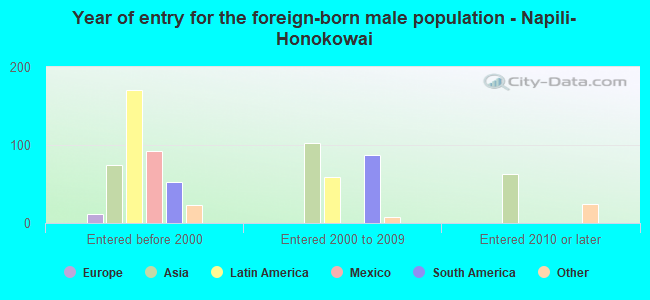
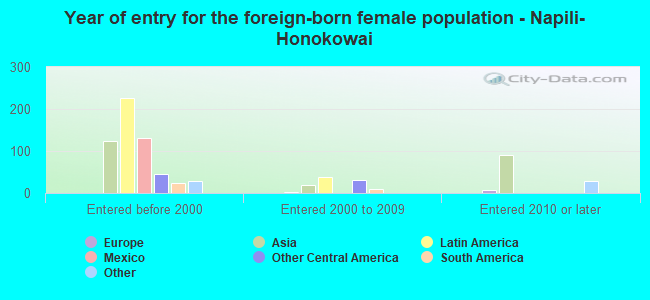
Foreign-born residents in Napili-Honokowai 1,167 residents are foreign born (7.6% Asia , 7.3% Latin America ).
This city:
17.3%Hawaii:
18.0%
Marital status for residents in Napili-Honokowai Marital status - White (Caucasian) population 15 years and over
Males 37.9% Never married48.1% Now married2.7% Separated1.7% Widowed9.6% DivorcedFemales 32.0% Never married39.3% Now married0.0% Separated8.3% Widowed20.3% DivorcedWomen who did not give birth in the past 12 months Now married:
30.4% (202)Unmarried:
69.6% (461)
Marital status - Black or African American population 15 years and over
Males 65.0% Never married35.0% Now married0.0% Separated0.0% Widowed0.0% DivorcedFemales 70.8% Never married0.0% Now married0.0% Separated0.0% Widowed29.2% DivorcedWomen who did not give birth in the past 12 months Now married:
0.0% (0)Unmarried:
100.0% (17)
Marital status - Asian population 15 years and over
Males 43.6% Never married49.8% Now married4.2% Separated0.0% Widowed2.5% DivorcedFemales 12.4% Never married65.1% Now married0.0% Separated13.9% Widowed8.5% DivorcedWomen who did not give birth in the past 12 months Now married:
72.1% (131)Unmarried:
27.9% (51)
Marital status - Native Hawaiian / Pacific Islander population 15 years and over
Males 17.4% Never married66.5% Now married0.0% Separated0.0% Widowed16.1% DivorcedFemales 0.0% Never married67.6% Now married0.0% Separated1.9% Widowed30.5% DivorcedWomen who did not give birth in the past 12 months Now married:
71.7% (64)Unmarried:
28.3% (25)
Marital status - Other race population 15 years and over
Males 84.9% Never married15.1% Now married0.0% Separated0.0% Widowed0.0% DivorcedFemales 26.6% Never married51.6% Now married21.9% Separated0.0% Widowed0.0% DivorcedWomen who did not give birth in the past 12 months Now married:
32.0% (19)Unmarried:
68.0% (41)
Marital status - Two or more races population 15 years and over
Males 52.3% Never married34.2% Now married0.0% Separated0.2% Widowed13.3% DivorcedFemales 43.9% Never married20.3% Now married9.4% Separated12.2% Widowed14.2% DivorcedWomen who gave birth in the past 12 months Now married:
0.0% (0)Unmarried:
100.0% (73)
Women who did not give birth in the past 12 months Now married:
37.8% (213)Unmarried:
62.2% (352)
Marital status - White alone, not Hispanic / Latino population 15 years and over
Males 37.3% Never married46.9% Now married3.0% Separated1.9% Widowed10.8% DivorcedFemales 29.1% Never married40.3% Now married0.0% Separated8.9% Widowed21.7% DivorcedWomen who did not give birth in the past 12 months Now married:
33.4% (212)Unmarried:
66.6% (424)
Marital status - Hispanic or Latino population 15 years and over
Males 48.3% Never married34.9% Now married0.0% Separated0.0% Widowed16.9% DivorcedFemales 38.5% Never married26.8% Now married13.1% Separated5.1% Widowed16.4% DivorcedWomen who gave birth in the past 12 months Now married:
0.0% (0)Unmarried:
100.0% (62)
Women who did not give birth in the past 12 months Now married:
45.0% (178)Unmarried:
55.0% (218)
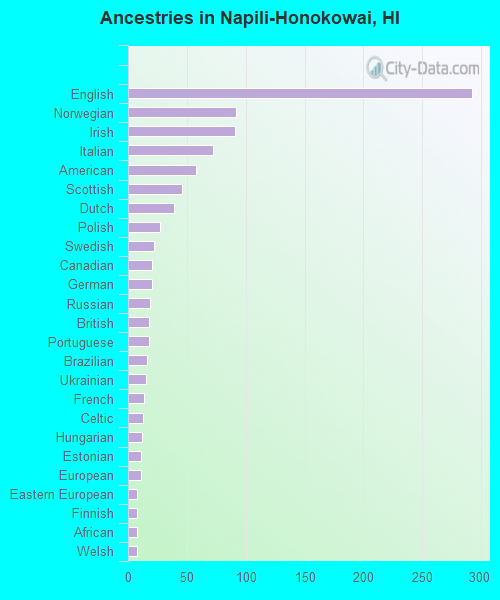
Ancestries in Napili-Honokowai
292 10.7% English92 3.4% Norwegian91 3.3% Irish72 2.6% Italian58 2.1% American46 1.7% Scottish39 1.4% Dutch27 1.0% Polish22 0.8% Swedish20 0.7% Canadian20 0.7% German19 0.7% Russian18 0.7% British18 0.7% Portuguese16 0.6% Brazilian15 0.5% Ukrainian14 0.5% French13 0.5% Celtic12 0.4% Hungarian11 0.4% Estonian11 0.4% European8 0.3% Eastern European8 0.3% Finnish8 0.3% African8 0.3% Welsh6 0.2% Slovak3 0.1% Swiss
Geographical mobility in Napili-Honokowai Same house 1 year ago 2,476 92.0% White (Caucasian)39 96.5% Black or African American42 93.1% American Indian / Alaska Native1,067 100.0% Asian408 93.6% Native Hawaiian / Pacific Islander256 100.0% Other race1,686 75.4% Two or more races2,348 93.1% White alone, not Hispanic / Latino1,117 69.3% Hispanic or LatinoMoved within same county 145 5.4% White / Caucasian4 1.6% Other race184 8.2% Two or more races106 4.2% White alone, not Hispanic / Latino203 12.6% Hispanic or LatinoMoved within same state 65 2.4% White / Caucasian2 0.2% Asian66 2.6% White alone, not Hispanic / LatinoMoved from different state 69 2.6% White / Caucasian491 22.0% Two or more races61 2.4% White alone, not Hispanic / Latino530 32.9% Hispanic or LatinoMoved from abroad 7 0.3% White6 0.3% Two or more races7 0.3% White alone, not Hispanic / Latino
Children Nativity (place of birth) in Napili-Honokowai
Children under 6 years - Living with two parents Both parents native 50 100.0% NativeBoth parents foreign-born 26 100.0% NativeOne native, one foreign-born parent 81 100.0% NativeChildren under 6 years - Living with one parent Native parent 384 100.0% NativeChildren 6 to 17 years - Living with two parents Both parents native 199 100.0% NativeBoth parents foreign-born 5 100.0% NativeOne native, one foreign-born parent 194 100.0% NativeChildren 6 to 17 years - Living with one parent Native parent 418 100.0% NativeForeign-born parent 69 54.9% Native57 45.1% Foreign-born
Grandparents responsible for own grandchildren in Napili-Honokowai
Grandparents (30 to 59 years) White / Caucasian 15 100.0% Not responsible for grandchildrenWhite alone, not Hispanic / Latino 15 100.0% Not responsible for grandchildren
Grandparents (60 years and over) White / Caucasian 58 100.0% Not responsible for grandchildrenWhite alone, not Hispanic / Latino 58 100.0% Not responsible for grandchildren