Races in Nanuet, New York (NY) Detailed Stats
Data:
Races - White alone (%)
Races - White alone (% change since 2000)
Races - Black alone (%)
Races - Black alone (% change since 2000)
Races - American Indian alone (%)
Races - American Indian alone (% change since 2000)
Races - Asian alone (%)
Races - Asian alone (% change since 2000)
Races - Hispanic (%)
Races - Hispanic (% change since 2000)
Races - Native Hawaiian and Other Pacific Islander alone (%)
Races - Native Hawaiian and Other Pacific Islander alone (% change since 2000)
Races - Two or more races(%)
Races - Two or more races(% change since 2000)
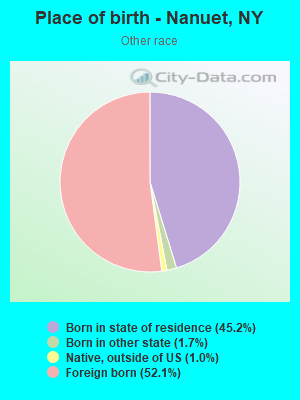
Races - Other race alone (%)
Races - Other race alone (% change since 2000)
Racial diversity
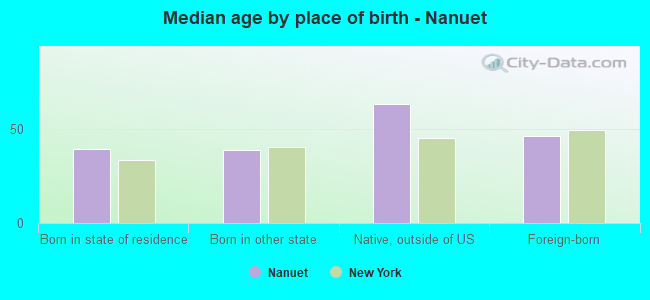
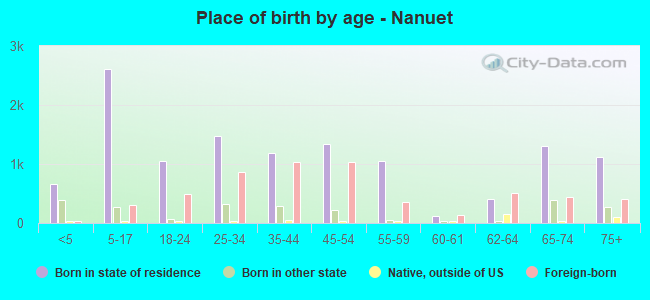
Place of birth - Born in state of residence (%)
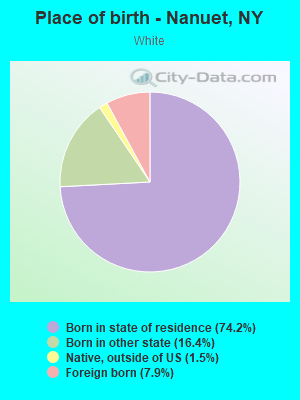
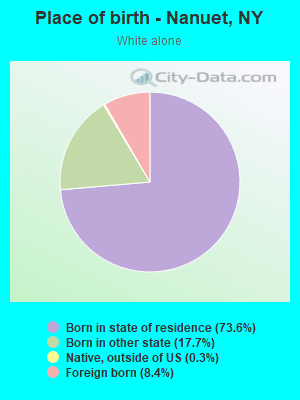
Place of birth - Born in state of residence (%) - White
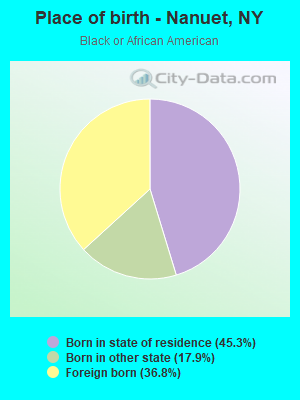
Place of birth - Born in state of residence (%) - Black or African American
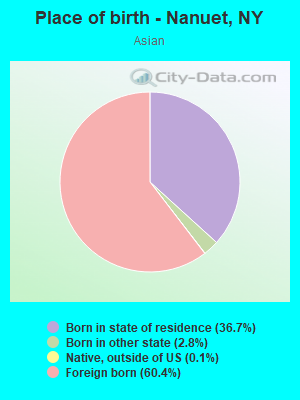
Place of birth - Born in state of residence (%) - Asian
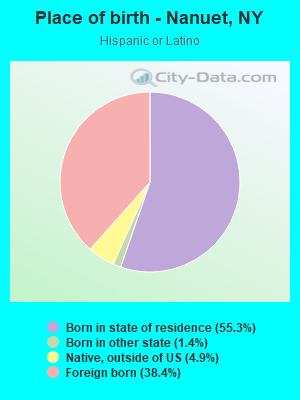
Place of birth - Born in state of residence (%) - Hispanic or Latino
Place of birth - Born in state of residence (%) - American Indian and Alaska Native
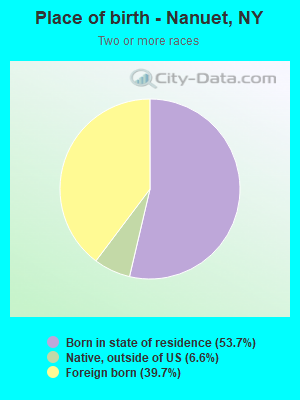
Place of birth - Born in state of residence (%) - Multirace
Place of birth - Born in state of residence (%) - Other Race
Place of birth - Born in other state (%)
Place of birth - Born in other state (%) - White
Place of birth - Born in other state (%) - Black or African American
Place of birth - Born in other state (%) - Asian
Place of birth - Born in other state (%) - Hispanic or Latino
Place of birth - Born in other state (%) - American Indian and Alaska Native
Place of birth - Born in other state (%) - Multirace
Place of birth - Born in other state (%) - Other Race
Place of birth - Native, outside of US (%)
Place of birth - Native, outside of US (%) - White
Place of birth - Native, outside of US (%) - Black or African American
Place of birth - Native, outside of US (%) - Asian
Place of birth - Native, outside of US (%) - Hispanic or Latino
Place of birth - Native, outside of US (%) - American Indian and Alaska Native
Place of birth - Native, outside of US (%) - Multirace
Place of birth - Native, outside of US (%) - Other Race
Place of birth - Foreign born (%)
Place of birth - Foreign born (%) - White
Place of birth - Foreign born (%) - Black or African American
Place of birth - Foreign born (%) - Asian
Place of birth - Foreign born (%) - Hispanic or Latino
Place of birth - Foreign born (%) - American Indian and Alaska Native
Place of birth - Foreign born (%) - Multirace
Place of birth - Foreign born (%) - Other Race
Residents speaking English at home (%)
Residents speaking English at home - Born in the United States (%)
Residents speaking English at home - Native, born elsewhere (%)
Residents speaking English at home - Foreign born (%)
Residents speaking Spanish at home (%)
Residents speaking Spanish at home - Born in the United States (%)
Residents speaking Spanish at home - Native, born elsewhere (%)
Residents speaking Spanish at home - Foreign born (%)
Residents speaking other language at home (%)
Residents speaking other language at home - Born in the United States (%)
Residents speaking other language at home - Native, born elsewhere (%)
Residents speaking other language at home - Foreign born (%)
Marital status - Never married (%)
Marital status - Now married (%)
Marital status - Separated (%)
Marital status - Widowed (%)
Marital status - Divorced (%)
Ancestries Reported - Arab (%)
Ancestries Reported - Czech (%)
Ancestries Reported - Danish (%)
Ancestries Reported - Dutch (%)
Ancestries Reported - English (%)
Ancestries Reported - French (%)
Ancestries Reported - French Canadian (%)
Ancestries Reported - German (%)
Ancestries Reported - Greek (%)
Ancestries Reported - Hungarian (%)
Ancestries Reported - Irish (%)
Ancestries Reported - Italian (%)
Ancestries Reported - Lithuanian (%)
Ancestries Reported - Norwegian (%)
Ancestries Reported - Polish (%)
Ancestries Reported - Portuguese (%)
Ancestries Reported - Russian (%)
Ancestries Reported - Scotch-Irish (%)
Ancestries Reported - Scottish (%)
Ancestries Reported - Slovak (%)
Ancestries Reported - Subsaharan African (%)
Ancestries Reported - Swedish (%)
Ancestries Reported - Swiss (%)
Ancestries Reported - Ukrainian (%)
Ancestries Reported - United States (%)
Ancestries Reported - Welsh (%)
Ancestries Reported - West Indian (%)
Ancestries Reported - Other (%)
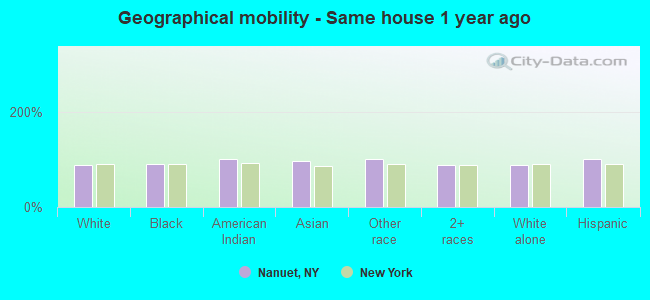
Geographical mobility - Same house 1 year ago (%)
Geographical mobility - Same house 1 year ago (%) - White
Geographical mobility - Same house 1 year ago (%) - Black or African American
Geographical mobility - Same house 1 year ago (%) - Asian
Geographical mobility - Same house 1 year ago (%) - Hispanic or Latino
Geographical mobility - Same house 1 year ago (%) - American Indian and Alaska Native
Geographical mobility - Same house 1 year ago (%) - Multirace
Geographical mobility - Same house 1 year ago (%) - Other Race
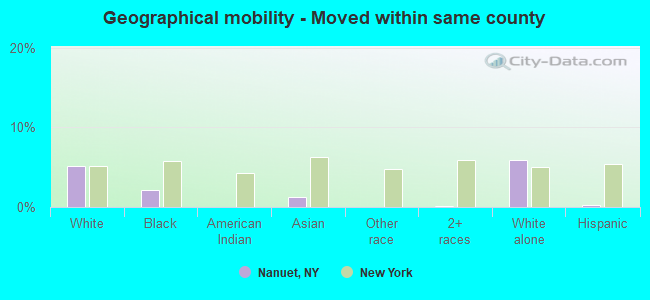
Geographical mobility - Moved within same county (%)
Geographical mobility - Moved within same county (%) - White
Geographical mobility - Moved within same county (%) - Black or African American
Geographical mobility - Moved within same county (%) - Asian
Geographical mobility - Moved within same county (%) - Hispanic or Latino
Geographical mobility - Moved within same county (%) - American Indian and Alaska Native
Geographical mobility - Moved within same county (%) - Multirace
Geographical mobility - Moved within same county (%) - Other Race
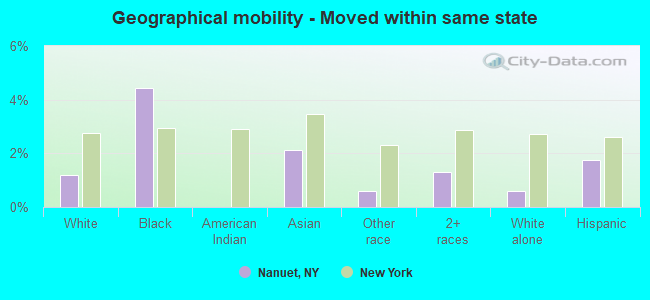
Geographical mobility - Moved from different county within same state (%)
Geographical mobility - Moved from different county within same state (%) - White
Geographical mobility - Moved from different county within same state (%) - Black or African American
Geographical mobility - Moved from different county within same state (%) - Asian
Geographical mobility - Moved from different county within same state (%) - Hispanic or Latino
Geographical mobility - Moved from different county within same state (%) - American Indian and Alaska Native
Geographical mobility - Moved from different county within same state (%) - Multirace
Geographical mobility - Moved from different county within same state (%) - Other Race
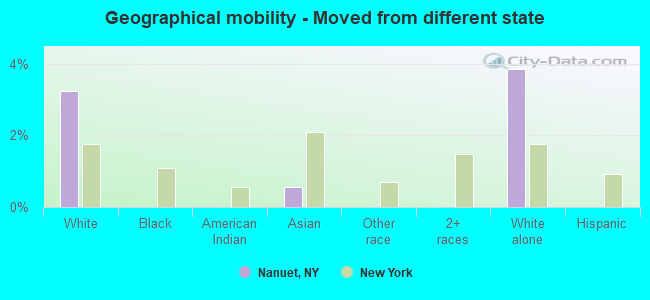
Geographical mobility - Moved from different state (%)
Geographical mobility - Moved from different state (%) - White
Geographical mobility - Moved from different state (%) - Black or African American
Geographical mobility - Moved from different state (%) - Asian
Geographical mobility - Moved from different state (%) - Hispanic or Latino
Geographical mobility - Moved from different state (%) - American Indian and Alaska Native
Geographical mobility - Moved from different state (%) - Multirace
Geographical mobility - Moved from different state (%) - Other Race
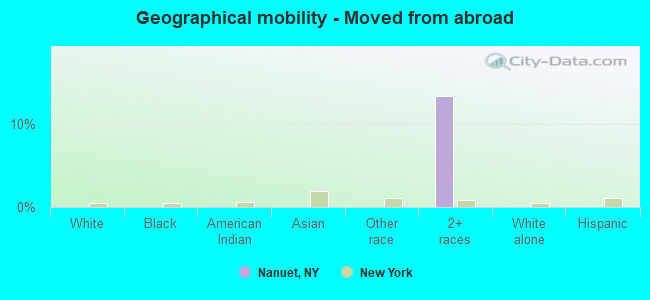
Geographical mobility - Moved from abroad (%)
Geographical mobility - Moved from abroad (%) - White
Geographical mobility - Moved from abroad (%) - Black or African American
Geographical mobility - Moved from abroad (%) - Asian
Geographical mobility - Moved from abroad (%) - Hispanic or Latino
Geographical mobility - Moved from abroad (%) - American Indian and Alaska Native
Geographical mobility - Moved from abroad (%) - Multirace
Geographical mobility - Moved from abroad (%) - Other Race
Place of birth for the foreign-born population - Ireland (%)
Place of birth for the foreign-born population - Denmark (%)
Place of birth for the foreign-born population - Norway (%)
Place of birth for the foreign-born population - Sweden (%)
Place of birth for the foreign-born population - United Kingdom (%)
Place of birth for the foreign-born population - England (%)
Place of birth for the foreign-born population - Scotland (%)
Place of birth for the foreign-born population - Other Northern Europe (%)
Place of birth for the foreign-born population - Austria (%)
Place of birth for the foreign-born population - Belgium (%)
Place of birth for the foreign-born population - France (%)
Place of birth for the foreign-born population - Germany (%)
Place of birth for the foreign-born population - Netherlands (%)
Place of birth for the foreign-born population - Switzerland (%)
Place of birth for the foreign-born population - Other Western Europe (%)
Place of birth for the foreign-born population - Greece (%)
Place of birth for the foreign-born population - Italy (%)
Place of birth for the foreign-born population - Portugal (%)
Place of birth for the foreign-born population - Spain (%)
Place of birth for the foreign-born population - Other Southern Europe (%)
Place of birth for the foreign-born population - Albania (%)
Place of birth for the foreign-born population - Belarus (%)
Place of birth for the foreign-born population - Bosnia and Herzegovina (%)
Place of birth for the foreign-born population - Bulgaria (%)
Place of birth for the foreign-born population - Croatia (%)
Place of birth for the foreign-born population - Czechoslovakia (%)
Place of birth for the foreign-born population - Hungary (%)
Place of birth for the foreign-born population - Latvia (%)
Place of birth for the foreign-born population - Lithuania (%)
Place of birth for the foreign-born population - North Macedonia (Macedonia) (%)
Place of birth for the foreign-born population - Moldova (%)
Place of birth for the foreign-born population - Poland (%)
Place of birth for the foreign-born population - Romania (%)
Place of birth for the foreign-born population - Russia (%)
Place of birth for the foreign-born population - Serbia (%)
Place of birth for the foreign-born population - Ukraine (%)
Place of birth for the foreign-born population - Other Eastern Europe (%)
Place of birth for the foreign-born population - China (%)
Place of birth for the foreign-born population - Hong Kong (%)
Place of birth for the foreign-born population - Taiwan (%)
Place of birth for the foreign-born population - Japan (%)
Place of birth for the foreign-born population - Korea (%)
Place of birth for the foreign-born population - Other Eastern Asia (%)
Place of birth for the foreign-born population - Afghanistan (%)
Place of birth for the foreign-born population - Bangladesh (%)
Place of birth for the foreign-born population - India (%)
Place of birth for the foreign-born population - Iran (%)
Place of birth for the foreign-born population - Kazakhstan (%)
Place of birth for the foreign-born population - Nepal (%)
Place of birth for the foreign-born population - Pakistan (%)
Place of birth for the foreign-born population - Sri Lanka (%)
Place of birth for the foreign-born population - Uzbekistan (%)
Place of birth for the foreign-born population - Other South Central Asia (%)
Place of birth for the foreign-born population - Burma (%)
Place of birth for the foreign-born population - Cambodia (%)
Place of birth for the foreign-born population - Indonesia (%)
Place of birth for the foreign-born population - Laos (%)
Place of birth for the foreign-born population - Malaysia (%)
Place of birth for the foreign-born population - Philippines (%)
Place of birth for the foreign-born population - Singapore (%)
Place of birth for the foreign-born population - Thailand (%)
Place of birth for the foreign-born population - Vietnam (%)
Place of birth for the foreign-born population - Other South Eastern Asia (%)
Place of birth for the foreign-born population - Armenia (%)
Place of birth for the foreign-born population - Iraq (%)
Place of birth for the foreign-born population - Israel (%)
Place of birth for the foreign-born population - Jordan (%)
Place of birth for the foreign-born population - Kuwait (%)
Place of birth for the foreign-born population - Lebanon (%)
Place of birth for the foreign-born population - Saudi Arabia (%)
Place of birth for the foreign-born population - Syria (%)
Place of birth for the foreign-born population - Turkey (%)
Place of birth for the foreign-born population - Yemen (%)
Place of birth for the foreign-born population - Other Western Asia (%)
Place of birth for the foreign-born population - Eritrea (%)
Place of birth for the foreign-born population - Ethiopia (%)
Place of birth for the foreign-born population - Kenya (%)
Place of birth for the foreign-born population - Somalia (%)
Place of birth for the foreign-born population - Uganda (%)
Place of birth for the foreign-born population - Zimbabwe (%)
Place of birth for the foreign-born population - Other Eastern Africa (%)
Place of birth for the foreign-born population - Cameroon (%)
Place of birth for the foreign-born population - Congo (%)
Place of birth for the foreign-born population - Democratic Republic of Congo (Zaire) (%)
Place of birth for the foreign-born population - Other Middle Africa (%)
Place of birth for the foreign-born population - Egypt (%)
Place of birth for the foreign-born population - Morocco (%)
Place of birth for the foreign-born population - Sudan (%)
Place of birth for the foreign-born population - Other Northern Africa (%)
Place of birth for the foreign-born population - South Africa (%)
Place of birth for the foreign-born population - Other Southern Africa (%)
Place of birth for the foreign-born population - Cabo Verde (%)
Place of birth for the foreign-born population - Ghana (%)
Place of birth for the foreign-born population - Liberia (%)
Place of birth for the foreign-born population - Nigeria (%)
Place of birth for the foreign-born population - Senegal (%)
Place of birth for the foreign-born population - Sierra Leone (%)
Place of birth for the foreign-born population - Other Western Africa (%)
Place of birth for the foreign-born population - Australia (%)
Place of birth for the foreign-born population - New Zealand (%)
Place of birth for the foreign-born population - Fiji (%)
Place of birth for the foreign-born population - Micronesia (%)
Place of birth for the foreign-born population - Bahamas (%)
Place of birth for the foreign-born population - Barbados (%)
Place of birth for the foreign-born population - Cuba (%)
Place of birth for the foreign-born population - Dominica (%)
Place of birth for the foreign-born population - Dominican Republic (%)
Place of birth for the foreign-born population - Grenada (%)
Place of birth for the foreign-born population - Haiti (%)
Place of birth for the foreign-born population - Jamaica (%)
Place of birth for the foreign-born population - St. Vincent and the Grenadines (%)
Place of birth for the foreign-born population - Trinidad and Tobago (%)
Place of birth for the foreign-born population - West Indies (%)
Place of birth for the foreign-born population - Other Caribbean (%)
Place of birth for the foreign-born population - Belize (%)
Place of birth for the foreign-born population - Costa Rica (%)
Place of birth for the foreign-born population - El Salvador (%)
Place of birth for the foreign-born population - Guatemala (%)
Place of birth for the foreign-born population - Honduras (%)
Place of birth for the foreign-born population - Mexico (%)
Place of birth for the foreign-born population - Nicaragua (%)
Place of birth for the foreign-born population - Panama (%)
Place of birth for the foreign-born population - Other Central America (%)
Place of birth for the foreign-born population - Argentina (%)
Place of birth for the foreign-born population - Bolivia (%)
Place of birth for the foreign-born population - Brazil (%)
Place of birth for the foreign-born population - Chile (%)
Place of birth for the foreign-born population - Colombia (%)
Place of birth for the foreign-born population - Ecuador (%)
Place of birth for the foreign-born population - Guyana (%)
Place of birth for the foreign-born population - Peru (%)
Place of birth for the foreign-born population - Uruguay (%)
Place of birth for the foreign-born population - Venezuela (%)
Place of birth for the foreign-born population - Other South America (%)
Place of birth for the foreign-born population - Canada (%)
Place of birth for the foreign-born population - Other Northern America (%)
Place of birth for the foreign-born population - Other (%)
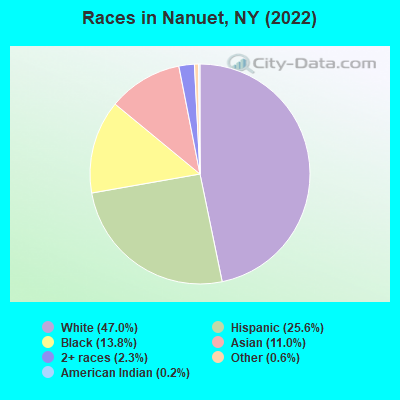
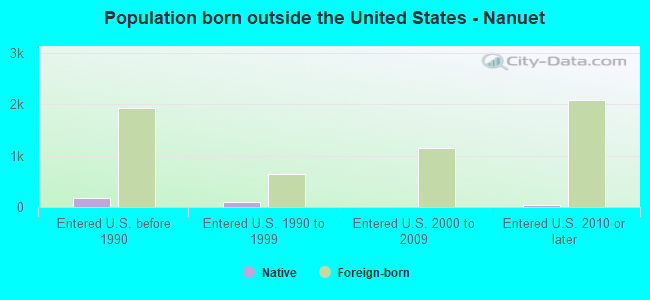
According to 2022 data, the most numerous races in Nanuet, NY are White alone (9,719 residents), Hispanic (5,301 residents), and Black alone (2,863 residents). 60.1% of Nanuet residents speak English at home. 27.7% of Nanuet, NY residents are foreign-born (14.9% born in Latin America, 8.3% born in Asia), which is 20.5% greater than the foreign-born rate of 22.0% across the entire state of New York.
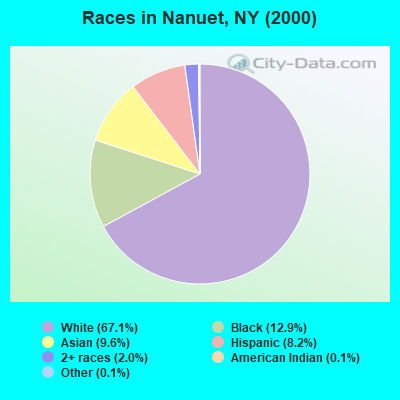
Race distribution in Nanuet
2000 2022
11,760,981 62.0% White alone 2,867,583 15.1% Hispanic 2,812,623 14.8% Black alone 1,035,926 5.5% Asian alone 366,116 1.9% Two or more races 75,499 0.4% Other race alone 52,499 0.3% American Indian alone 5,230 0.03% Native Hawaiian and Other
10,408,933 52.9% White alone 3,867,299 19.7% Hispanic 2,633,840 13.4% Black alone 1,776,286 9.0% Asian alone 732,670 3.7% Two or more races 216,110 1.1% Other race alone 35,082 0.2% American Indian alone 6,931 0.04% Native Hawaiian and Other
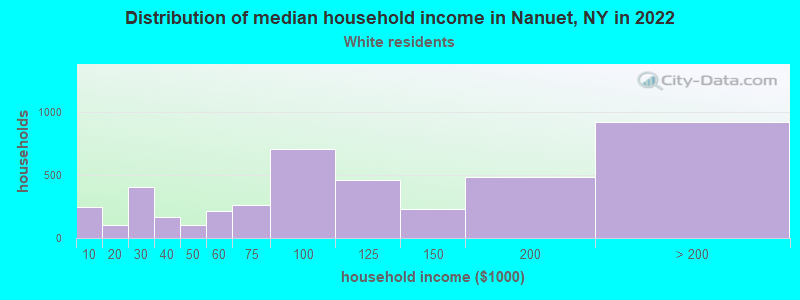
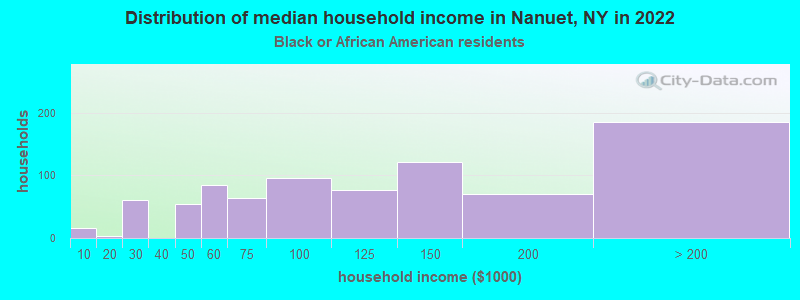
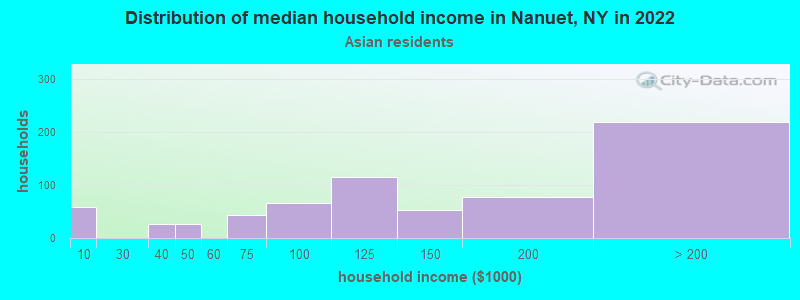
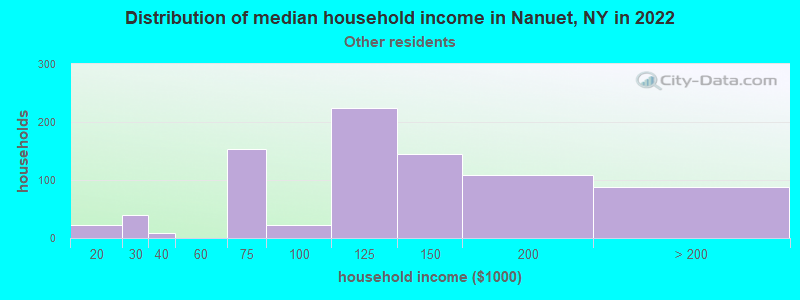
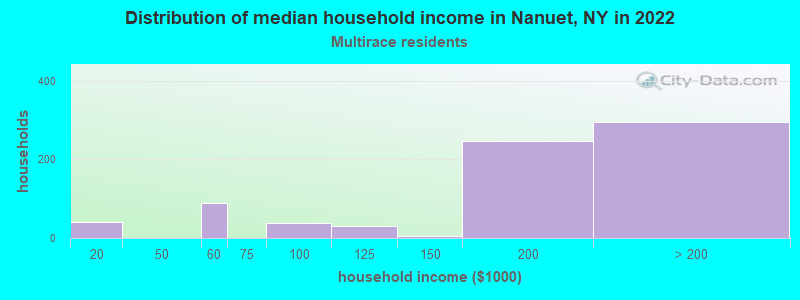
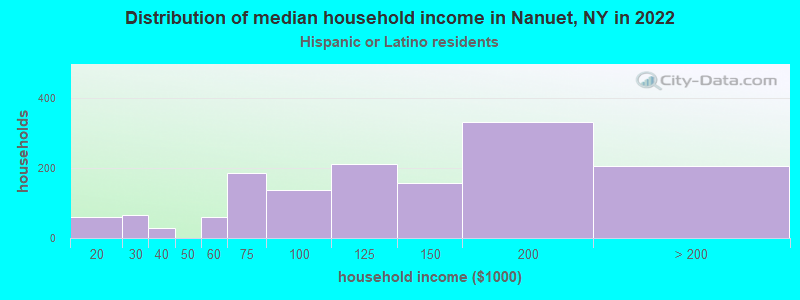
Income and house value in Nanuet Median household income in 2022 $100,149 White non-Hispanic householders$97,344 Black householders$111,083 Asian householders$122,539 Some other race householders$180,985 Two or more races householders$123,491 Hispanic or Latino race householdersMedian 2022 house value $529,335 White Non-Hispanic householders$325,119 Black or African American householders $524,499 Asian householders$494,603 Some other race householders$455,254 Two or more races householders$509,771 Hispanic or Latino householders
Median age by race in Nanuet
45.8 Median age for White residents42.1 51.5 42.5 Median age for Black or African American residents34.9 49.1 -666,666,666.0 Median age for American Indian / Alaska Native residents-750,656,167.2 -644,444,443.8 47.6 Median age for Asian residents40.7 55.1 -463,937,621.4 Median age for Native Hawaiian / Pacific Islander residents-649,572,648.9 -666,666,666.0 34.4 Median age for Other race residents35.1 32.3 36.3 Median age for Two or more races residents32.4 43.3 46.2 Median age for White alone residents44.1 50.8 35.5 Median age for Hispanic or Latino residents34.4 38.5
Owner/renter occupied households by race in Nanuet
House owners and renters - White residents 2,974 70.5% Owner occupied1,247 29.5% Renter occupiedHouse owners and renters - Black or African American residents 688 76.9% Owner occupied206 23.1% Renter occupiedHouse owners and renters - Asian residents 490 85.8% Owner occupied81 14.2% Renter occupiedHouse owners and renters - Other race residents 371 54.9% Owner occupied305 45.1% Renter occupiedHouse owners and renters - Two or more races residents 177 24.5% Owner occupied544 75.5% Renter occupiedHouse owners and renters - White alone residents 2,734 70.5% Owner occupied1,142 29.5% Renter occupiedHouse owners and renters - Hispanic or Latino residents 790 51.1% Owner occupied756 48.9% Renter occupied
Language usage in Nanuet
English speakers - Total 60.1% of residents of Nanuet speak English at home.
19.7% of residents speak Spanish at home 1,777 46.0% Speak English very well2,086 54.0% Speak English less than very well19.4% of residents speak other language at home 2,567 67.3% Speak English very well1,245 32.7% Speak English less than very well
English speakers - Born in the United States 99.9% of residents of Nanuet speak English at home.
3.0% of residents speak Spanish at home 59 100.0% Speak English very well2.4% of residents speak other language at home 5 10.9% Speak English very well41 89.1% Speak English less than very well
English speakers - Native, born elsewhere 23.5% of residents of Nanuet speak English at home.
81.2% of residents speak Spanish at home 142 54.0% Speak English very well121 46.0% Speak English less than very well
English speakers - Foreign-born 18.4% of residents of Nanuet speak English at home.
35.0% of residents speak Spanish at home 383 19.5% Speak English very well1,579 80.5% Speak English less than very well47.1% of residents speak other language at home 1,679 63.6% Speak English very well959 36.4% Speak English less than very well
White (Caucasian) - Speak only English Native:
89.6% (8,093)Foreign-born:
51.3% (423)
White (Caucasian) - Speak another language Native:
11.7% (1,059)Foreign-born:
52.7% (434)
Black or African American - Speak only English Native:
81.2% (1,391)Foreign-born:
41.9% (441)
Black or African American - Speak another language Native:
18.7% (320)Foreign-born:
56.1% (591)
Asian - Speak only English Native:
57.6% (402)Foreign-born:
5.9% (86)
Asian - Speak another language Native:
42.4% (296)Foreign-born:
92.3% (1,348)
Other race - Speak another language Native:
80.6% (1,006)Foreign-born:
100.0% (1,622)
Two or more races - Speak only English Native:
35.8% (417)Foreign-born:
2.2% (19)
Two or more races - Speak another language Native:
59.8% (698)Foreign-born:
94.6% (811)
White alone - Speak only English Native:
92.5% (7,750)Foreign-born:
51.0% (414)
White alone - Speak another language Native:
7.4% (617)Foreign-born:
50.1% (406)
Hispanic or Latino - Speak only English Native:
31.9% (958)Foreign-born:
0.4% (9)
Hispanic or Latino - Speak another language Native:
60.6% (1,822)Foreign-born:
99.1% (1,991)
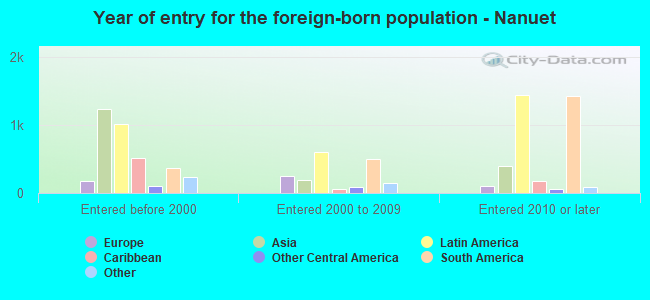
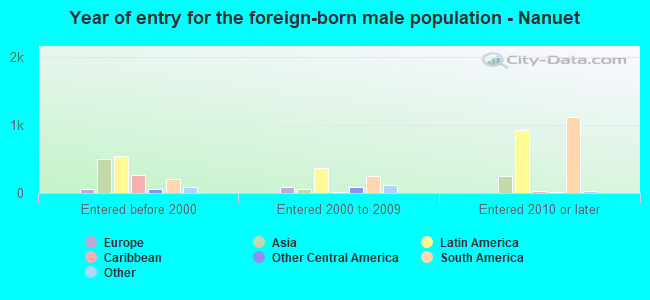
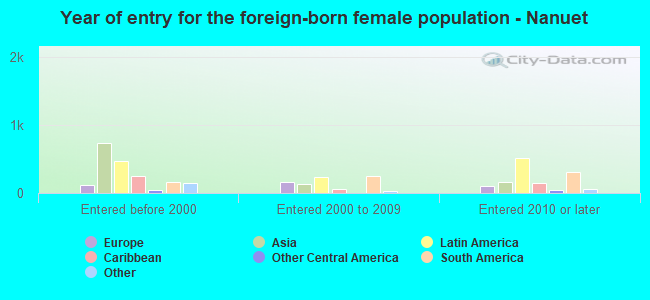
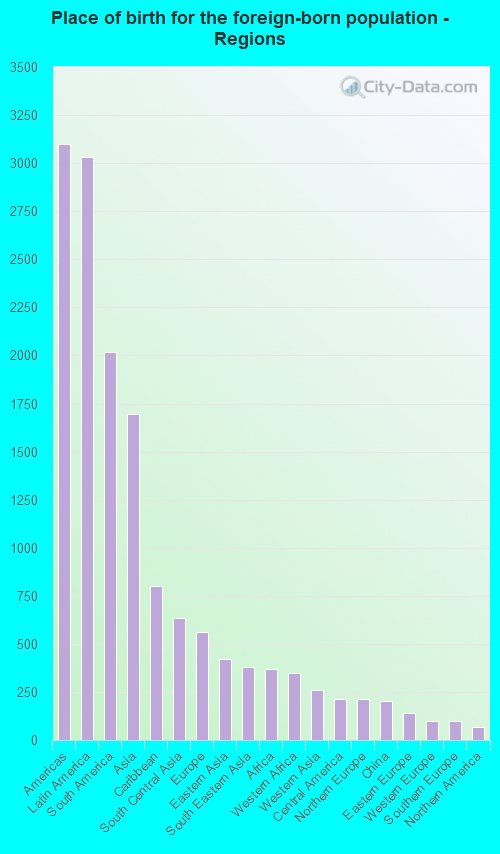
Foreign-born residents in Nanuet 5,729 residents are foreign born (14.9% Latin America , 8.3% Asia ).
This city:
27.7%New York:
22.6%
Marital status for residents in Nanuet Marital status - White (Caucasian) population 15 years and over
Males 36.8% Never married48.1% Now married1.8% Separated3.9% Widowed9.4% DivorcedFemales 31.7% Never married43.3% Now married0.2% Separated9.7% Widowed15.0% DivorcedWomen who gave birth in the past 12 months Now married:
100.0% (76)Unmarried:
0.0% (0)
Women who did not give birth in the past 12 months Now married:
32.4% (608)Unmarried:
67.6% (1,270)
Marital status - Black or African American population 15 years and over
Males 60.7% Never married37.5% Now married0.4% Separated0.0% Widowed1.5% DivorcedFemales 33.7% Never married29.6% Now married4.9% Separated12.5% Widowed19.2% DivorcedWomen who gave birth in the past 12 months Now married:
100.0% (76)Unmarried:
0.0% (0)
Women who did not give birth in the past 12 months Now married:
27.0% (108)Unmarried:
73.0% (294)
Marital status - Asian population 15 years and over
Males 35.2% Never married60.3% Now married0.0% Separated1.3% Widowed3.2% DivorcedFemales 24.6% Never married50.0% Now married0.0% Separated21.3% Widowed4.0% DivorcedWomen who did not give birth in the past 12 months Now married:
43.2% (179)Unmarried:
56.8% (235)
Marital status - Other race population 15 years and over
Males 34.9% Never married44.8% Now married7.2% Separated0.0% Widowed13.1% DivorcedFemales 37.8% Never married48.4% Now married0.0% Separated2.7% Widowed11.1% DivorcedWomen who gave birth in the past 12 months Now married:
0.0% (0)Unmarried:
100.0% (27)
Women who did not give birth in the past 12 months Now married:
51.6% (321)Unmarried:
48.4% (300)
Marital status - Two or more races population 15 years and over
Males 21.2% Never married62.5% Now married0.0% Separated16.2% Widowed0.0% DivorcedFemales 60.9% Never married39.1% Now married0.0% Separated0.0% Widowed0.0% DivorcedWomen who did not give birth in the past 12 months Now married:
33.5% (258)Unmarried:
66.5% (511)
Marital status - White alone, not Hispanic / Latino population 15 years and over
Males 34.0% Never married50.5% Now married2.0% Separated2.7% Widowed10.8% DivorcedFemales 32.1% Never married43.7% Now married0.3% Separated10.6% Widowed13.4% DivorcedWomen who gave birth in the past 12 months Now married:
100.0% (79)Unmarried:
0.0% (0)
Women who did not give birth in the past 12 months Now married:
31.7% (565)Unmarried:
68.3% (1,217)
Marital status - Hispanic or Latino population 15 years and over
Males 36.7% Never married44.4% Now married4.1% Separated7.5% Widowed7.4% DivorcedFemales 43.1% Never married42.5% Now married0.0% Separated1.3% Widowed13.1% DivorcedWomen who gave birth in the past 12 months Now married:
0.0% (0)Unmarried:
100.0% (28)
Women who did not give birth in the past 12 months Now married:
42.3% (525)Unmarried:
57.7% (715)
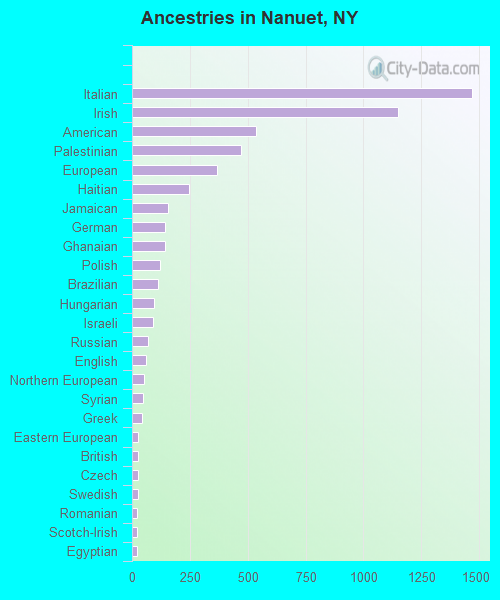
Ancestries in Nanuet
1,469 13.6% Italian1,148 10.7% Irish536 5.0% American469 4.4% Palestinian366 3.4% European248 2.3% Haitian156 1.4% Jamaican142 1.3% German141 1.3% Ghanaian122 1.1% Polish113 1.0% Brazilian94 0.9% Hungarian90 0.8% Israeli71 0.7% Russian59 0.5% English54 0.5% Northern European47 0.4% Syrian42 0.4% Greek28 0.3% Eastern European27 0.3% British25 0.2% Czech24 0.2% Swedish23 0.2% Romanian22 0.2% Scotch-Irish21 0.2% Egyptian20 0.2% Albanian20 0.2% Turkish19 0.2% Ukrainian14 0.1% West Indian13 0.1% Yugoslavian12 0.1% Canadian11 0.1% Jordanian10 0.09% Portuguese8 0.07% Scottish8 0.07% Slovak7 0.06% Norwegian5 0.05% African5 0.05% French
Geographical mobility in Nanuet Same house 1 year ago 9,296 89.4% White (Caucasian)2,600 90.9% Black or African American21 100.0% American Indian / Alaska Native2,115 95.6% Asian3,439 100.0% Other race1,815 86.6% Two or more races8,629 89.0% White alone, not Hispanic / Latino5,606 100.0% Hispanic or LatinoMoved within same county 533 5.1% White / Caucasian62 2.2% Black or African American28 1.3% Asian3 0.1% Two or more races577 6.0% White alone, not Hispanic / Latino11 0.2% Hispanic or LatinoMoved within same state 124 1.2% White / Caucasian127 4.4% Black or African American47 2.1% Asian20 0.6% Other race27 1.3% Two or more races59 0.6% White alone, not Hispanic / Latino95 1.7% Hispanic or LatinoMoved from different state 336 3.2% White / Caucasian12 0.6% Asian374 3.9% White alone, not Hispanic / LatinoMoved from abroad 282 13.5% Two or more races
Children Nativity (place of birth) in Nanuet
Children under 6 years - Living with two parents Both parents native 105 99.8% Native0 0.2% Foreign-bornBoth parents foreign-born 342 97.4% Native9 2.6% Foreign-bornOne native, one foreign-born parent 206 100.0% NativeChildren under 6 years - Living with one parent Native parent 248 100.0% NativeForeign-born parent 98 100.0% NativeChildren 6 to 17 years - Living with two parents Both parents native 846 100.0% NativeBoth parents foreign-born 883 84.4% Native163 15.6% Foreign-bornOne native, one foreign-born parent 297 100.0% NativeChildren 6 to 17 years - Living with one parent Native parent 496 93.2% Native36 6.8% Foreign-bornForeign-born parent 98 61.9% Native60 38.1% Foreign-born
Grandparents responsible for own grandchildren in Nanuet
Grandparents (30 to 59 years) White / Caucasian 5 100.0% Not responsible for grandchildrenBlack or African American 17 100.0% Responsible for grandchildrenWhite alone, not Hispanic / Latino 5 100.0% Not responsible for grandchildrenGrandparents (60 years and over) White / Caucasian 5 1.9% Responsible for grandchildren252 98.1% Not responsible for grandchildrenBlack or African American 9 16.4% Responsible for grandchildren48 83.6% Not responsible for grandchildrenWhite alone, not Hispanic / Latino 5 1.9% Responsible for grandchildren269 98.1% Not responsible for grandchildren