Races in Murray, Utah (UT) Detailed Stats
Data:
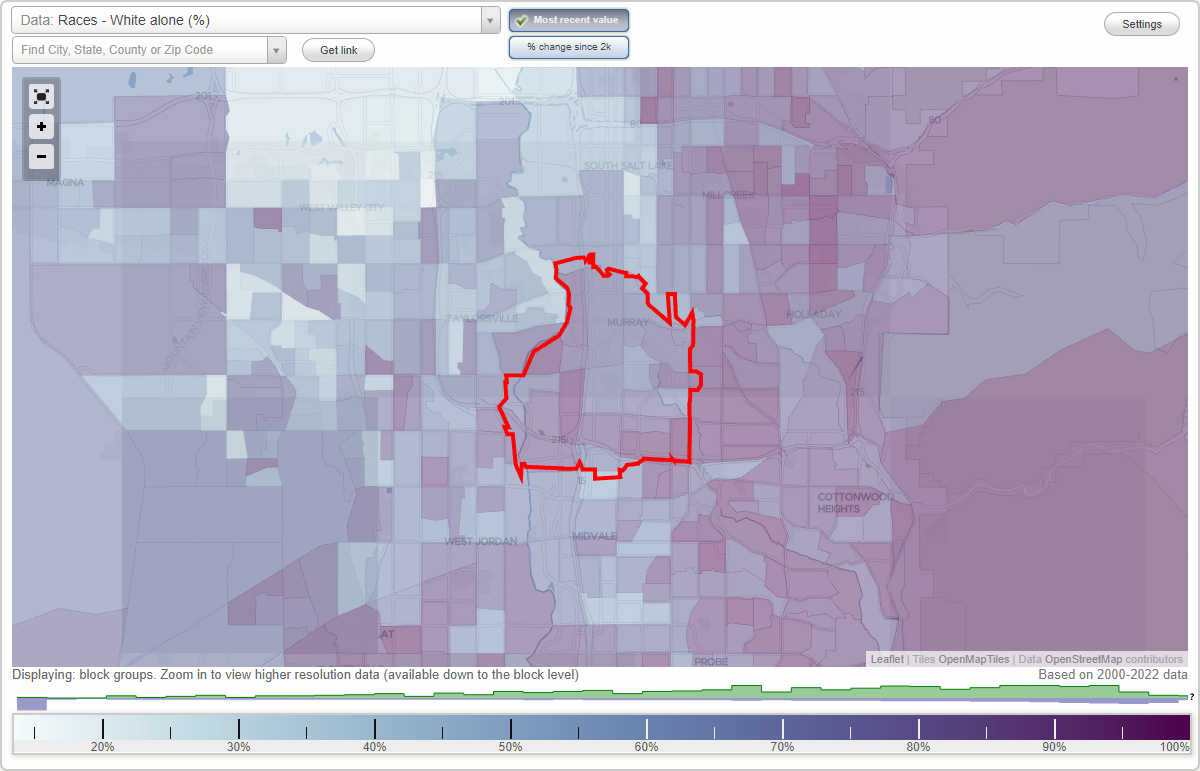
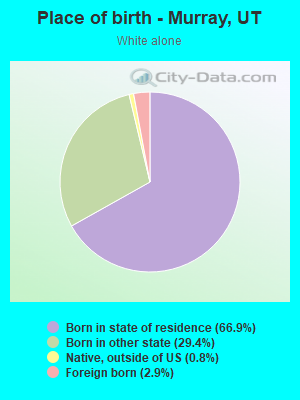
Races - White alone (%)
Races - White alone (% change since 2000)
Races - Black alone (%)
Races - Black alone (% change since 2000)
Races - American Indian alone (%)
Races - American Indian alone (% change since 2000)
Races - Asian alone (%)
Races - Asian alone (% change since 2000)
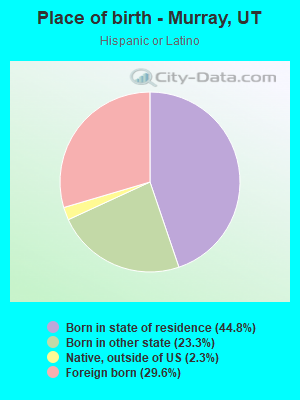
Races - Hispanic (%)
Races - Hispanic (% change since 2000)
Races - Native Hawaiian and Other Pacific Islander alone (%)
Races - Native Hawaiian and Other Pacific Islander alone (% change since 2000)
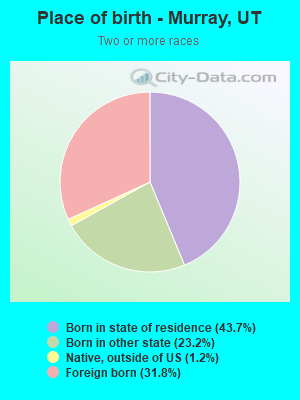
Races - Two or more races(%)
Races - Two or more races(% change since 2000)
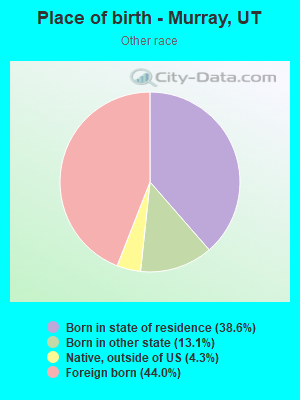
Races - Other race alone (%)
Races - Other race alone (% change since 2000)
Racial diversity
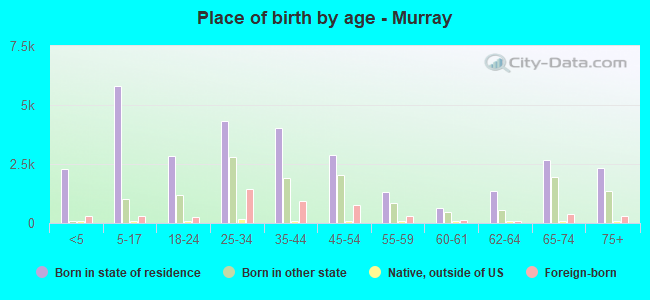
Place of birth - Born in state of residence (%)
Place of birth - Born in state of residence (%) - White
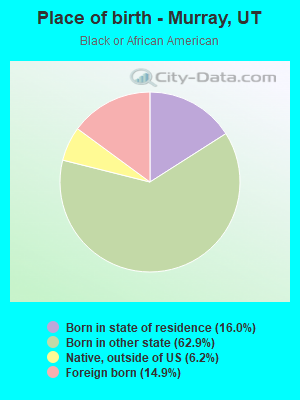
Place of birth - Born in state of residence (%) - Black or African American
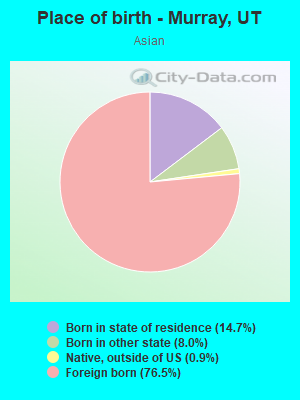
Place of birth - Born in state of residence (%) - Asian
Place of birth - Born in state of residence (%) - Hispanic or Latino
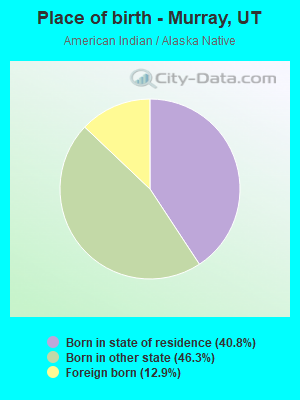
Place of birth - Born in state of residence (%) - American Indian and Alaska Native
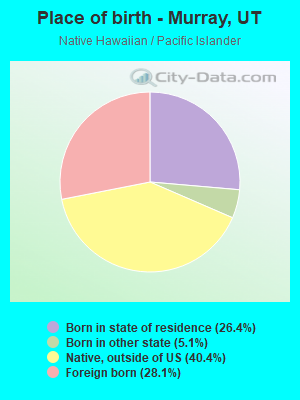
Place of birth - Born in state of residence (%) - Multirace
Place of birth - Born in state of residence (%) - Other Race
Place of birth - Born in other state (%)
Place of birth - Born in other state (%) - White
Place of birth - Born in other state (%) - Black or African American
Place of birth - Born in other state (%) - Asian
Place of birth - Born in other state (%) - Hispanic or Latino
Place of birth - Born in other state (%) - American Indian and Alaska Native
Place of birth - Born in other state (%) - Multirace
Place of birth - Born in other state (%) - Other Race
Place of birth - Native, outside of US (%)
Place of birth - Native, outside of US (%) - White
Place of birth - Native, outside of US (%) - Black or African American
Place of birth - Native, outside of US (%) - Asian
Place of birth - Native, outside of US (%) - Hispanic or Latino
Place of birth - Native, outside of US (%) - American Indian and Alaska Native
Place of birth - Native, outside of US (%) - Multirace
Place of birth - Native, outside of US (%) - Other Race
Place of birth - Foreign born (%)
Place of birth - Foreign born (%) - White
Place of birth - Foreign born (%) - Black or African American
Place of birth - Foreign born (%) - Asian
Place of birth - Foreign born (%) - Hispanic or Latino
Place of birth - Foreign born (%) - American Indian and Alaska Native
Place of birth - Foreign born (%) - Multirace
Place of birth - Foreign born (%) - Other Race
Residents speaking English at home (%)
Residents speaking English at home - Born in the United States (%)
Residents speaking English at home - Native, born elsewhere (%)
Residents speaking English at home - Foreign born (%)
Residents speaking Spanish at home (%)
Residents speaking Spanish at home - Born in the United States (%)
Residents speaking Spanish at home - Native, born elsewhere (%)
Residents speaking Spanish at home - Foreign born (%)
Residents speaking other language at home (%)
Residents speaking other language at home - Born in the United States (%)
Residents speaking other language at home - Native, born elsewhere (%)
Residents speaking other language at home - Foreign born (%)
Marital status - Never married (%)
Marital status - Now married (%)
Marital status - Separated (%)
Marital status - Widowed (%)
Marital status - Divorced (%)
Ancestries Reported - Arab (%)
Ancestries Reported - Czech (%)
Ancestries Reported - Danish (%)
Ancestries Reported - Dutch (%)
Ancestries Reported - English (%)
Ancestries Reported - French (%)
Ancestries Reported - French Canadian (%)
Ancestries Reported - German (%)
Ancestries Reported - Greek (%)
Ancestries Reported - Hungarian (%)
Ancestries Reported - Irish (%)
Ancestries Reported - Italian (%)
Ancestries Reported - Lithuanian (%)
Ancestries Reported - Norwegian (%)
Ancestries Reported - Polish (%)
Ancestries Reported - Portuguese (%)
Ancestries Reported - Russian (%)
Ancestries Reported - Scotch-Irish (%)
Ancestries Reported - Scottish (%)
Ancestries Reported - Slovak (%)
Ancestries Reported - Subsaharan African (%)
Ancestries Reported - Swedish (%)
Ancestries Reported - Swiss (%)
Ancestries Reported - Ukrainian (%)
Ancestries Reported - United States (%)
Ancestries Reported - Welsh (%)
Ancestries Reported - West Indian (%)
Ancestries Reported - Other (%)
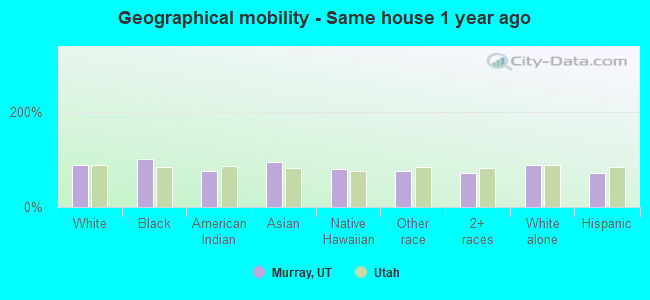
Geographical mobility - Same house 1 year ago (%)
Geographical mobility - Same house 1 year ago (%) - White
Geographical mobility - Same house 1 year ago (%) - Black or African American
Geographical mobility - Same house 1 year ago (%) - Asian
Geographical mobility - Same house 1 year ago (%) - Hispanic or Latino
Geographical mobility - Same house 1 year ago (%) - American Indian and Alaska Native
Geographical mobility - Same house 1 year ago (%) - Multirace
Geographical mobility - Same house 1 year ago (%) - Other Race
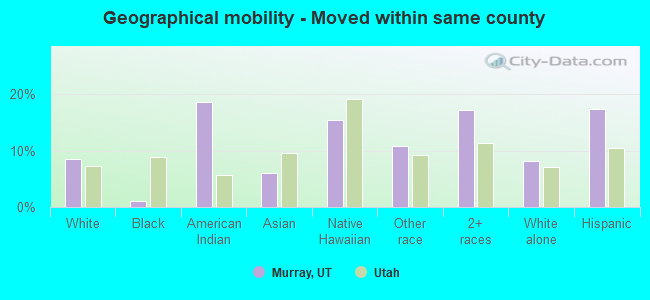
Geographical mobility - Moved within same county (%)
Geographical mobility - Moved within same county (%) - White
Geographical mobility - Moved within same county (%) - Black or African American
Geographical mobility - Moved within same county (%) - Asian
Geographical mobility - Moved within same county (%) - Hispanic or Latino
Geographical mobility - Moved within same county (%) - American Indian and Alaska Native
Geographical mobility - Moved within same county (%) - Multirace
Geographical mobility - Moved within same county (%) - Other Race
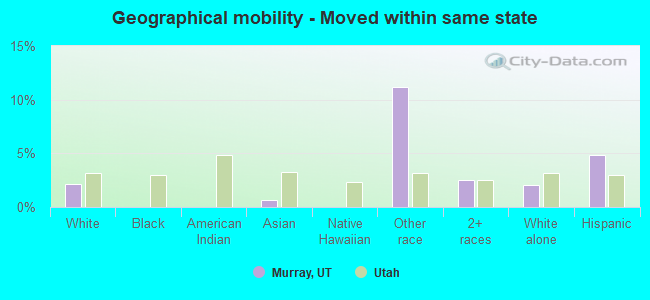
Geographical mobility - Moved from different county within same state (%)
Geographical mobility - Moved from different county within same state (%) - White
Geographical mobility - Moved from different county within same state (%) - Black or African American
Geographical mobility - Moved from different county within same state (%) - Asian
Geographical mobility - Moved from different county within same state (%) - Hispanic or Latino
Geographical mobility - Moved from different county within same state (%) - American Indian and Alaska Native
Geographical mobility - Moved from different county within same state (%) - Multirace
Geographical mobility - Moved from different county within same state (%) - Other Race
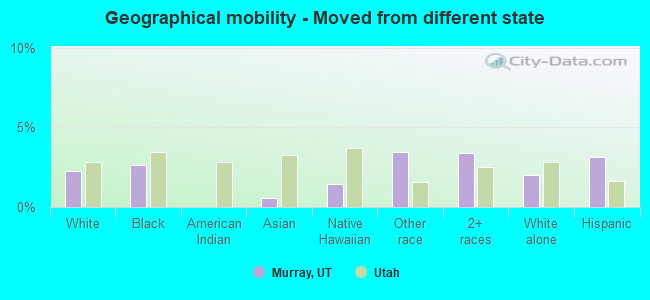
Geographical mobility - Moved from different state (%)
Geographical mobility - Moved from different state (%) - White
Geographical mobility - Moved from different state (%) - Black or African American
Geographical mobility - Moved from different state (%) - Asian
Geographical mobility - Moved from different state (%) - Hispanic or Latino
Geographical mobility - Moved from different state (%) - American Indian and Alaska Native
Geographical mobility - Moved from different state (%) - Multirace
Geographical mobility - Moved from different state (%) - Other Race
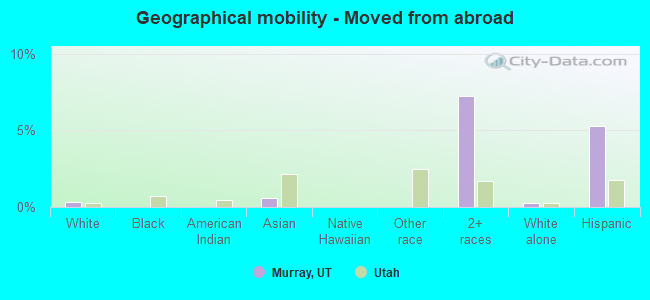
Geographical mobility - Moved from abroad (%)
Geographical mobility - Moved from abroad (%) - White
Geographical mobility - Moved from abroad (%) - Black or African American
Geographical mobility - Moved from abroad (%) - Asian
Geographical mobility - Moved from abroad (%) - Hispanic or Latino
Geographical mobility - Moved from abroad (%) - American Indian and Alaska Native
Geographical mobility - Moved from abroad (%) - Multirace
Geographical mobility - Moved from abroad (%) - Other Race
Place of birth for the foreign-born population - Ireland (%)
Place of birth for the foreign-born population - Denmark (%)
Place of birth for the foreign-born population - Norway (%)
Place of birth for the foreign-born population - Sweden (%)
Place of birth for the foreign-born population - United Kingdom (%)
Place of birth for the foreign-born population - England (%)
Place of birth for the foreign-born population - Scotland (%)
Place of birth for the foreign-born population - Other Northern Europe (%)
Place of birth for the foreign-born population - Austria (%)
Place of birth for the foreign-born population - Belgium (%)
Place of birth for the foreign-born population - France (%)
Place of birth for the foreign-born population - Germany (%)
Place of birth for the foreign-born population - Netherlands (%)
Place of birth for the foreign-born population - Switzerland (%)
Place of birth for the foreign-born population - Other Western Europe (%)
Place of birth for the foreign-born population - Greece (%)
Place of birth for the foreign-born population - Italy (%)
Place of birth for the foreign-born population - Portugal (%)
Place of birth for the foreign-born population - Spain (%)
Place of birth for the foreign-born population - Other Southern Europe (%)
Place of birth for the foreign-born population - Albania (%)
Place of birth for the foreign-born population - Belarus (%)
Place of birth for the foreign-born population - Bosnia and Herzegovina (%)
Place of birth for the foreign-born population - Bulgaria (%)
Place of birth for the foreign-born population - Croatia (%)
Place of birth for the foreign-born population - Czechoslovakia (%)
Place of birth for the foreign-born population - Hungary (%)
Place of birth for the foreign-born population - Latvia (%)
Place of birth for the foreign-born population - Lithuania (%)
Place of birth for the foreign-born population - North Macedonia (Macedonia) (%)
Place of birth for the foreign-born population - Moldova (%)
Place of birth for the foreign-born population - Poland (%)
Place of birth for the foreign-born population - Romania (%)
Place of birth for the foreign-born population - Russia (%)
Place of birth for the foreign-born population - Serbia (%)
Place of birth for the foreign-born population - Ukraine (%)
Place of birth for the foreign-born population - Other Eastern Europe (%)
Place of birth for the foreign-born population - China (%)
Place of birth for the foreign-born population - Hong Kong (%)
Place of birth for the foreign-born population - Taiwan (%)
Place of birth for the foreign-born population - Japan (%)
Place of birth for the foreign-born population - Korea (%)
Place of birth for the foreign-born population - Other Eastern Asia (%)
Place of birth for the foreign-born population - Afghanistan (%)
Place of birth for the foreign-born population - Bangladesh (%)
Place of birth for the foreign-born population - India (%)
Place of birth for the foreign-born population - Iran (%)
Place of birth for the foreign-born population - Kazakhstan (%)
Place of birth for the foreign-born population - Nepal (%)
Place of birth for the foreign-born population - Pakistan (%)
Place of birth for the foreign-born population - Sri Lanka (%)
Place of birth for the foreign-born population - Uzbekistan (%)
Place of birth for the foreign-born population - Other South Central Asia (%)
Place of birth for the foreign-born population - Burma (%)
Place of birth for the foreign-born population - Cambodia (%)
Place of birth for the foreign-born population - Indonesia (%)
Place of birth for the foreign-born population - Laos (%)
Place of birth for the foreign-born population - Malaysia (%)
Place of birth for the foreign-born population - Philippines (%)
Place of birth for the foreign-born population - Singapore (%)
Place of birth for the foreign-born population - Thailand (%)
Place of birth for the foreign-born population - Vietnam (%)
Place of birth for the foreign-born population - Other South Eastern Asia (%)
Place of birth for the foreign-born population - Armenia (%)
Place of birth for the foreign-born population - Iraq (%)
Place of birth for the foreign-born population - Israel (%)
Place of birth for the foreign-born population - Jordan (%)
Place of birth for the foreign-born population - Kuwait (%)
Place of birth for the foreign-born population - Lebanon (%)
Place of birth for the foreign-born population - Saudi Arabia (%)
Place of birth for the foreign-born population - Syria (%)
Place of birth for the foreign-born population - Turkey (%)
Place of birth for the foreign-born population - Yemen (%)
Place of birth for the foreign-born population - Other Western Asia (%)
Place of birth for the foreign-born population - Eritrea (%)
Place of birth for the foreign-born population - Ethiopia (%)
Place of birth for the foreign-born population - Kenya (%)
Place of birth for the foreign-born population - Somalia (%)
Place of birth for the foreign-born population - Uganda (%)
Place of birth for the foreign-born population - Zimbabwe (%)
Place of birth for the foreign-born population - Other Eastern Africa (%)
Place of birth for the foreign-born population - Cameroon (%)
Place of birth for the foreign-born population - Congo (%)
Place of birth for the foreign-born population - Democratic Republic of Congo (Zaire) (%)
Place of birth for the foreign-born population - Other Middle Africa (%)
Place of birth for the foreign-born population - Egypt (%)
Place of birth for the foreign-born population - Morocco (%)
Place of birth for the foreign-born population - Sudan (%)
Place of birth for the foreign-born population - Other Northern Africa (%)
Place of birth for the foreign-born population - South Africa (%)
Place of birth for the foreign-born population - Other Southern Africa (%)
Place of birth for the foreign-born population - Cabo Verde (%)
Place of birth for the foreign-born population - Ghana (%)
Place of birth for the foreign-born population - Liberia (%)
Place of birth for the foreign-born population - Nigeria (%)
Place of birth for the foreign-born population - Senegal (%)
Place of birth for the foreign-born population - Sierra Leone (%)
Place of birth for the foreign-born population - Other Western Africa (%)
Place of birth for the foreign-born population - Australia (%)
Place of birth for the foreign-born population - New Zealand (%)
Place of birth for the foreign-born population - Fiji (%)
Place of birth for the foreign-born population - Micronesia (%)
Place of birth for the foreign-born population - Bahamas (%)
Place of birth for the foreign-born population - Barbados (%)
Place of birth for the foreign-born population - Cuba (%)
Place of birth for the foreign-born population - Dominica (%)
Place of birth for the foreign-born population - Dominican Republic (%)
Place of birth for the foreign-born population - Grenada (%)
Place of birth for the foreign-born population - Haiti (%)
Place of birth for the foreign-born population - Jamaica (%)
Place of birth for the foreign-born population - St. Vincent and the Grenadines (%)
Place of birth for the foreign-born population - Trinidad and Tobago (%)
Place of birth for the foreign-born population - West Indies (%)
Place of birth for the foreign-born population - Other Caribbean (%)
Place of birth for the foreign-born population - Belize (%)
Place of birth for the foreign-born population - Costa Rica (%)
Place of birth for the foreign-born population - El Salvador (%)
Place of birth for the foreign-born population - Guatemala (%)
Place of birth for the foreign-born population - Honduras (%)
Place of birth for the foreign-born population - Mexico (%)
Place of birth for the foreign-born population - Nicaragua (%)
Place of birth for the foreign-born population - Panama (%)
Place of birth for the foreign-born population - Other Central America (%)
Place of birth for the foreign-born population - Argentina (%)
Place of birth for the foreign-born population - Bolivia (%)
Place of birth for the foreign-born population - Brazil (%)
Place of birth for the foreign-born population - Chile (%)
Place of birth for the foreign-born population - Colombia (%)
Place of birth for the foreign-born population - Ecuador (%)
Place of birth for the foreign-born population - Guyana (%)
Place of birth for the foreign-born population - Peru (%)
Place of birth for the foreign-born population - Uruguay (%)
Place of birth for the foreign-born population - Venezuela (%)
Place of birth for the foreign-born population - Other South America (%)
Place of birth for the foreign-born population - Canada (%)
Place of birth for the foreign-born population - Other Northern America (%)
Place of birth for the foreign-born population - Other (%)
Latest news about races in Murray, UT collected exclusively by city-data.com from local newspapers, TV, and radio stations
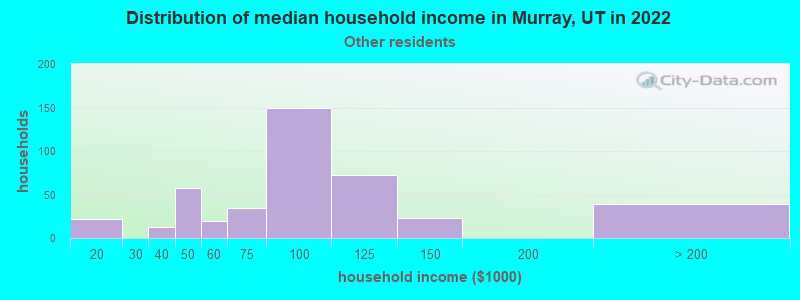
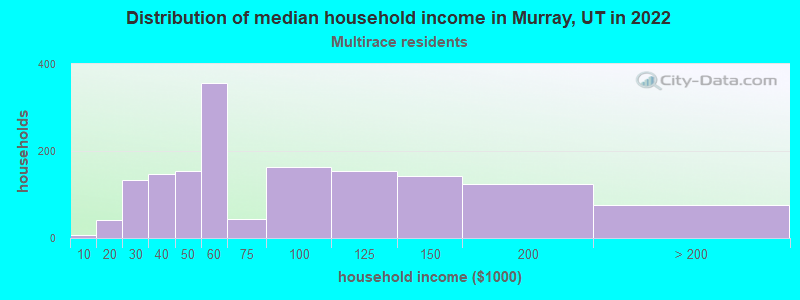
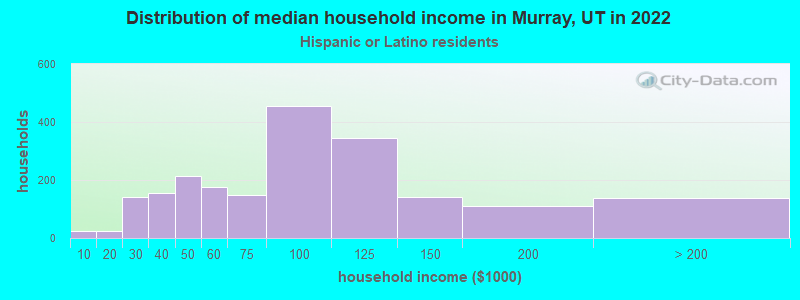
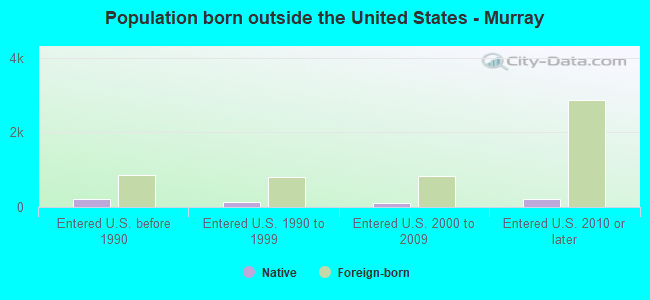
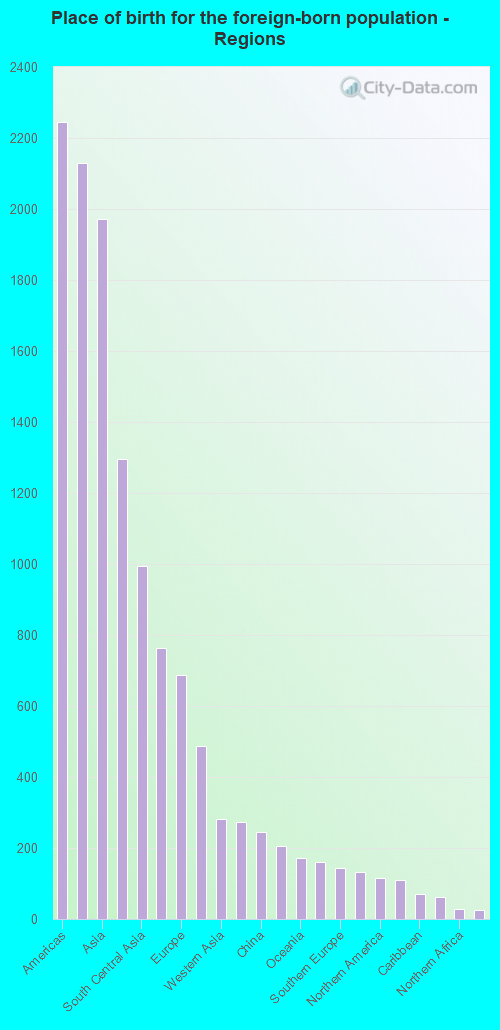
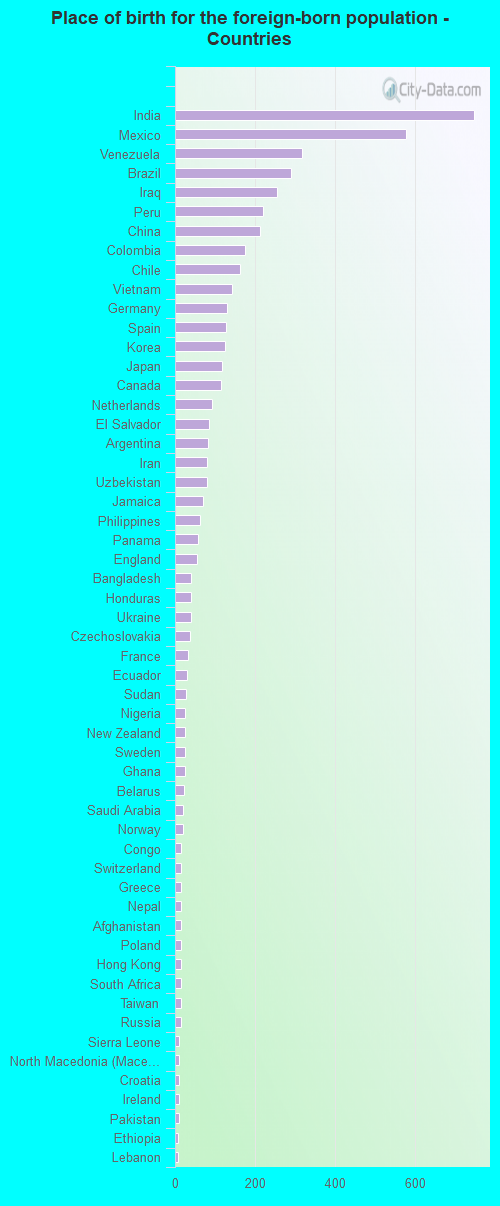
According to 2022 data, the most numerous races in Murray, UT are White alone (38,342 residents), Hispanic (6,288 residents), and Two or more races (2,082 residents). 85.1% of Murray residents speak English at home. 10.4% of Murray, UT residents are foreign-born (4.0% born in Latin America, 3.7% born in Asia, 1.3% born in Europe), which is 22.8% greater than the foreign-born rate of 8.0% across the entire state of Utah.
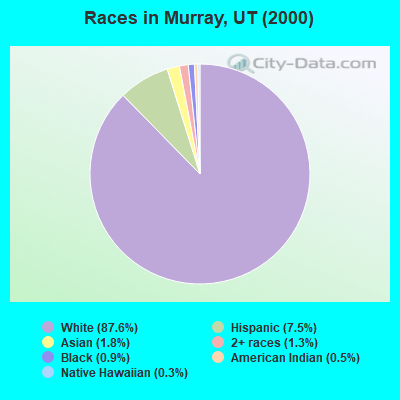
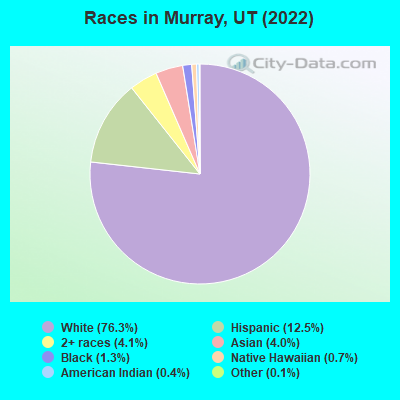
Race distribution in Murray
2000 2022
1,904,265 85.3% White alone 201,559 9.0% Hispanic 36,483 1.6% Asian alone 31,308 1.4% Two or more races 26,663 1.2% American Indian alone 14,806 0.7% Native Hawaiian and Other 16,137 0.7% Black alone 1,948 0.09% Other race alone
2,557,466 75.6% White alone 512,086 15.1% Hispanic 119,308 3.5% Two or more races 82,388 2.4% Asian alone 36,978 1.1% Native Hawaiian and Other 34,873 1.0% Black alone 22,803 0.7% American Indian alone 14,898 0.4% Other race alone
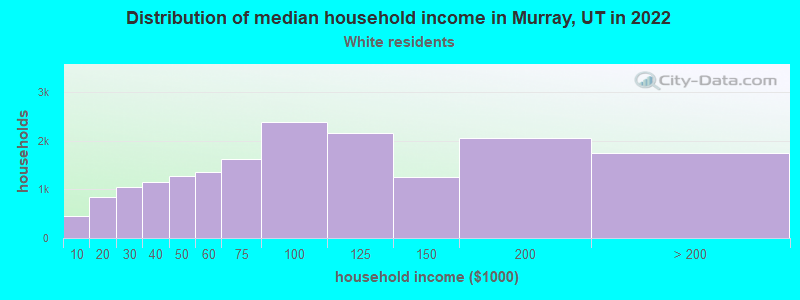
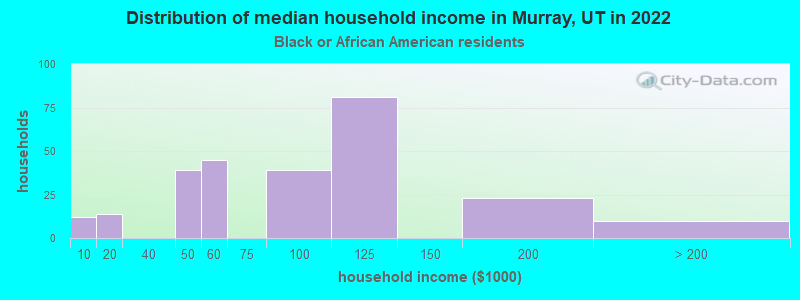
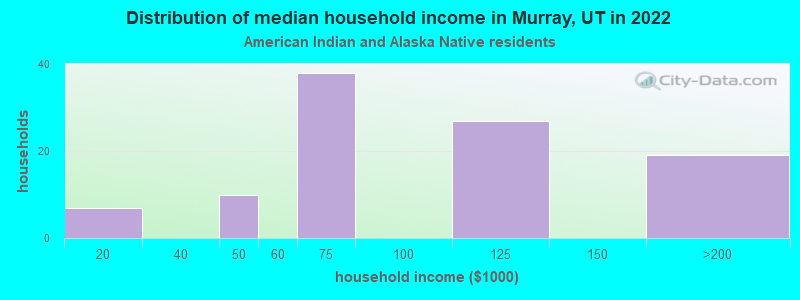
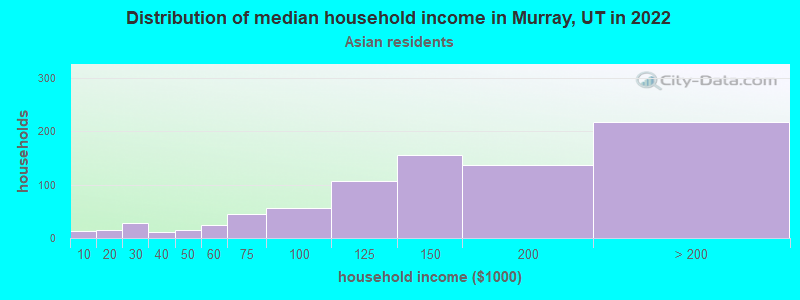
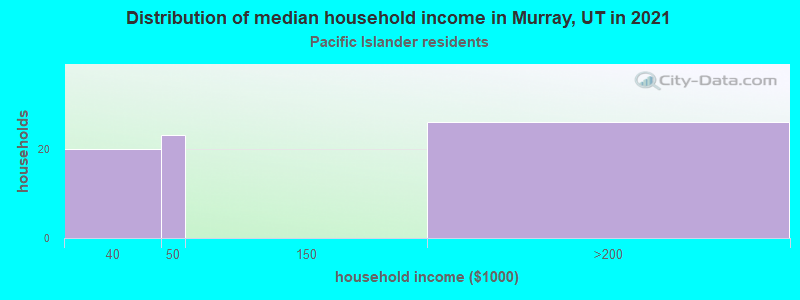
Income and house value in Murray Median household income in 2022 $82,689 White non-Hispanic householders$127,048 Black householders$133,378 Asian householders$85,097 Some other race householders$55,935 Two or more races householders$81,017 Hispanic or Latino race householdersMedian 2022 house value $532,843 White Non-Hispanic householders$453,234 Black or African American householders$418,112 American Indian or Alaska Native householders $627,169 Asian householders$376,301 Native Hawaiian and other Pacific Islander householders$496,718 Some other race householders$436,509 Two or more races householders$534,181 Hispanic or Latino householders
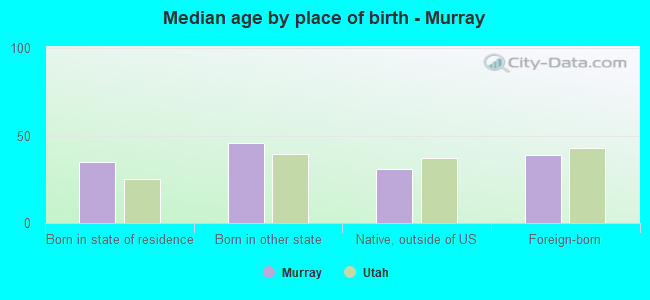
Median age by race in Murray
41.1 Median age for White residents39.6 43.1 38.1 Median age for Black or African American residents32.9 28.2 25.4 Median age for American Indian / Alaska Native residents24.3 41.8 32.8 Median age for Asian residents31.9 34.2 34.9 Median age for Native Hawaiian / Pacific Islander residents46.9 30.6 32.2 Median age for Other race residents35.9 27.6 26.6 Median age for Two or more races residents22.8 27.6 41.8 Median age for White alone residents40.4 43.7 29.2 Median age for Hispanic or Latino residents31.5 27.1
Owner/renter occupied households by race in Murray
House owners and renters - White residents 12,130 69.4% Owner occupied5,339 30.6% Renter occupiedHouse owners and renters - Black or African American residents 158 53.6% Owner occupied137 46.4% Renter occupiedHouse owners and renters - American Indian / Alaska Native residents 28 25.0% Owner occupied85 75.0% Renter occupiedHouse owners and renters - Asian residents 401 49.3% Owner occupied413 50.7% Renter occupiedHouse owners and renters - Native Hawaiian / Pacific Islander residents 32 31.2% Owner occupied71 68.8% Renter occupiedHouse owners and renters - Other race residents 191 40.2% Owner occupied284 59.8% Renter occupiedHouse owners and renters - Two or more races residents 525 34.1% Owner occupied1,016 65.9% Renter occupiedHouse owners and renters - White alone residents 11,877 70.3% Owner occupied5,014 29.7% Renter occupiedHouse owners and renters - Hispanic or Latino residents 824 39.3% Owner occupied1,275 60.7% Renter occupied
Language usage in Murray
English speakers - Total 85.1% of residents of Murray speak English at home.
7.1% of residents speak Spanish at home 2,090 62.0% Speak English very well1,283 38.0% Speak English less than very well7.6% of residents speak other language at home 2,866 78.5% Speak English very well783 21.5% Speak English less than very well
English speakers - Born in the United States 90.9% of residents of Murray speak English at home.
6.3% of residents speak Spanish at home 687 77.3% Speak English very well202 22.7% Speak English less than very well2.6% of residents speak other language at home 365 99.2% Speak English very well3 0.8% Speak English less than very well
English speakers - Native, born elsewhere 65.4% of residents of Murray speak English at home.
10.8% of residents speak Spanish at home 65 100.0% Speak English very well24.6% of residents speak other language at home 148 100.0% Speak English very well
English speakers - Foreign-born 22.0% of residents of Murray speak English at home.
31.4% of residents speak Spanish at home 649 41.9% Speak English very well900 58.1% Speak English less than very well46.0% of residents speak other language at home 1,571 69.1% Speak English very well703 30.9% Speak English less than very well
White (Caucasian) - Speak only English Native:
95.9% (35,626)Foreign-born:
30.8% (337)
White (Caucasian) - Speak another language Native:
4.2% (1,550)Foreign-born:
68.6% (749)
Black or African American - Speak only English Native:
67.0% (389)Foreign-born:
43.1% (42)
Black or African American - Speak another language Native:
34.5% (200)Foreign-born:
62.2% (61)
Asian - Speak only English Native:
58.1% (260)Foreign-born:
10.8% (171)
Asian - Speak another language Native:
40.3% (180)Foreign-born:
88.7% (1,404)
Native Hawaiian / Pacific Islander - Speak only English Native:
56.9% (150)Foreign-born:
59.2% (84)
Native Hawaiian / Pacific Islander - Speak another language Native:
43.9% (116)Foreign-born:
15.8% (22)
Other race - Speak only English Native:
39.4% (272)Foreign-born:
22.8% (140)
Other race - Speak another language Native:
57.9% (400)Foreign-born:
83.5% (514)
Two or more races - Speak only English Native:
84.0% (2,394)Foreign-born:
17.6% (253)
Two or more races - Speak another language Native:
15.9% (453)Foreign-born:
75.7% (1,085)
White alone - Speak only English Native:
95.7% (34,450)Foreign-born:
30.5% (333)
White alone - Speak another language Native:
4.3% (1,564)Foreign-born:
70.5% (768)
Hispanic or Latino - Speak only English Native:
74.2% (2,708)Foreign-born:
5.6% (93)
Hispanic or Latino - Speak another language Native:
27.3% (997)Foreign-born:
93.9% (1,565)
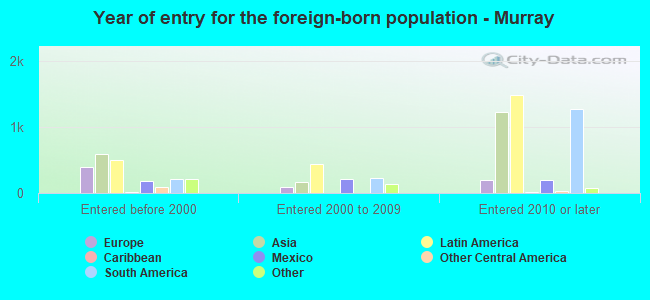
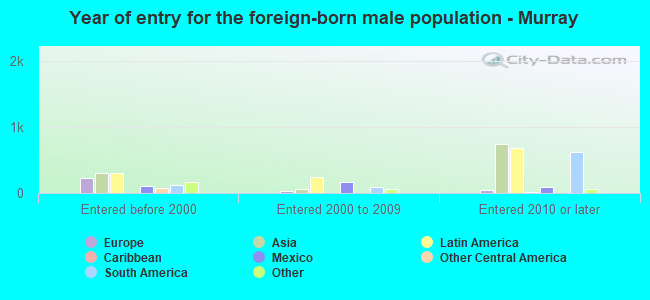
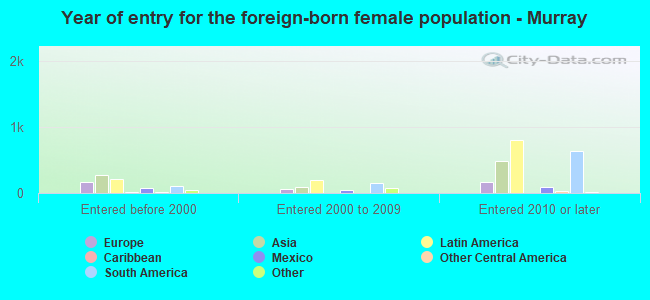
Foreign-born residents in Murray 5,212 residents are foreign born (4.0% Latin America , 3.7% Asia , 1.3% Europe ).
Marital status for residents in Murray Marital status - White (Caucasian) population 15 years and over
Males 33.3% Never married51.6% Now married1.7% Separated1.8% Widowed11.7% DivorcedFemales 25.5% Never married49.1% Now married1.4% Separated9.2% Widowed14.9% DivorcedWomen who gave birth in the past 12 months Now married:
89.9% (338)Unmarried:
10.1% (38)
Women who did not give birth in the past 12 months Now married:
47.6% (4,212)Unmarried:
52.4% (4,637)
Marital status - Black or African American population 15 years and over
Males 44.2% Never married39.0% Now married0.0% Separated0.0% Widowed16.8% DivorcedFemales 27.8% Never married62.7% Now married0.0% Separated0.0% Widowed9.5% DivorcedWomen who gave birth in the past 12 months Now married:
0.0% (0)Unmarried:
100.0% (18)
Women who did not give birth in the past 12 months Now married:
63.9% (74)Unmarried:
36.1% (42)
Marital status - American Indian / Alaska Native population 15 years and over
Males 69.1% Never married18.3% Now married12.6% Separated0.0% Widowed0.0% DivorcedFemales 50.5% Never married39.6% Now married0.0% Separated0.0% Widowed9.9% DivorcedWomen who did not give birth in the past 12 months Now married:
29.1% (34)Unmarried:
70.9% (82)
Marital status - Asian population 15 years and over
Males 49.6% Never married43.9% Now married0.0% Separated0.0% Widowed6.5% DivorcedFemales 35.3% Never married57.3% Now married0.0% Separated3.6% Widowed3.7% DivorcedWomen who gave birth in the past 12 months Now married:
100.0% (1)Unmarried:
0.0% (0)
Women who did not give birth in the past 12 months Now married:
41.3% (224)Unmarried:
58.7% (320)
Marital status - Native Hawaiian / Pacific Islander population 15 years and over
Males 17.4% Never married72.5% Now married10.1% Separated0.0% Widowed0.0% DivorcedFemales 89.7% Never married10.3% Now married0.0% Separated0.0% Widowed0.0% DivorcedWomen who did not give birth in the past 12 months Now married:
10.3% (8)Unmarried:
89.7% (70)
Marital status - Other race population 15 years and over
Males 34.4% Never married51.2% Now married6.1% Separated1.9% Widowed6.3% DivorcedFemales 25.5% Never married50.2% Now married0.0% Separated4.9% Widowed19.5% DivorcedWomen who gave birth in the past 12 months Now married:
0.0% (0)Unmarried:
100.0% (23)
Women who did not give birth in the past 12 months Now married:
56.8% (194)Unmarried:
43.2% (148)
Marital status - Two or more races population 15 years and over
Males 34.7% Never married58.1% Now married2.4% Separated0.1% Widowed4.6% DivorcedFemales 33.4% Never married50.4% Now married1.9% Separated0.0% Widowed14.3% DivorcedWomen who gave birth in the past 12 months Now married:
100.0% (16)Unmarried:
0.0% (0)
Women who did not give birth in the past 12 months Now married:
53.1% (749)Unmarried:
46.9% (662)
Marital status - White alone, not Hispanic / Latino population 15 years and over
Males 32.5% Never married52.4% Now married1.7% Separated1.9% Widowed11.5% DivorcedFemales 25.6% Never married49.2% Now married1.3% Separated9.3% Widowed14.6% DivorcedWomen who gave birth in the past 12 months Now married:
96.9% (346)Unmarried:
3.1% (11)
Women who did not give birth in the past 12 months Now married:
47.5% (4,026)Unmarried:
52.5% (4,457)
Marital status - Hispanic or Latino population 15 years and over
Males 40.8% Never married47.8% Now married2.1% Separated0.6% Widowed8.7% DivorcedFemales 28.2% Never married46.8% Now married2.2% Separated3.7% Widowed19.1% DivorcedWomen who gave birth in the past 12 months Now married:
19.4% (13)Unmarried:
80.6% (52)
Women who did not give birth in the past 12 months Now married:
49.0% (774)Unmarried:
51.0% (805)
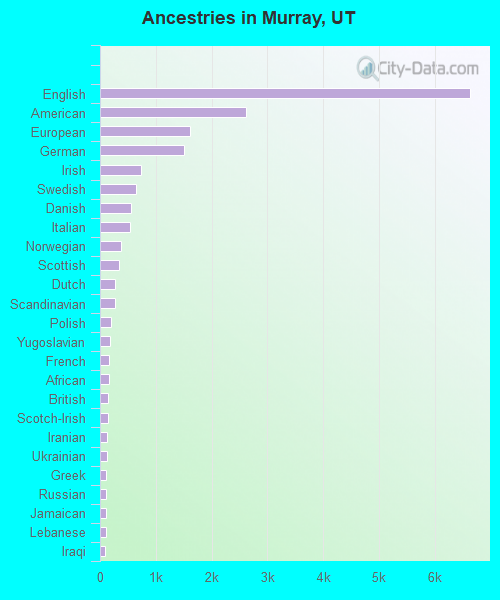
Ancestries in Murray
6,640 25.9% English2,616 10.2% American1,618 6.3% European1,499 5.8% German729 2.8% Irish654 2.6% Swedish555 2.2% Danish533 2.1% Italian371 1.4% Norwegian341 1.3% Scottish275 1.1% Dutch264 1.0% Scandinavian193 0.8% Polish178 0.7% Yugoslavian161 0.6% French153 0.6% African148 0.6% British136 0.5% Scotch-Irish130 0.5% Iranian117 0.5% Ukrainian109 0.4% Greek106 0.4% Russian104 0.4% Jamaican100 0.4% Lebanese95 0.4% Iraqi73 0.3% Northern European52 0.2% Canadian47 0.2% Afghan46 0.2% Welsh42 0.2% Belgian42 0.2% Hungarian40 0.2% Swiss35 0.1% French Canadian33 0.1% Czech30 0.1% Finnish26 0.1% Haitian23 0.09% Armenian21 0.08% Nigerian20 0.08% Slavic17 0.07% Ghanaian17 0.07% Portuguese14 0.05% Eastern European12 0.05% Brazilian12 0.05% Icelander11 0.04% Croatian10 0.04% Serbian10 0.04% Macedonian6 0.02% Romanian6 0.02% Basque4 0.02% Turkish
Geographical mobility in Murray Same house 1 year ago 34,099 86.8% White (Caucasian)729 100.0% Black or African American259 75.4% American Indian / Alaska Native1,932 93.7% Asian312 79.4% Native Hawaiian / Pacific Islander1,136 75.3% Other race3,637 71.9% Two or more races33,425 87.6% White alone, not Hispanic / Latino4,394 71.3% Hispanic or LatinoMoved within same county 3,333 8.5% White / Caucasian8 1.1% Black or African American64 18.5% American Indian / Alaska Native123 6.0% Asian61 15.4% Native Hawaiian / Pacific Islander162 10.7% Other race872 17.2% Two or more races3,099 8.1% White alone, not Hispanic / Latino1,070 17.4% Hispanic or LatinoMoved within same state 832 2.1% White / Caucasian13 0.6% Asian168 11.2% Other race128 2.5% Two or more races767 2.0% White alone, not Hispanic / Latino300 4.9% Hispanic or LatinoMoved from different state 879 2.2% White / Caucasian18 2.6% Black or African American12 0.6% Asian6 1.4% Native Hawaiian / Pacific Islander52 3.5% Other race172 3.4% Two or more races766 2.0% White alone, not Hispanic / Latino195 3.2% Hispanic or LatinoMoved from abroad 127 0.3% White12 0.6% Asian366 7.2% Two or more races96 0.3% White alone, not Hispanic / Latino324 5.3% Hispanic or Latino
Children Nativity (place of birth) in Murray
Children under 6 years - Living with two parents Both parents native 1,642 100.0% NativeBoth parents foreign-born 105 44.8% Native129 55.2% Foreign-bornOne native, one foreign-born parent 175 100.0% NativeChildren under 6 years - Living with one parent Native parent 532 100.0% NativeForeign-born parent 153 88.1% Native21 11.9% Foreign-bornChildren 6 to 17 years - Living with two parents Both parents native 4,028 100.0% Native0 0.0% Foreign-bornBoth parents foreign-born 215 56.0% Native169 44.0% Foreign-bornOne native, one foreign-born parent 510 100.0% NativeChildren 6 to 17 years - Living with one parent Native parent 1,226 100.0% NativeForeign-born parent 323 56.7% Native246 43.3% Foreign-born
Grandparents responsible for own grandchildren in Murray
Grandparents (30 to 59 years) White / Caucasian 15 17.6% Responsible for grandchildren72 82.4% Not responsible for grandchildrenAmerican Indian / Alaska Native 11 100.0% Responsible for grandchildrenNative Hawaiian / Pacific Islander 22 100.0% Not responsible for grandchildrenWhite alone, not Hispanic / Latino 19 19.2% Responsible for grandchildren79 80.8% Not responsible for grandchildrenGrandparents (60 years and over) White / Caucasian 133 34.0% Responsible for grandchildren259 66.0% Not responsible for grandchildrenWhite alone, not Hispanic / Latino 134 32.9% Responsible for grandchildren275 67.1% Not responsible for grandchildren