Races in Mount Lebanon, Pennsylvania (PA) Detailed Stats
Ancestries, Foreign-born residents, place of birth

Recent posts about races in Mount Lebanon, Pennsylvania on our local forum with over 2,400,000 registered users:
 | If John Fetterman was the mayor of Pittsburgh (315 replies) |
| Ideal neighborhood for a young immigrant family to buy a house (20 replies) |
| Pittsburgh best school district (61 replies) |
| Are there any good sites that tell were all these protests are? (89 replies) |
| House In Lincoln Place (10 replies) |
| Is Mount Lebanon in (slight, relative) decline? (59 replies) |
4.4% of Mount Lebanon, PA residents are foreign-born (2.2% born in Europe, 1.6% born in Asia), which is 58.8% less than the foreign-born rate of 7.0% across the entire state of Pennsylvania.
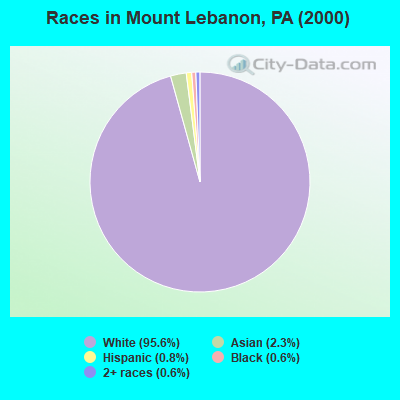
Race distribution in Mount Lebanon

- 31,56995.6%White alone
- 7562.3%Asian alone
- 2630.8%Hispanic
- 2000.6%Black alone
- 1830.6%Two or more races
- 220.07%American Indian alone
- 200.06%Other race alone
- 40.01%Native Hawaiian and Other
Pacific Islander alone
2000
2022
-
- 10,322,45584.1%White alone
- 1,202,4379.8%Black alone
- 394,0883.2%Hispanic
- 218,2961.8%Asian alone
- 113,0970.9%Two or more races
- 13,0860.1%Other race alone
- 14,9040.1%American Indian alone
- 2,6910.02%Native Hawaiian and Other
Pacific Islander alone

-
- 9,487,22873.1%White alone
- 1,311,58110.1%Black alone
- 1,115,9978.6%Hispanic
- 493,9423.8%Two or more races
- 487,1243.8%Asian alone
- 63,5820.5%Other race alone
- 10,1300.08%American Indian alone
- 2,4240.02%Native Hawaiian and Other
Pacific Islander alone

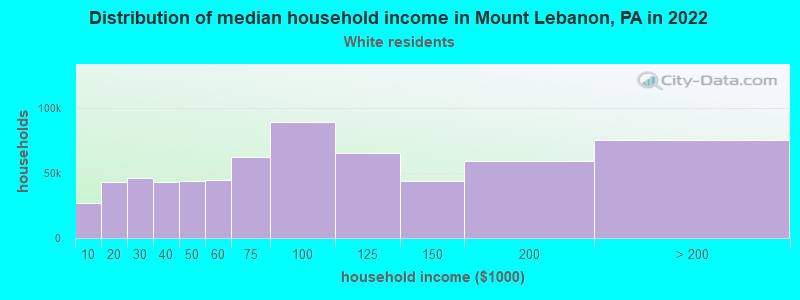
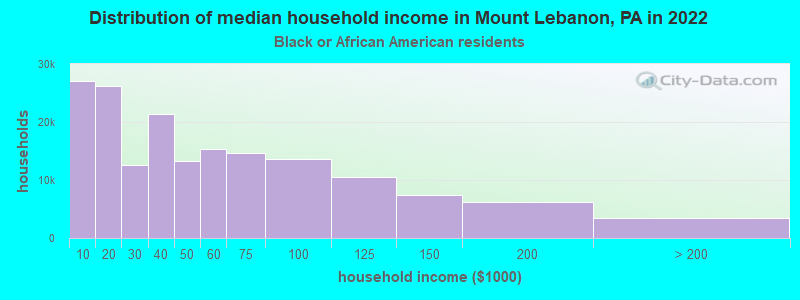
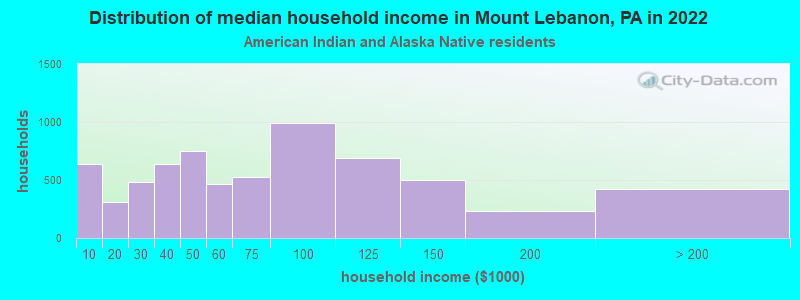
Income and house value in Mount Lebanon
- Median household income in 2022
- $116,289White non-Hispanic householders
- $112,480Black householders
- $35,484American Indian and Alaska Native householders
- $109,086Asian householders
- $124,087Some other race householders
- $118,284Two or more races householders
- $109,665Hispanic or Latino race householders
- Median 2022 house value
- $386,846White Non-Hispanic householders
- $240,816Black or African American householders
- $39,029American Indian or Alaska Native householders
- $362,419Asian householders
- $127,178Some other race householders
- $220,637Two or more races householders
- $363,481Hispanic or Latino householders
Household income for White non-Hispanic householders
Household income for Black householders
Household income for American Indian and Alaska Native householders
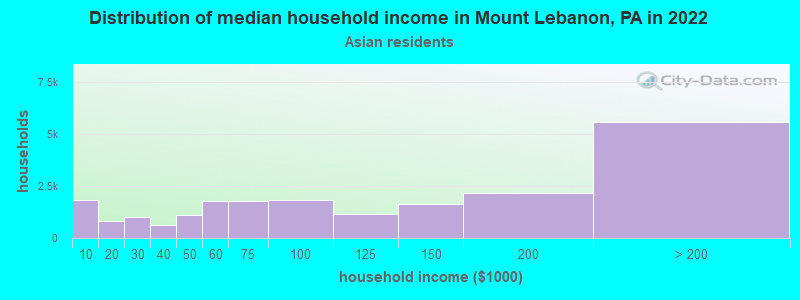
Household income for Asian householders
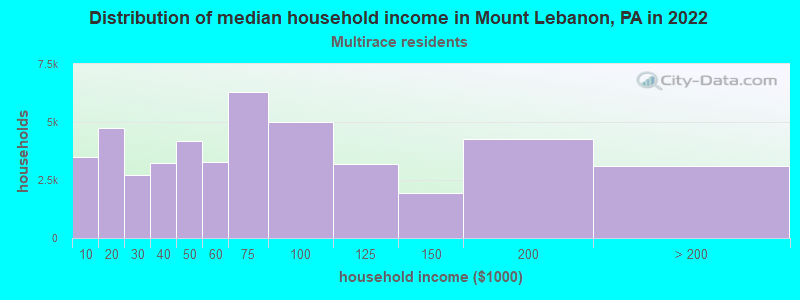
Household income for Two or more races householders
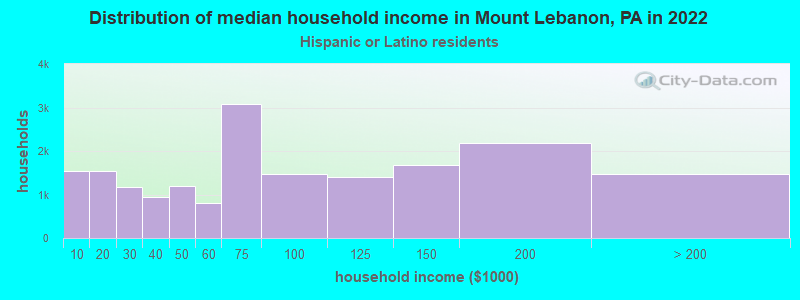
Household income for Hispanic or Latino race householders
Foreign-born residents in Mount Lebanon
1,455 residents are foreign born (2.2% Europe, 1.6% Asia).
| This city: | 4.4% |
| Pennsylvania: | 4.1% |
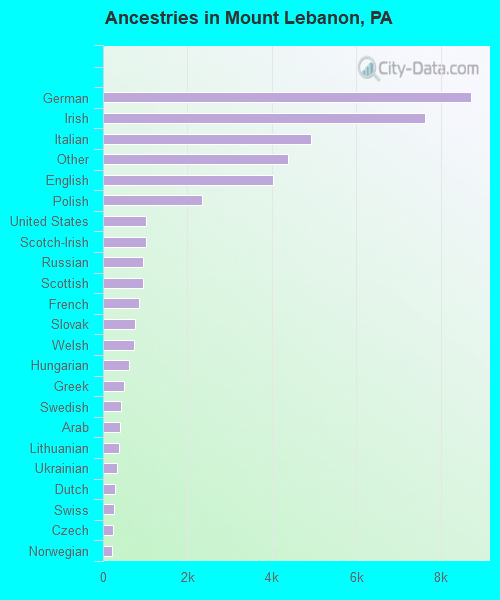
Ancestries in Mount Lebanon

- 8,70620.7%German
- 7,63018.1%Irish
- 4,91511.7%Italian
- 4,39110.4%Other
- 4,0309.6%English
- 2,3505.6%Polish
- 1,0182.4%United States
- 1,0172.4%Scotch-Irish
- 9422.2%Russian
- 9402.2%Scottish
- 8422.0%French
- 7501.8%Slovak
- 7391.8%Welsh
- 6041.4%Hungarian
- 5061.2%Greek
- 4191.0%Swedish
- 4101.0%Arab
- 3830.9%Lithuanian
- 3200.8%Ukrainian
- 2900.7%Dutch
- 2540.6%Swiss
- 2420.6%Czech
- 2140.5%Norwegian
- 740.2%Danish
- 540.1%French Canadian
- 160.04%Portuguese
- 110.03%Subsaharan African
Zip codes: 15228.