Races in Mount Kisco, New York (NY) Detailed Stats
Data:
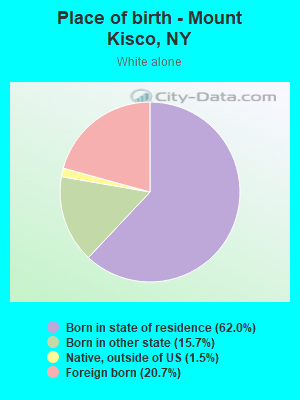
Races - White alone (%)
Races - White alone (% change since 2000)
Races - Black alone (%)
Races - Black alone (% change since 2000)
Races - American Indian alone (%)
Races - American Indian alone (% change since 2000)
Races - Asian alone (%)
Races - Asian alone (% change since 2000)
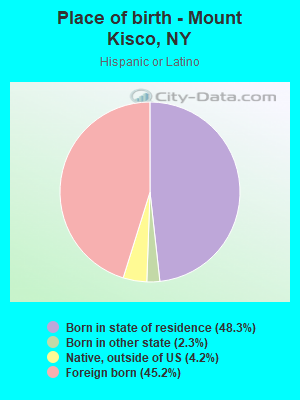
Races - Hispanic (%)
Races - Hispanic (% change since 2000)
Races - Native Hawaiian and Other Pacific Islander alone (%)
Races - Native Hawaiian and Other Pacific Islander alone (% change since 2000)
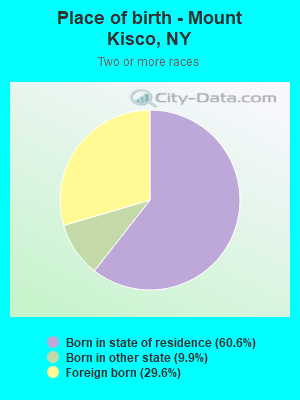
Races - Two or more races(%)
Races - Two or more races(% change since 2000)
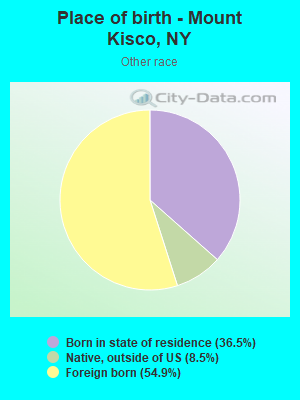
Races - Other race alone (%)
Races - Other race alone (% change since 2000)
Racial diversity
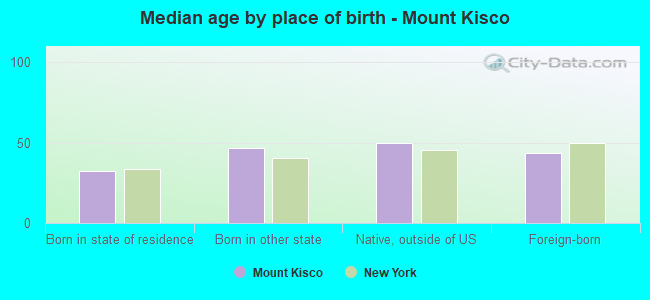
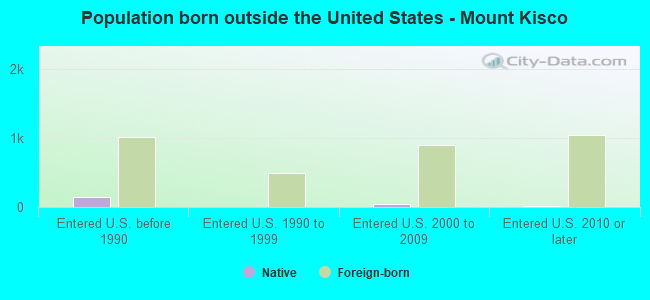
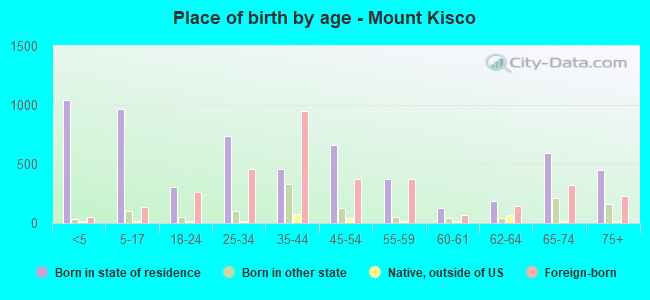
Place of birth - Born in state of residence (%)
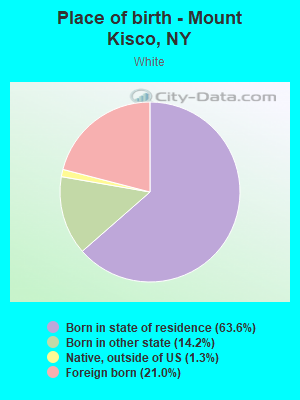
Place of birth - Born in state of residence (%) - White
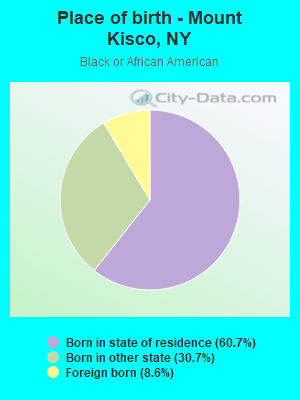
Place of birth - Born in state of residence (%) - Black or African American
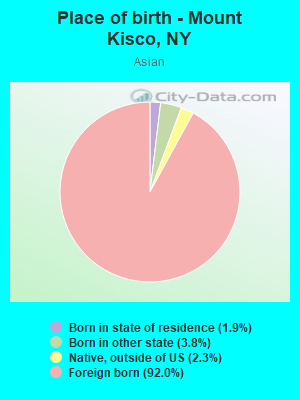
Place of birth - Born in state of residence (%) - Asian
Place of birth - Born in state of residence (%) - Hispanic or Latino
Place of birth - Born in state of residence (%) - American Indian and Alaska Native
Place of birth - Born in state of residence (%) - Multirace
Place of birth - Born in state of residence (%) - Other Race
Place of birth - Born in other state (%)
Place of birth - Born in other state (%) - White
Place of birth - Born in other state (%) - Black or African American
Place of birth - Born in other state (%) - Asian
Place of birth - Born in other state (%) - Hispanic or Latino
Place of birth - Born in other state (%) - American Indian and Alaska Native
Place of birth - Born in other state (%) - Multirace
Place of birth - Born in other state (%) - Other Race
Place of birth - Native, outside of US (%)
Place of birth - Native, outside of US (%) - White
Place of birth - Native, outside of US (%) - Black or African American
Place of birth - Native, outside of US (%) - Asian
Place of birth - Native, outside of US (%) - Hispanic or Latino
Place of birth - Native, outside of US (%) - American Indian and Alaska Native
Place of birth - Native, outside of US (%) - Multirace
Place of birth - Native, outside of US (%) - Other Race
Place of birth - Foreign born (%)
Place of birth - Foreign born (%) - White
Place of birth - Foreign born (%) - Black or African American
Place of birth - Foreign born (%) - Asian
Place of birth - Foreign born (%) - Hispanic or Latino
Place of birth - Foreign born (%) - American Indian and Alaska Native
Place of birth - Foreign born (%) - Multirace
Place of birth - Foreign born (%) - Other Race
Residents speaking English at home (%)
Residents speaking English at home - Born in the United States (%)
Residents speaking English at home - Native, born elsewhere (%)
Residents speaking English at home - Foreign born (%)
Residents speaking Spanish at home (%)
Residents speaking Spanish at home - Born in the United States (%)
Residents speaking Spanish at home - Native, born elsewhere (%)
Residents speaking Spanish at home - Foreign born (%)
Residents speaking other language at home (%)
Residents speaking other language at home - Born in the United States (%)
Residents speaking other language at home - Native, born elsewhere (%)
Residents speaking other language at home - Foreign born (%)
Marital status - Never married (%)
Marital status - Now married (%)
Marital status - Separated (%)
Marital status - Widowed (%)
Marital status - Divorced (%)
Ancestries Reported - Arab (%)
Ancestries Reported - Czech (%)
Ancestries Reported - Danish (%)
Ancestries Reported - Dutch (%)
Ancestries Reported - English (%)
Ancestries Reported - French (%)
Ancestries Reported - French Canadian (%)
Ancestries Reported - German (%)
Ancestries Reported - Greek (%)
Ancestries Reported - Hungarian (%)
Ancestries Reported - Irish (%)
Ancestries Reported - Italian (%)
Ancestries Reported - Lithuanian (%)
Ancestries Reported - Norwegian (%)
Ancestries Reported - Polish (%)
Ancestries Reported - Portuguese (%)
Ancestries Reported - Russian (%)
Ancestries Reported - Scotch-Irish (%)
Ancestries Reported - Scottish (%)
Ancestries Reported - Slovak (%)
Ancestries Reported - Subsaharan African (%)
Ancestries Reported - Swedish (%)
Ancestries Reported - Swiss (%)
Ancestries Reported - Ukrainian (%)
Ancestries Reported - United States (%)
Ancestries Reported - Welsh (%)
Ancestries Reported - West Indian (%)
Ancestries Reported - Other (%)
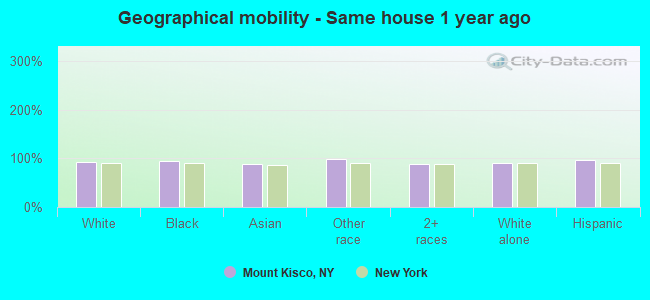
Geographical mobility - Same house 1 year ago (%)
Geographical mobility - Same house 1 year ago (%) - White
Geographical mobility - Same house 1 year ago (%) - Black or African American
Geographical mobility - Same house 1 year ago (%) - Asian
Geographical mobility - Same house 1 year ago (%) - Hispanic or Latino
Geographical mobility - Same house 1 year ago (%) - American Indian and Alaska Native
Geographical mobility - Same house 1 year ago (%) - Multirace
Geographical mobility - Same house 1 year ago (%) - Other Race
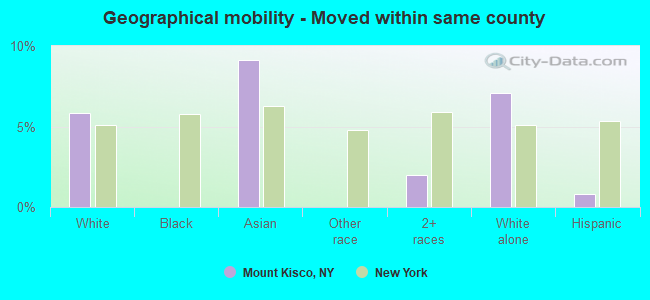
Geographical mobility - Moved within same county (%)
Geographical mobility - Moved within same county (%) - White
Geographical mobility - Moved within same county (%) - Black or African American
Geographical mobility - Moved within same county (%) - Asian
Geographical mobility - Moved within same county (%) - Hispanic or Latino
Geographical mobility - Moved within same county (%) - American Indian and Alaska Native
Geographical mobility - Moved within same county (%) - Multirace
Geographical mobility - Moved within same county (%) - Other Race
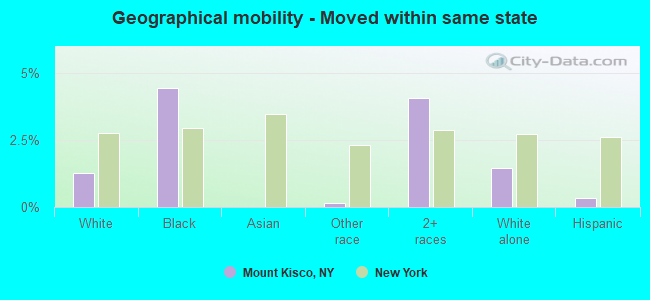
Geographical mobility - Moved from different county within same state (%)
Geographical mobility - Moved from different county within same state (%) - White
Geographical mobility - Moved from different county within same state (%) - Black or African American
Geographical mobility - Moved from different county within same state (%) - Asian
Geographical mobility - Moved from different county within same state (%) - Hispanic or Latino
Geographical mobility - Moved from different county within same state (%) - American Indian and Alaska Native
Geographical mobility - Moved from different county within same state (%) - Multirace
Geographical mobility - Moved from different county within same state (%) - Other Race
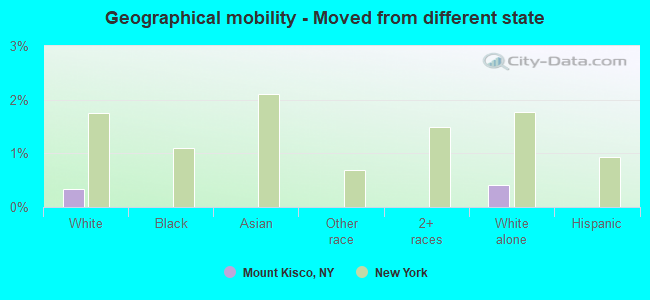
Geographical mobility - Moved from different state (%)
Geographical mobility - Moved from different state (%) - White
Geographical mobility - Moved from different state (%) - Black or African American
Geographical mobility - Moved from different state (%) - Asian
Geographical mobility - Moved from different state (%) - Hispanic or Latino
Geographical mobility - Moved from different state (%) - American Indian and Alaska Native
Geographical mobility - Moved from different state (%) - Multirace
Geographical mobility - Moved from different state (%) - Other Race
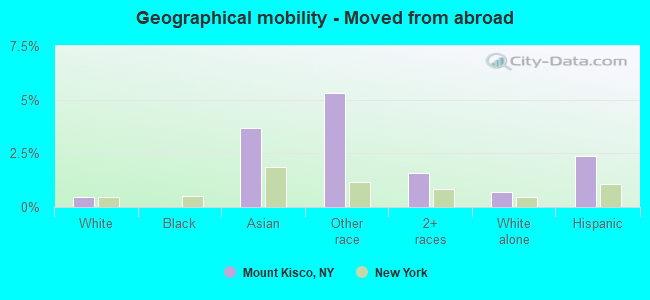
Geographical mobility - Moved from abroad (%)
Geographical mobility - Moved from abroad (%) - White
Geographical mobility - Moved from abroad (%) - Black or African American
Geographical mobility - Moved from abroad (%) - Asian
Geographical mobility - Moved from abroad (%) - Hispanic or Latino
Geographical mobility - Moved from abroad (%) - American Indian and Alaska Native
Geographical mobility - Moved from abroad (%) - Multirace
Geographical mobility - Moved from abroad (%) - Other Race
Place of birth for the foreign-born population - Ireland (%)
Place of birth for the foreign-born population - Denmark (%)
Place of birth for the foreign-born population - Norway (%)
Place of birth for the foreign-born population - Sweden (%)
Place of birth for the foreign-born population - United Kingdom (%)
Place of birth for the foreign-born population - England (%)
Place of birth for the foreign-born population - Scotland (%)
Place of birth for the foreign-born population - Other Northern Europe (%)
Place of birth for the foreign-born population - Austria (%)
Place of birth for the foreign-born population - Belgium (%)
Place of birth for the foreign-born population - France (%)
Place of birth for the foreign-born population - Germany (%)
Place of birth for the foreign-born population - Netherlands (%)
Place of birth for the foreign-born population - Switzerland (%)
Place of birth for the foreign-born population - Other Western Europe (%)
Place of birth for the foreign-born population - Greece (%)
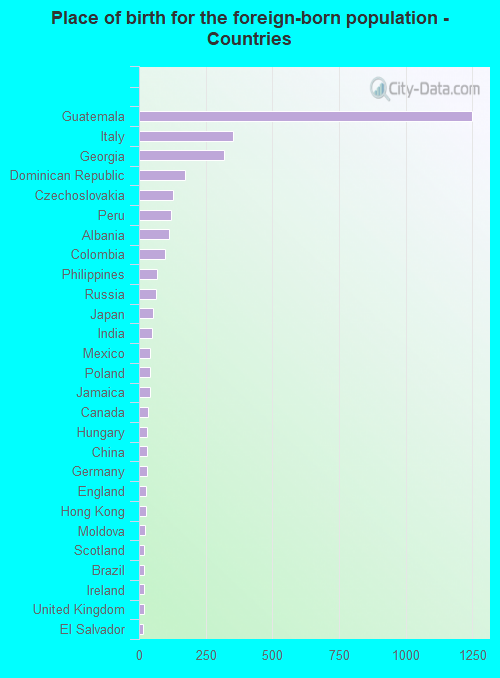
Place of birth for the foreign-born population - Italy (%)
Place of birth for the foreign-born population - Portugal (%)
Place of birth for the foreign-born population - Spain (%)
Place of birth for the foreign-born population - Other Southern Europe (%)
Place of birth for the foreign-born population - Albania (%)
Place of birth for the foreign-born population - Belarus (%)
Place of birth for the foreign-born population - Bosnia and Herzegovina (%)
Place of birth for the foreign-born population - Bulgaria (%)
Place of birth for the foreign-born population - Croatia (%)
Place of birth for the foreign-born population - Czechoslovakia (%)
Place of birth for the foreign-born population - Hungary (%)
Place of birth for the foreign-born population - Latvia (%)
Place of birth for the foreign-born population - Lithuania (%)
Place of birth for the foreign-born population - North Macedonia (Macedonia) (%)
Place of birth for the foreign-born population - Moldova (%)
Place of birth for the foreign-born population - Poland (%)
Place of birth for the foreign-born population - Romania (%)
Place of birth for the foreign-born population - Russia (%)
Place of birth for the foreign-born population - Serbia (%)
Place of birth for the foreign-born population - Ukraine (%)
Place of birth for the foreign-born population - Other Eastern Europe (%)
Place of birth for the foreign-born population - China (%)
Place of birth for the foreign-born population - Hong Kong (%)
Place of birth for the foreign-born population - Taiwan (%)
Place of birth for the foreign-born population - Japan (%)
Place of birth for the foreign-born population - Korea (%)
Place of birth for the foreign-born population - Other Eastern Asia (%)
Place of birth for the foreign-born population - Afghanistan (%)
Place of birth for the foreign-born population - Bangladesh (%)
Place of birth for the foreign-born population - India (%)
Place of birth for the foreign-born population - Iran (%)
Place of birth for the foreign-born population - Kazakhstan (%)
Place of birth for the foreign-born population - Nepal (%)
Place of birth for the foreign-born population - Pakistan (%)
Place of birth for the foreign-born population - Sri Lanka (%)
Place of birth for the foreign-born population - Uzbekistan (%)
Place of birth for the foreign-born population - Other South Central Asia (%)
Place of birth for the foreign-born population - Burma (%)
Place of birth for the foreign-born population - Cambodia (%)
Place of birth for the foreign-born population - Indonesia (%)
Place of birth for the foreign-born population - Laos (%)
Place of birth for the foreign-born population - Malaysia (%)
Place of birth for the foreign-born population - Philippines (%)
Place of birth for the foreign-born population - Singapore (%)
Place of birth for the foreign-born population - Thailand (%)
Place of birth for the foreign-born population - Vietnam (%)
Place of birth for the foreign-born population - Other South Eastern Asia (%)
Place of birth for the foreign-born population - Armenia (%)
Place of birth for the foreign-born population - Iraq (%)
Place of birth for the foreign-born population - Israel (%)
Place of birth for the foreign-born population - Jordan (%)
Place of birth for the foreign-born population - Kuwait (%)
Place of birth for the foreign-born population - Lebanon (%)
Place of birth for the foreign-born population - Saudi Arabia (%)
Place of birth for the foreign-born population - Syria (%)
Place of birth for the foreign-born population - Turkey (%)
Place of birth for the foreign-born population - Yemen (%)
Place of birth for the foreign-born population - Other Western Asia (%)
Place of birth for the foreign-born population - Eritrea (%)
Place of birth for the foreign-born population - Ethiopia (%)
Place of birth for the foreign-born population - Kenya (%)
Place of birth for the foreign-born population - Somalia (%)
Place of birth for the foreign-born population - Uganda (%)
Place of birth for the foreign-born population - Zimbabwe (%)
Place of birth for the foreign-born population - Other Eastern Africa (%)
Place of birth for the foreign-born population - Cameroon (%)
Place of birth for the foreign-born population - Congo (%)
Place of birth for the foreign-born population - Democratic Republic of Congo (Zaire) (%)
Place of birth for the foreign-born population - Other Middle Africa (%)
Place of birth for the foreign-born population - Egypt (%)
Place of birth for the foreign-born population - Morocco (%)
Place of birth for the foreign-born population - Sudan (%)
Place of birth for the foreign-born population - Other Northern Africa (%)
Place of birth for the foreign-born population - South Africa (%)
Place of birth for the foreign-born population - Other Southern Africa (%)
Place of birth for the foreign-born population - Cabo Verde (%)
Place of birth for the foreign-born population - Ghana (%)
Place of birth for the foreign-born population - Liberia (%)
Place of birth for the foreign-born population - Nigeria (%)
Place of birth for the foreign-born population - Senegal (%)
Place of birth for the foreign-born population - Sierra Leone (%)
Place of birth for the foreign-born population - Other Western Africa (%)
Place of birth for the foreign-born population - Australia (%)
Place of birth for the foreign-born population - New Zealand (%)
Place of birth for the foreign-born population - Fiji (%)
Place of birth for the foreign-born population - Micronesia (%)
Place of birth for the foreign-born population - Bahamas (%)
Place of birth for the foreign-born population - Barbados (%)
Place of birth for the foreign-born population - Cuba (%)
Place of birth for the foreign-born population - Dominica (%)
Place of birth for the foreign-born population - Dominican Republic (%)
Place of birth for the foreign-born population - Grenada (%)
Place of birth for the foreign-born population - Haiti (%)
Place of birth for the foreign-born population - Jamaica (%)
Place of birth for the foreign-born population - St. Vincent and the Grenadines (%)
Place of birth for the foreign-born population - Trinidad and Tobago (%)
Place of birth for the foreign-born population - West Indies (%)
Place of birth for the foreign-born population - Other Caribbean (%)
Place of birth for the foreign-born population - Belize (%)
Place of birth for the foreign-born population - Costa Rica (%)
Place of birth for the foreign-born population - El Salvador (%)
Place of birth for the foreign-born population - Guatemala (%)
Place of birth for the foreign-born population - Honduras (%)
Place of birth for the foreign-born population - Mexico (%)
Place of birth for the foreign-born population - Nicaragua (%)
Place of birth for the foreign-born population - Panama (%)
Place of birth for the foreign-born population - Other Central America (%)
Place of birth for the foreign-born population - Argentina (%)
Place of birth for the foreign-born population - Bolivia (%)
Place of birth for the foreign-born population - Brazil (%)
Place of birth for the foreign-born population - Chile (%)
Place of birth for the foreign-born population - Colombia (%)
Place of birth for the foreign-born population - Ecuador (%)
Place of birth for the foreign-born population - Guyana (%)
Place of birth for the foreign-born population - Peru (%)
Place of birth for the foreign-born population - Uruguay (%)
Place of birth for the foreign-born population - Venezuela (%)
Place of birth for the foreign-born population - Other South America (%)
Place of birth for the foreign-born population - Canada (%)
Place of birth for the foreign-born population - Other Northern America (%)
Place of birth for the foreign-born population - Other (%)
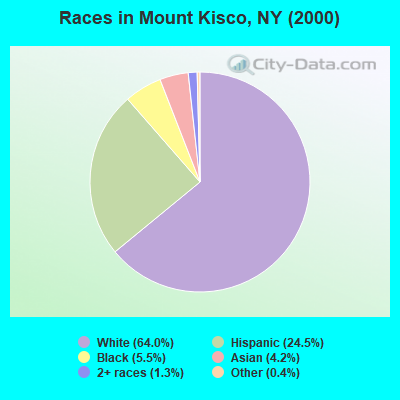
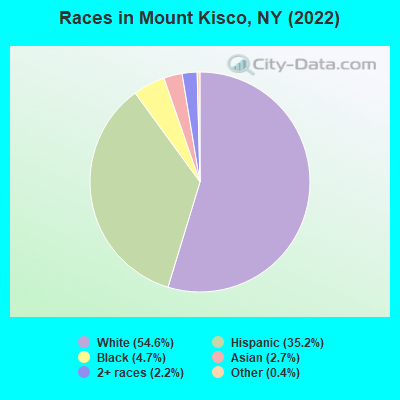
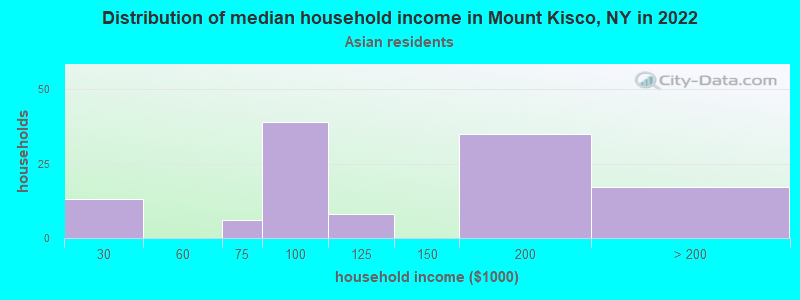
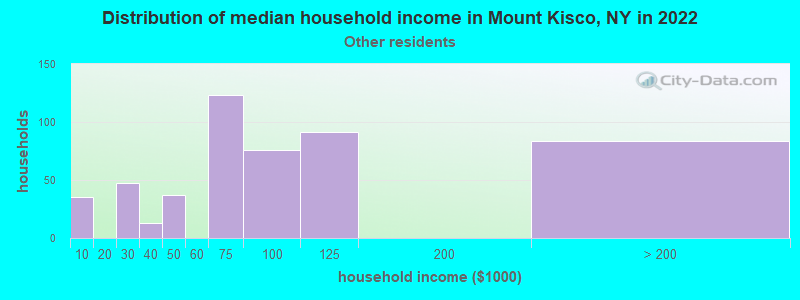
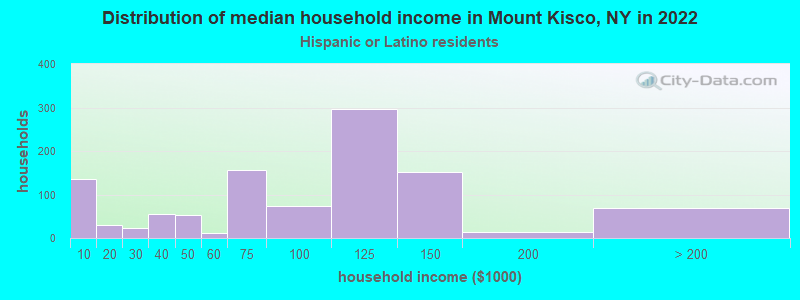
According to 2022 data, the most numerous races in Mount Kisco, NY are White alone (5,874 residents), Hispanic (3,789 residents), and Black alone (506 residents). 53.5% of Mount Kisco residents speak English at home. 31.3% of Mount Kisco, NY residents are foreign-born (16.5% born in Latin America, 9.3% born in Europe, 5.2% born in Asia), which is 29.7% greater than the foreign-born rate of 22.0% across the entire state of New York.
Race distribution in Mount Kisco
2000 2022
11,760,981 62.0% White alone 2,867,583 15.1% Hispanic 2,812,623 14.8% Black alone 1,035,926 5.5% Asian alone 366,116 1.9% Two or more races 75,499 0.4% Other race alone 52,499 0.3% American Indian alone 5,230 0.03% Native Hawaiian and Other
10,408,933 52.9% White alone 3,867,299 19.7% Hispanic 2,633,840 13.4% Black alone 1,776,286 9.0% Asian alone 732,670 3.7% Two or more races 216,110 1.1% Other race alone 35,082 0.2% American Indian alone 6,931 0.04% Native Hawaiian and Other
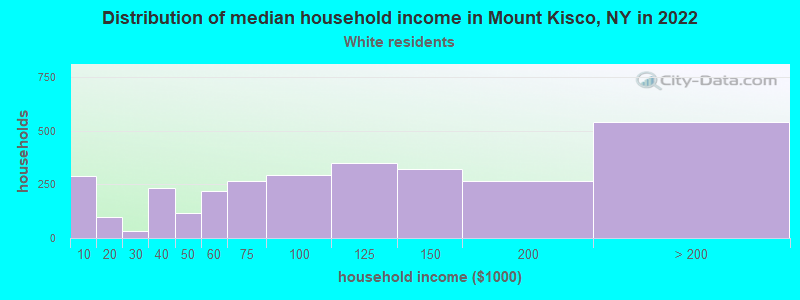
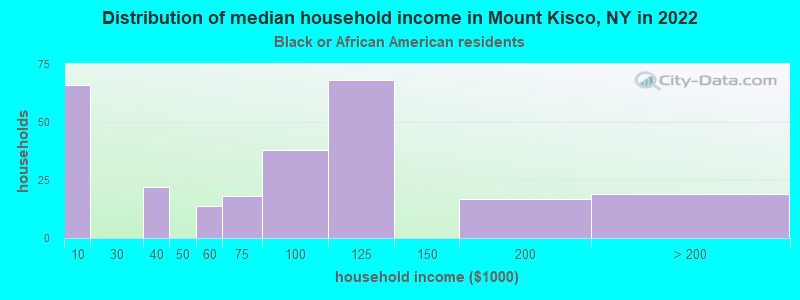
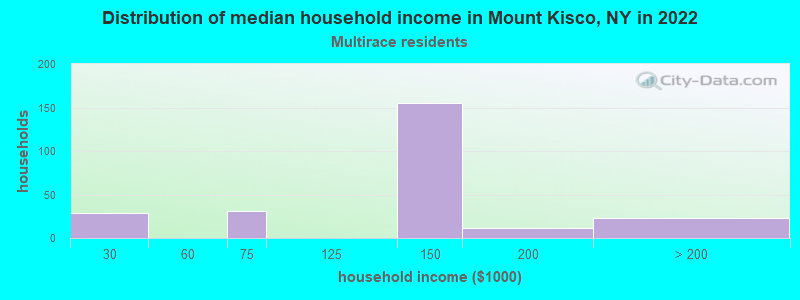
Income and house value in Mount Kisco Median household income in 2022 $93,127 White non-Hispanic householders$73,917 Black householders$122,084 Asian householders$71,290 Some other race householders$115,382 Two or more races householders$92,287 Hispanic or Latino race householdersMedian 2022 house value $616,283 White Non-Hispanic householders$479,641 Black or African American householders $604,485 Asian householders$549,786 Two or more races householders$575,098 Hispanic or Latino householders
Median age by race in Mount Kisco
47.1 Median age for White residents46.6 49.3 37.2 Median age for Black or African American residents52.8 21.3 -641,441,440.8 Median age for American Indian / Alaska Native residents-664,804,468.6 -554,999,999.4 52.5 Median age for Asian residents48.2 56.6 -487,992,314.6 Median age for Native Hawaiian / Pacific Islander residents-477,502,295.2 -666,666,666.0 33.1 Median age for Other race residents32.9 37.0 32.9 Median age for Two or more races residents31.8 33.1 48.6 Median age for White alone residents46.2 52.2 32.7 Median age for Hispanic or Latino residents33.0 32.1
Owner/renter occupied households by race in Mount Kisco
House owners and renters - White residents 2,438 80.5% Owner occupied592 19.5% Renter occupiedHouse owners and renters - Black or African American residents 91 36.5% Owner occupied158 63.5% Renter occupiedHouse owners and renters - Asian residents 110 86.8% Owner occupied17 13.2% Renter occupiedHouse owners and renters - Other race residents 109 21.8% Owner occupied389 78.2% Renter occupiedHouse owners and renters - Two or more races residents 204 81.6% Owner occupied46 18.4% Renter occupiedHouse owners and renters - White alone residents 2,302 83.8% Owner occupied445 16.2% Renter occupiedHouse owners and renters - Hispanic or Latino residents 421 39.7% Owner occupied639 60.3% Renter occupied
Language usage in Mount Kisco
English speakers - Total 53.5% of residents of Mount Kisco speak English at home.
28.4% of residents speak Spanish at home 1,517 55.7% Speak English very well1,205 44.3% Speak English less than very well17.9% of residents speak other language at home 1,075 62.6% Speak English very well642 37.4% Speak English less than very well
English speakers - Born in the United States 94.8% of residents of Mount Kisco speak English at home.
5.4% of residents speak Spanish at home 65 100.0% Speak English very well0.7% of residents speak other language at home 9 100.0% Speak English very well
English speakers - Native, born elsewhere 30.7% of residents of Mount Kisco speak English at home.
73.3% of residents speak Spanish at home 165 100.0% Speak English very well4.0% of residents speak other language at home 9 100.0% Speak English very well
English speakers - Foreign-born 9.7% of residents of Mount Kisco speak English at home.
50.2% of residents speak Spanish at home 537 32.2% Speak English very well1,132 67.8% Speak English less than very well37.8% of residents speak other language at home 716 57.0% Speak English very well540 43.0% Speak English less than very well
White (Caucasian) - Speak only English Native:
89.6% (4,047)Foreign-born:
15.8% (206)
White (Caucasian) - Speak another language Native:
9.9% (448)Foreign-born:
76.9% (1,001)
Black or African American - Speak only English Native:
87.5% (427)Foreign-born:
69.4% (36)
Black or African American - Speak another language Native:
11.4% (56)Foreign-born:
31.0% (16)
Asian - Speak another language Native:
100.0% (25)Foreign-born:
85.2% (223)
Other race - Speak another language Native:
100.0% (709)Foreign-born:
96.8% (1,085)
Two or more races - Speak only English Native:
49.8% (254)Foreign-born:
5.8% (18)
Two or more races - Speak another language Native:
49.7% (253)Foreign-born:
94.8% (287)
White alone - Speak only English Native:
90.2% (3,829)Foreign-born:
18.3% (209)
White alone - Speak another language Native:
9.5% (403)Foreign-born:
78.0% (892)
Hispanic or Latino - Speak only English Native:
32.3% (456)Foreign-born:
1.0% (16)
Hispanic or Latino - Speak another language Native:
68.1% (962)Foreign-born:
97.6% (1,678)
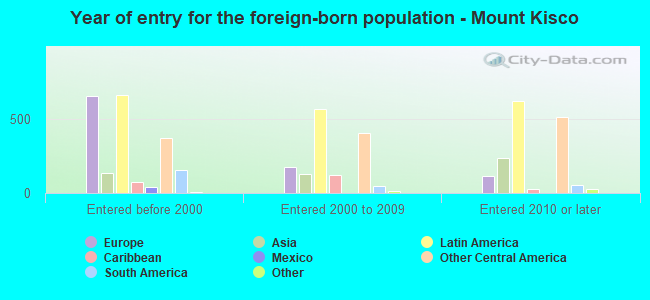
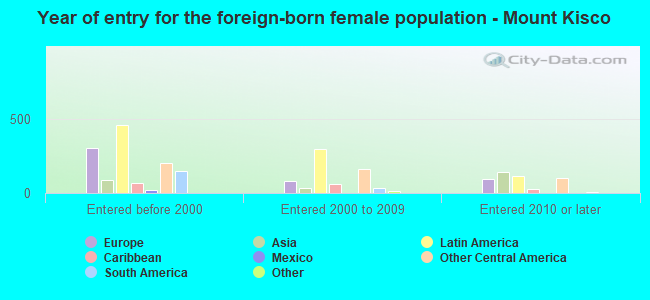
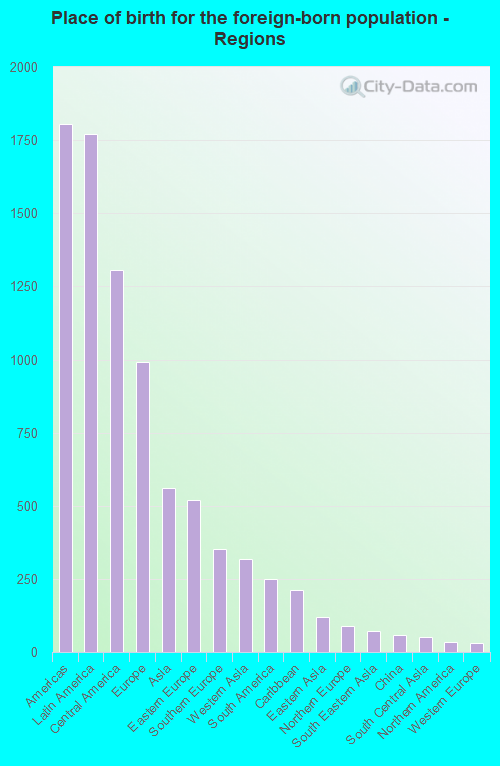
Foreign-born residents in Mount Kisco 3,365 residents are foreign born (16.5% Latin America , 9.3% Europe , 5.2% Asia ).
This city:
31.3%New York:
22.6%
Marital status for residents in Mount Kisco Marital status - White (Caucasian) population 15 years and over
Males 22.3% Never married60.8% Now married1.1% Separated5.0% Widowed10.9% DivorcedFemales 23.9% Never married46.4% Now married1.0% Separated9.3% Widowed19.5% DivorcedWomen who gave birth in the past 12 months Now married:
100.0% (75)Unmarried:
0.0% (0)
Women who did not give birth in the past 12 months Now married:
49.8% (545)Unmarried:
50.2% (550)
Marital status - Black or African American population 15 years and over
Males 59.0% Never married21.6% Now married0.0% Separated0.0% Widowed19.4% DivorcedFemales 39.6% Never married51.2% Now married0.0% Separated0.0% Widowed9.2% DivorcedWomen who did not give birth in the past 12 months Now married:
68.1% (78)Unmarried:
31.9% (37)
Marital status - Asian population 15 years and over
Males 48.3% Never married51.7% Now married0.0% Separated0.0% Widowed0.0% DivorcedFemales 21.6% Never married65.5% Now married0.0% Separated7.0% Widowed5.8% DivorcedWomen who did not give birth in the past 12 months Now married:
77.1% (53)Unmarried:
22.9% (16)
Marital status - Other race population 15 years and over
Males 66.6% Never married26.1% Now married4.7% Separated0.0% Widowed2.6% DivorcedFemales 37.0% Never married52.3% Now married5.0% Separated0.4% Widowed5.3% DivorcedWomen who did not give birth in the past 12 months Now married:
60.1% (242)Unmarried:
39.9% (161)
Marital status - Two or more races population 15 years and over
Males 38.5% Never married61.5% Now married0.0% Separated0.0% Widowed0.0% DivorcedFemales 1.2% Never married82.3% Now married8.7% Separated0.0% Widowed7.9% DivorcedWomen who gave birth in the past 12 months Now married:
100.0% (16)Unmarried:
0.0% (0)
Women who did not give birth in the past 12 months Now married:
98.0% (187)Unmarried:
2.0% (4)
Marital status - White alone, not Hispanic / Latino population 15 years and over
Males 25.7% Never married55.6% Now married1.3% Separated5.8% Widowed11.6% DivorcedFemales 22.0% Never married45.0% Now married0.9% Separated9.9% Widowed22.2% DivorcedWomen who gave birth in the past 12 months Now married:
100.0% (45)Unmarried:
0.0% (0)
Women who did not give birth in the past 12 months Now married:
48.4% (474)Unmarried:
51.6% (505)
Marital status - Hispanic or Latino population 15 years and over
Males 46.6% Never married47.2% Now married2.8% Separated0.0% Widowed3.3% DivorcedFemales 28.7% Never married60.8% Now married4.8% Separated2.3% Widowed3.4% DivorcedWomen who gave birth in the past 12 months Now married:
100.0% (50)Unmarried:
0.0% (0)
Women who did not give birth in the past 12 months Now married:
67.8% (456)Unmarried:
32.2% (217)
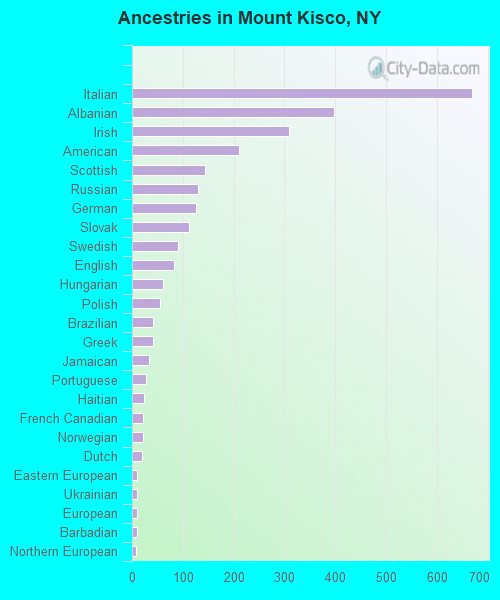
Ancestries in Mount Kisco
669 11.5% Italian397 6.8% Albanian309 5.3% Irish211 3.6% American143 2.5% Scottish129 2.2% Russian125 2.1% German113 1.9% Slovak90 1.5% Swedish82 1.4% English61 1.0% Hungarian56 1.0% Polish41 0.7% Brazilian41 0.7% Greek34 0.6% Jamaican28 0.5% Portuguese24 0.4% Haitian21 0.4% French Canadian21 0.4% Norwegian20 0.3% Dutch10 0.2% Eastern European10 0.2% Ukrainian9 0.2% European9 0.2% Barbadian8 0.1% Northern European7 0.1% Romanian3 0.05% Lebanese
Children Nativity (place of birth) in Mount Kisco
Children under 6 years - Living with two parents Both parents native 429 99.9% Native0 0.1% Foreign-bornBoth parents foreign-born 344 81.5% Native78 18.5% Foreign-bornOne native, one foreign-born parent 244 96.1% Native10 3.9% Foreign-bornChildren under 6 years - Living with one parent Native parent 57 100.0% NativeChildren 6 to 17 years - Living with two parents Both parents native 403 98.6% Native6 1.4% Foreign-bornBoth parents foreign-born 258 83.1% Native52 16.9% Foreign-bornOne native, one foreign-born parent 169 100.0% NativeChildren 6 to 17 years - Living with one parent Native parent 109 100.0% NativeForeign-born parent 132 51.2% Native126 48.8% Foreign-born
Grandparents responsible for own grandchildren in Mount Kisco
Grandparents (30 to 59 years) White / Caucasian 30 100.0% Not responsible for grandchildrenBlack or African American 27 100.0% Not responsible for grandchildrenHispanic or Latino 48 100.0% Not responsible for grandchildren
Grandparents (60 years and over) White / Caucasian 98 100.0% Not responsible for grandchildrenHispanic or Latino 11 100.0% Not responsible for grandchildren