Races in Monahans, Texas (TX) Detailed Stats
Data:
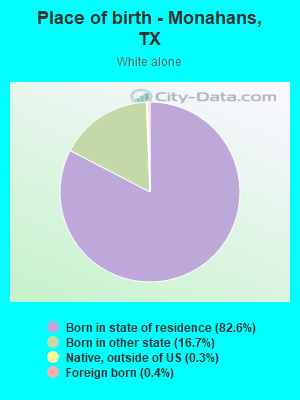
Races - White alone (%)
Races - White alone (% change since 2000)
Races - Black alone (%)
Races - Black alone (% change since 2000)
Races - American Indian alone (%)
Races - American Indian alone (% change since 2000)
Races - Asian alone (%)
Races - Asian alone (% change since 2000)
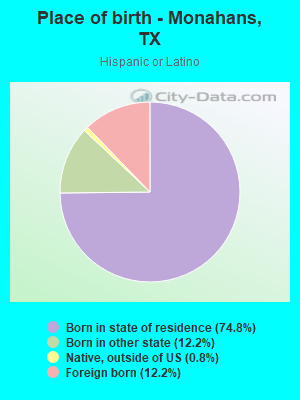
Races - Hispanic (%)
Races - Hispanic (% change since 2000)
Races - Native Hawaiian and Other Pacific Islander alone (%)
Races - Native Hawaiian and Other Pacific Islander alone (% change since 2000)
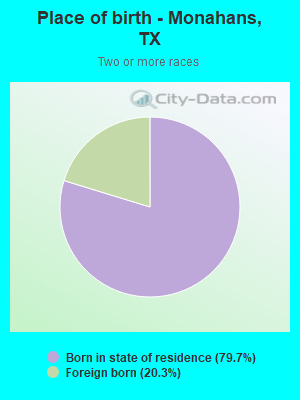
Races - Two or more races(%)
Races - Two or more races(% change since 2000)
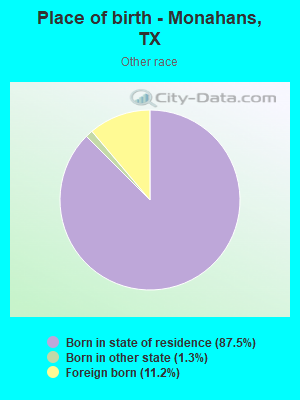
Races - Other race alone (%)
Races - Other race alone (% change since 2000)
Racial diversity
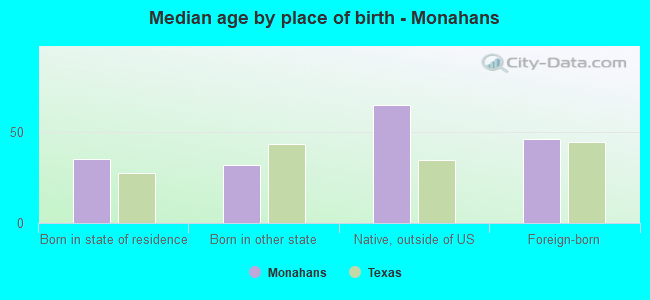
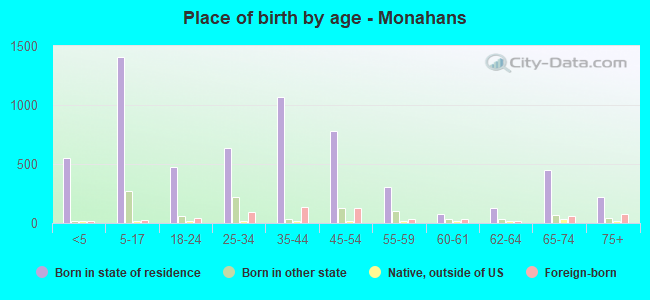
Place of birth - Born in state of residence (%)
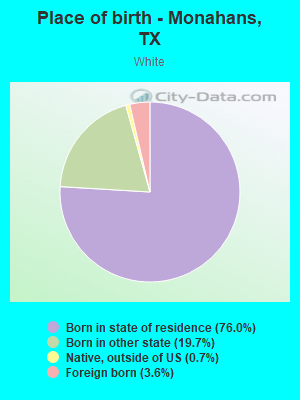
Place of birth - Born in state of residence (%) - White
Place of birth - Born in state of residence (%) - Black or African American
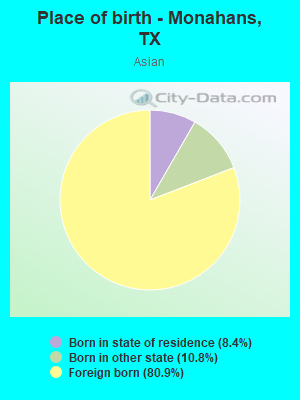
Place of birth - Born in state of residence (%) - Asian
Place of birth - Born in state of residence (%) - Hispanic or Latino
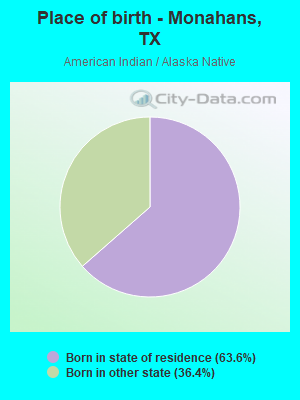
Place of birth - Born in state of residence (%) - American Indian and Alaska Native
Place of birth - Born in state of residence (%) - Multirace
Place of birth - Born in state of residence (%) - Other Race
Place of birth - Born in other state (%)
Place of birth - Born in other state (%) - White
Place of birth - Born in other state (%) - Black or African American
Place of birth - Born in other state (%) - Asian
Place of birth - Born in other state (%) - Hispanic or Latino
Place of birth - Born in other state (%) - American Indian and Alaska Native
Place of birth - Born in other state (%) - Multirace
Place of birth - Born in other state (%) - Other Race
Place of birth - Native, outside of US (%)
Place of birth - Native, outside of US (%) - White
Place of birth - Native, outside of US (%) - Black or African American
Place of birth - Native, outside of US (%) - Asian
Place of birth - Native, outside of US (%) - Hispanic or Latino
Place of birth - Native, outside of US (%) - American Indian and Alaska Native
Place of birth - Native, outside of US (%) - Multirace
Place of birth - Native, outside of US (%) - Other Race
Place of birth - Foreign born (%)
Place of birth - Foreign born (%) - White
Place of birth - Foreign born (%) - Black or African American
Place of birth - Foreign born (%) - Asian
Place of birth - Foreign born (%) - Hispanic or Latino
Place of birth - Foreign born (%) - American Indian and Alaska Native
Place of birth - Foreign born (%) - Multirace
Place of birth - Foreign born (%) - Other Race
Residents speaking English at home (%)
Residents speaking English at home - Born in the United States (%)
Residents speaking English at home - Native, born elsewhere (%)
Residents speaking English at home - Foreign born (%)
Residents speaking Spanish at home (%)
Residents speaking Spanish at home - Born in the United States (%)
Residents speaking Spanish at home - Native, born elsewhere (%)
Residents speaking Spanish at home - Foreign born (%)
Residents speaking other language at home (%)
Residents speaking other language at home - Born in the United States (%)
Residents speaking other language at home - Native, born elsewhere (%)
Residents speaking other language at home - Foreign born (%)
Marital status - Never married (%)
Marital status - Now married (%)
Marital status - Separated (%)
Marital status - Widowed (%)
Marital status - Divorced (%)
Ancestries Reported - Arab (%)
Ancestries Reported - Czech (%)
Ancestries Reported - Danish (%)
Ancestries Reported - Dutch (%)
Ancestries Reported - English (%)
Ancestries Reported - French (%)
Ancestries Reported - French Canadian (%)
Ancestries Reported - German (%)
Ancestries Reported - Greek (%)
Ancestries Reported - Hungarian (%)
Ancestries Reported - Irish (%)
Ancestries Reported - Italian (%)
Ancestries Reported - Lithuanian (%)
Ancestries Reported - Norwegian (%)
Ancestries Reported - Polish (%)
Ancestries Reported - Portuguese (%)
Ancestries Reported - Russian (%)
Ancestries Reported - Scotch-Irish (%)
Ancestries Reported - Scottish (%)
Ancestries Reported - Slovak (%)
Ancestries Reported - Subsaharan African (%)
Ancestries Reported - Swedish (%)
Ancestries Reported - Swiss (%)
Ancestries Reported - Ukrainian (%)
Ancestries Reported - United States (%)
Ancestries Reported - Welsh (%)
Ancestries Reported - West Indian (%)
Ancestries Reported - Other (%)
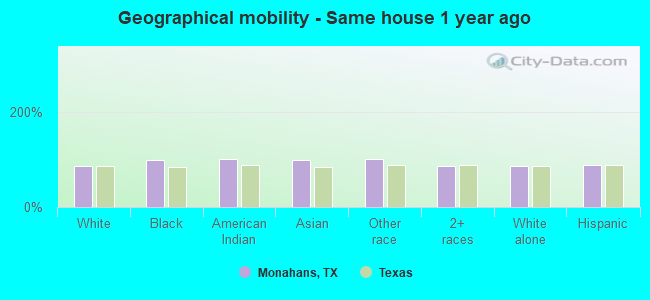
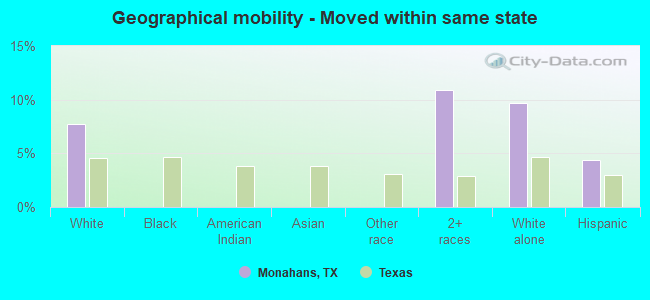
Geographical mobility - Same house 1 year ago (%)
Geographical mobility - Same house 1 year ago (%) - White
Geographical mobility - Same house 1 year ago (%) - Black or African American
Geographical mobility - Same house 1 year ago (%) - Asian
Geographical mobility - Same house 1 year ago (%) - Hispanic or Latino
Geographical mobility - Same house 1 year ago (%) - American Indian and Alaska Native
Geographical mobility - Same house 1 year ago (%) - Multirace
Geographical mobility - Same house 1 year ago (%) - Other Race
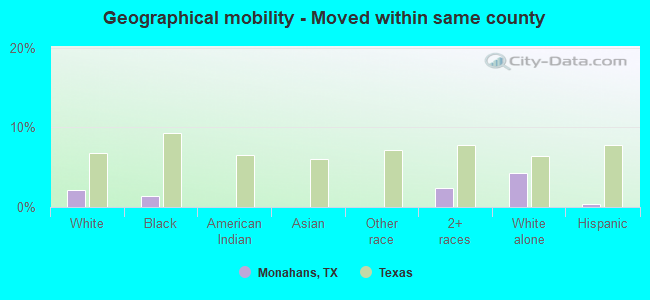
Geographical mobility - Moved within same county (%)
Geographical mobility - Moved within same county (%) - White
Geographical mobility - Moved within same county (%) - Black or African American
Geographical mobility - Moved within same county (%) - Asian
Geographical mobility - Moved within same county (%) - Hispanic or Latino
Geographical mobility - Moved within same county (%) - American Indian and Alaska Native
Geographical mobility - Moved within same county (%) - Multirace
Geographical mobility - Moved within same county (%) - Other Race
Geographical mobility - Moved from different county within same state (%)
Geographical mobility - Moved from different county within same state (%) - White
Geographical mobility - Moved from different county within same state (%) - Black or African American
Geographical mobility - Moved from different county within same state (%) - Asian
Geographical mobility - Moved from different county within same state (%) - Hispanic or Latino
Geographical mobility - Moved from different county within same state (%) - American Indian and Alaska Native
Geographical mobility - Moved from different county within same state (%) - Multirace
Geographical mobility - Moved from different county within same state (%) - Other Race
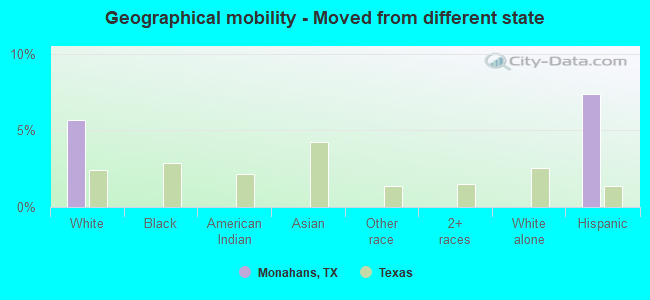
Geographical mobility - Moved from different state (%)
Geographical mobility - Moved from different state (%) - White
Geographical mobility - Moved from different state (%) - Black or African American
Geographical mobility - Moved from different state (%) - Asian
Geographical mobility - Moved from different state (%) - Hispanic or Latino
Geographical mobility - Moved from different state (%) - American Indian and Alaska Native
Geographical mobility - Moved from different state (%) - Multirace
Geographical mobility - Moved from different state (%) - Other Race
Geographical mobility - Moved from abroad (%)
Geographical mobility - Moved from abroad (%) - White
Geographical mobility - Moved from abroad (%) - Black or African American
Geographical mobility - Moved from abroad (%) - Asian
Geographical mobility - Moved from abroad (%) - Hispanic or Latino
Geographical mobility - Moved from abroad (%) - American Indian and Alaska Native
Geographical mobility - Moved from abroad (%) - Multirace
Geographical mobility - Moved from abroad (%) - Other Race
Place of birth for the foreign-born population - Ireland (%)
Place of birth for the foreign-born population - Denmark (%)
Place of birth for the foreign-born population - Norway (%)
Place of birth for the foreign-born population - Sweden (%)
Place of birth for the foreign-born population - United Kingdom (%)
Place of birth for the foreign-born population - England (%)
Place of birth for the foreign-born population - Scotland (%)
Place of birth for the foreign-born population - Other Northern Europe (%)
Place of birth for the foreign-born population - Austria (%)
Place of birth for the foreign-born population - Belgium (%)
Place of birth for the foreign-born population - France (%)
Place of birth for the foreign-born population - Germany (%)
Place of birth for the foreign-born population - Netherlands (%)
Place of birth for the foreign-born population - Switzerland (%)
Place of birth for the foreign-born population - Other Western Europe (%)
Place of birth for the foreign-born population - Greece (%)
Place of birth for the foreign-born population - Italy (%)
Place of birth for the foreign-born population - Portugal (%)
Place of birth for the foreign-born population - Spain (%)
Place of birth for the foreign-born population - Other Southern Europe (%)
Place of birth for the foreign-born population - Albania (%)
Place of birth for the foreign-born population - Belarus (%)
Place of birth for the foreign-born population - Bosnia and Herzegovina (%)
Place of birth for the foreign-born population - Bulgaria (%)
Place of birth for the foreign-born population - Croatia (%)
Place of birth for the foreign-born population - Czechoslovakia (%)
Place of birth for the foreign-born population - Hungary (%)
Place of birth for the foreign-born population - Latvia (%)
Place of birth for the foreign-born population - Lithuania (%)
Place of birth for the foreign-born population - North Macedonia (Macedonia) (%)
Place of birth for the foreign-born population - Moldova (%)
Place of birth for the foreign-born population - Poland (%)
Place of birth for the foreign-born population - Romania (%)
Place of birth for the foreign-born population - Russia (%)
Place of birth for the foreign-born population - Serbia (%)
Place of birth for the foreign-born population - Ukraine (%)
Place of birth for the foreign-born population - Other Eastern Europe (%)
Place of birth for the foreign-born population - China (%)
Place of birth for the foreign-born population - Hong Kong (%)
Place of birth for the foreign-born population - Taiwan (%)
Place of birth for the foreign-born population - Japan (%)
Place of birth for the foreign-born population - Korea (%)
Place of birth for the foreign-born population - Other Eastern Asia (%)
Place of birth for the foreign-born population - Afghanistan (%)
Place of birth for the foreign-born population - Bangladesh (%)
Place of birth for the foreign-born population - India (%)
Place of birth for the foreign-born population - Iran (%)
Place of birth for the foreign-born population - Kazakhstan (%)
Place of birth for the foreign-born population - Nepal (%)
Place of birth for the foreign-born population - Pakistan (%)
Place of birth for the foreign-born population - Sri Lanka (%)
Place of birth for the foreign-born population - Uzbekistan (%)
Place of birth for the foreign-born population - Other South Central Asia (%)
Place of birth for the foreign-born population - Burma (%)
Place of birth for the foreign-born population - Cambodia (%)
Place of birth for the foreign-born population - Indonesia (%)
Place of birth for the foreign-born population - Laos (%)
Place of birth for the foreign-born population - Malaysia (%)
Place of birth for the foreign-born population - Philippines (%)
Place of birth for the foreign-born population - Singapore (%)
Place of birth for the foreign-born population - Thailand (%)
Place of birth for the foreign-born population - Vietnam (%)
Place of birth for the foreign-born population - Other South Eastern Asia (%)
Place of birth for the foreign-born population - Armenia (%)
Place of birth for the foreign-born population - Iraq (%)
Place of birth for the foreign-born population - Israel (%)
Place of birth for the foreign-born population - Jordan (%)
Place of birth for the foreign-born population - Kuwait (%)
Place of birth for the foreign-born population - Lebanon (%)
Place of birth for the foreign-born population - Saudi Arabia (%)
Place of birth for the foreign-born population - Syria (%)
Place of birth for the foreign-born population - Turkey (%)
Place of birth for the foreign-born population - Yemen (%)
Place of birth for the foreign-born population - Other Western Asia (%)
Place of birth for the foreign-born population - Eritrea (%)
Place of birth for the foreign-born population - Ethiopia (%)
Place of birth for the foreign-born population - Kenya (%)
Place of birth for the foreign-born population - Somalia (%)
Place of birth for the foreign-born population - Uganda (%)
Place of birth for the foreign-born population - Zimbabwe (%)
Place of birth for the foreign-born population - Other Eastern Africa (%)
Place of birth for the foreign-born population - Cameroon (%)
Place of birth for the foreign-born population - Congo (%)
Place of birth for the foreign-born population - Democratic Republic of Congo (Zaire) (%)
Place of birth for the foreign-born population - Other Middle Africa (%)
Place of birth for the foreign-born population - Egypt (%)
Place of birth for the foreign-born population - Morocco (%)
Place of birth for the foreign-born population - Sudan (%)
Place of birth for the foreign-born population - Other Northern Africa (%)
Place of birth for the foreign-born population - South Africa (%)
Place of birth for the foreign-born population - Other Southern Africa (%)
Place of birth for the foreign-born population - Cabo Verde (%)
Place of birth for the foreign-born population - Ghana (%)
Place of birth for the foreign-born population - Liberia (%)
Place of birth for the foreign-born population - Nigeria (%)
Place of birth for the foreign-born population - Senegal (%)
Place of birth for the foreign-born population - Sierra Leone (%)
Place of birth for the foreign-born population - Other Western Africa (%)
Place of birth for the foreign-born population - Australia (%)
Place of birth for the foreign-born population - New Zealand (%)
Place of birth for the foreign-born population - Fiji (%)
Place of birth for the foreign-born population - Micronesia (%)
Place of birth for the foreign-born population - Bahamas (%)
Place of birth for the foreign-born population - Barbados (%)
Place of birth for the foreign-born population - Cuba (%)
Place of birth for the foreign-born population - Dominica (%)
Place of birth for the foreign-born population - Dominican Republic (%)
Place of birth for the foreign-born population - Grenada (%)
Place of birth for the foreign-born population - Haiti (%)
Place of birth for the foreign-born population - Jamaica (%)
Place of birth for the foreign-born population - St. Vincent and the Grenadines (%)
Place of birth for the foreign-born population - Trinidad and Tobago (%)
Place of birth for the foreign-born population - West Indies (%)
Place of birth for the foreign-born population - Other Caribbean (%)
Place of birth for the foreign-born population - Belize (%)
Place of birth for the foreign-born population - Costa Rica (%)
Place of birth for the foreign-born population - El Salvador (%)
Place of birth for the foreign-born population - Guatemala (%)
Place of birth for the foreign-born population - Honduras (%)
Place of birth for the foreign-born population - Mexico (%)
Place of birth for the foreign-born population - Nicaragua (%)
Place of birth for the foreign-born population - Panama (%)
Place of birth for the foreign-born population - Other Central America (%)
Place of birth for the foreign-born population - Argentina (%)
Place of birth for the foreign-born population - Bolivia (%)
Place of birth for the foreign-born population - Brazil (%)
Place of birth for the foreign-born population - Chile (%)
Place of birth for the foreign-born population - Colombia (%)
Place of birth for the foreign-born population - Ecuador (%)
Place of birth for the foreign-born population - Guyana (%)
Place of birth for the foreign-born population - Peru (%)
Place of birth for the foreign-born population - Uruguay (%)
Place of birth for the foreign-born population - Venezuela (%)
Place of birth for the foreign-born population - Other South America (%)
Place of birth for the foreign-born population - Canada (%)
Place of birth for the foreign-born population - Other Northern America (%)
Place of birth for the foreign-born population - Other (%)
Latest news about races in Monahans, TX collected exclusively by city-data.com from local newspapers, TV, and radio stations
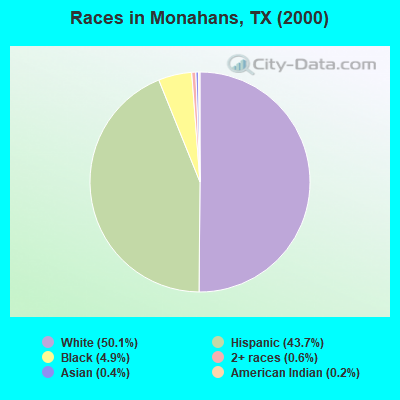
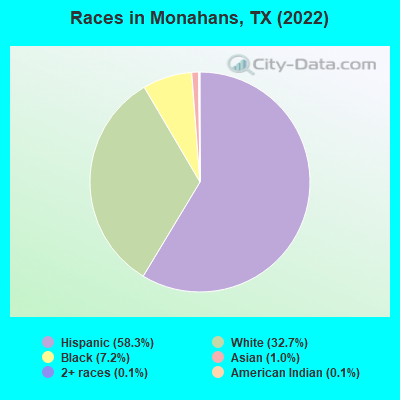
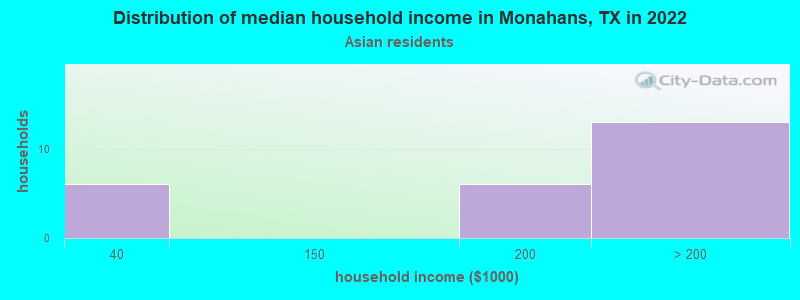
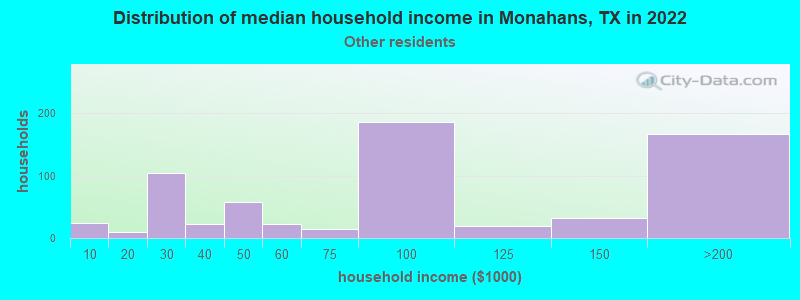
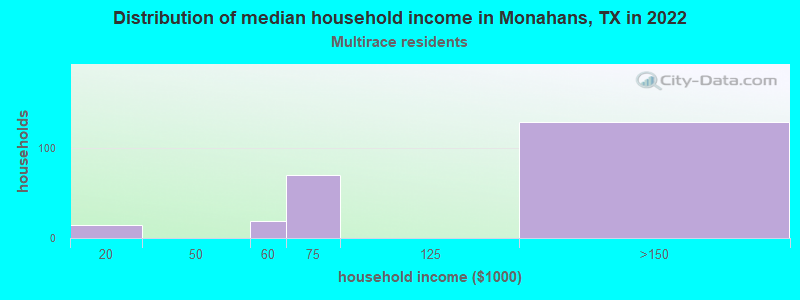
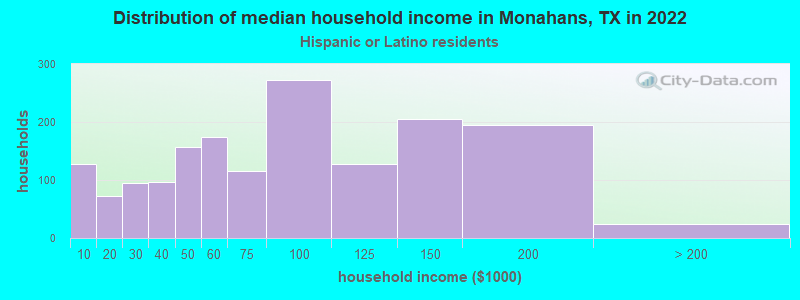
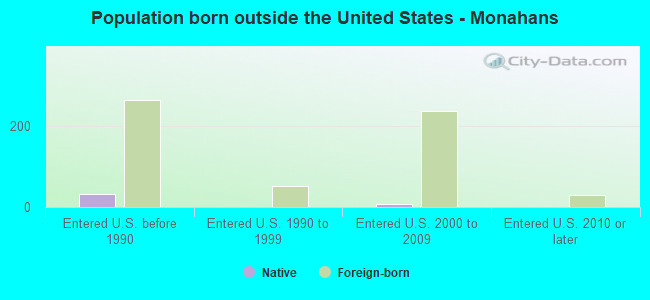
According to 2022 data, the most numerous races in Monahans, TX are Hispanic (4,550 residents), White alone (2,547 residents), and Black alone (559 residents). 64.9% of Monahans residents speak English at home. 8.1% of Monahans, TX residents are foreign-born (7.1% born in Latin America), which is 110.8% less than the foreign-born rate of 17.0% across the entire state of Texas.
Race distribution in Monahans
2000 2022
10,933,313 52.4% White alone 6,669,666 32.0% Hispanic 2,364,255 11.3% Black alone 554,445 2.7% Asian alone 230,567 1.1% Two or more races 68,859 0.3% American Indian alone 19,958 0.10% Other race alone 10,757 0.05% Native Hawaiian and Other
12,070,642 40.2% Hispanic 11,683,430 38.9% White alone 3,508,706 11.7% Black alone 1,608,173 5.4% Asian alone 956,560 3.2% Two or more races 125,763 0.4% Other race alone 47,023 0.2% American Indian alone 29,275 0.10% Native Hawaiian and Other
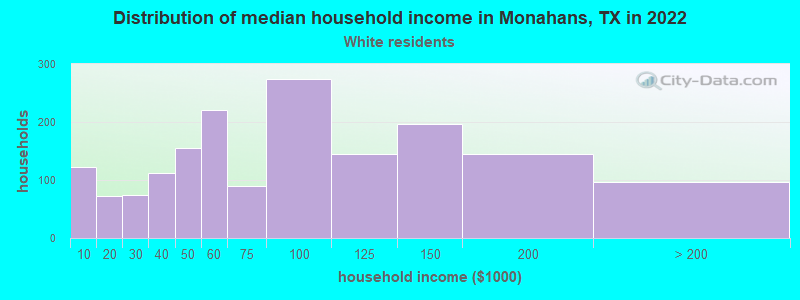
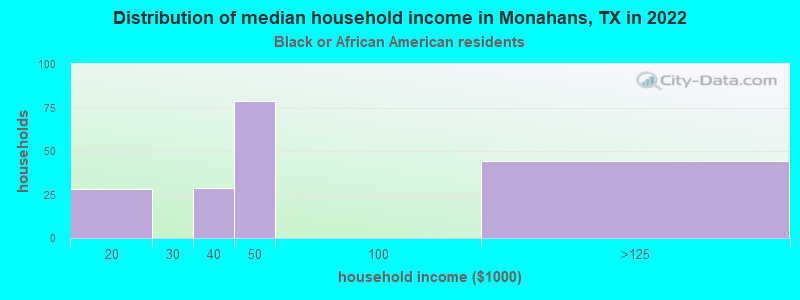
Income and house value in Monahans Median household income in 2022 $85,376 White non-Hispanic householders$46,359 Black householdersover $200,000 Asian householders$78,507 Some other race householders$139,296 Two or more races householders$72,802 Hispanic or Latino race householdersMedian 2022 house value $205,843 White Non-Hispanic householders$54,169 Black or African American householders$119,172 Some other race householders$66,736 Two or more races householders$118,305 Hispanic or Latino householders
Median age by race in Monahans
38.7 Median age for White residents39.4 36.6 37.6 Median age for Black or African American residents37.5 14.1 -684,418,145.3 Median age for American Indian / Alaska Native residents-682,445,758.7 -684,418,145.3 46.3 Median age for Asian residents48.7 21.9 -581,560,283.1 Median age for Native Hawaiian / Pacific Islander residents-612,729,233.5 -577,777,777.2 35.6 Median age for Other race residents39.1 35.0 22.8 Median age for Two or more races residents34.0 19.4 41.5 Median age for White alone residents43.2 40.2 31.1 Median age for Hispanic or Latino residents31.1 31.1
Owner/renter occupied households by race in Monahans
House owners and renters - White residents 1,399 80.9% Owner occupied330 19.1% Renter occupiedHouse owners and renters - Black or African American residents 163 85.1% Owner occupied28 14.9% Renter occupiedHouse owners and renters - American Indian / Alaska Native residents 20 100.0% Renter occupiedHouse owners and renters - Asian residents 18 73.8% Owner occupied7 26.2% Renter occupiedHouse owners and renters - Other race residents 326 50.9% Owner occupied315 49.1% Renter occupiedHouse owners and renters - Two or more races residents 168 68.7% Owner occupied76 31.3% Renter occupiedHouse owners and renters - White alone residents 893 86.9% Owner occupied135 13.1% Renter occupiedHouse owners and renters - Hispanic or Latino residents 1,078 64.7% Owner occupied587 35.3% Renter occupied
Language usage in Monahans
English speakers - Total 64.9% of residents of Monahans speak English at home.
33.8% of residents speak Spanish at home 1,726 70.6% Speak English very well720 29.4% Speak English less than very well1.0% of residents speak other language at home 20 27.0% Speak English very well54 73.0% Speak English less than very well
English speakers - Born in the United States 78.7% of residents of Monahans speak English at home.
20.3% of residents speak Spanish at home 163 81.9% Speak English very well36 18.1% Speak English less than very well0.8% of residents speak other language at home 8 100.0% Speak English less than very well
English speakers - Native, born elsewhere 16.3% of residents of Monahans speak English at home.
79.1% of residents speak Spanish at home 8 23.5% Speak English very well26 76.5% Speak English less than very well
English speakers - Foreign-born 5.1% of residents of Monahans speak English at home.
84.1% of residents speak Spanish at home 148 28.0% Speak English very well381 72.0% Speak English less than very well9.4% of residents speak other language at home 19 32.2% Speak English very well40 67.8% Speak English less than very well
White (Caucasian) - Speak only English Native:
81.2% (3,268)Foreign-born:
8.6% (14)
White (Caucasian) - Speak another language Native:
14.9% (599)Foreign-born:
84.0% (135)
Asian - Speak another language Native:
98.9% (15)Foreign-born:
99.6% (62)
Other race - Speak only English Native:
35.5% (352)Foreign-born:
11.4% (15)
Other race - Speak another language Native:
64.5% (639)Foreign-born:
89.1% (121)
Two or more races - Speak only English Native:
43.1% (256)Foreign-born:
3.1% (5)
Two or more races - Speak another language Native:
57.7% (342)Foreign-born:
97.1% (155)
White alone - Speak only English Native:
96.8% (2,265)Foreign-born:
100.0% (10)
Hispanic or Latino - Speak only English Native:
50.3% (1,830)Foreign-born:
4.2% (23)
Hispanic or Latino - Speak another language Native:
50.0% (1,819)Foreign-born:
95.7% (532)
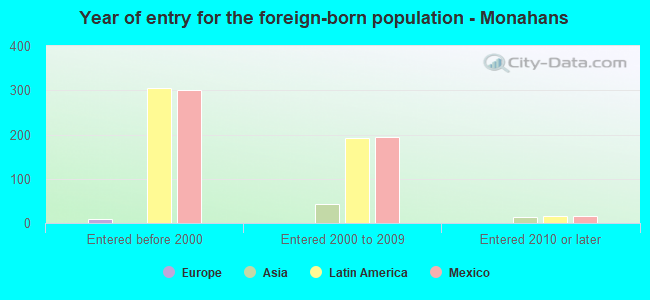
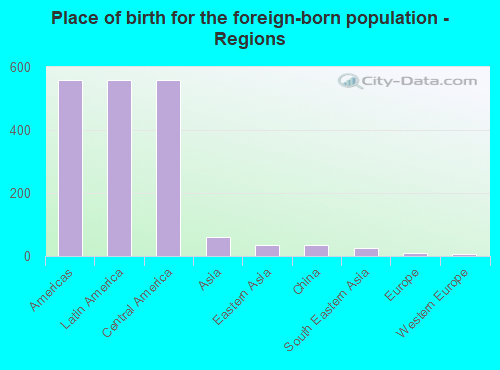
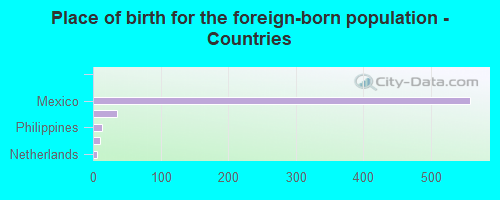
Foreign-born residents in Monahans 629 residents are foreign born (7.1% Latin America ).
This city:
8.1%Texas:
17.1%
Marital status for residents in Monahans Marital status - White (Caucasian) population 15 years and over
Males 29.5% Never married57.6% Now married0.4% Separated3.7% Widowed8.8% DivorcedFemales 24.3% Never married56.5% Now married1.8% Separated8.2% Widowed9.3% DivorcedWomen who gave birth in the past 12 months Now married:
100.0% (85)Unmarried:
0.0% (0)
Women who did not give birth in the past 12 months Now married:
55.3% (550)Unmarried:
44.7% (445)
Marital status - Black or African American population 15 years and over
Males 61.4% Never married6.8% Now married0.0% Separated0.0% Widowed31.8% DivorcedFemales 58.3% Never married41.7% Now married0.0% Separated0.0% Widowed0.0% DivorcedWomen who did not give birth in the past 12 months Now married:
0.0% (0)Unmarried:
100.0% (41)
Marital status - American Indian / Alaska Native population 15 years and over
Males 100.0% Never married0.0% Now married0.0% Separated0.0% Widowed0.0% DivorcedFemales 0.0% Never married100.0% Now married0.0% Separated0.0% Widowed0.0% DivorcedMarital status - Asian population 15 years and over
Males 0.0% Never married76.0% Now married0.0% Separated24.0% Widowed0.0% DivorcedFemales 32.0% Never married68.0% Now married0.0% Separated0.0% Widowed0.0% DivorcedWomen who did not give birth in the past 12 months Now married:
57.9% (12)Unmarried:
42.1% (9)
Marital status - Other race population 15 years and over
Males 25.1% Never married57.9% Now married0.0% Separated0.0% Widowed17.0% DivorcedFemales 29.3% Never married51.1% Now married4.9% Separated0.0% Widowed14.7% DivorcedWomen who did not give birth in the past 12 months Now married:
43.1% (129)Unmarried:
56.9% (170)
Marital status - Two or more races population 15 years and over
Males 32.1% Never married59.7% Now married0.0% Separated8.2% Widowed0.0% DivorcedFemales 40.9% Never married41.5% Now married0.0% Separated5.7% Widowed11.9% DivorcedWomen who did not give birth in the past 12 months Now married:
41.6% (85)Unmarried:
58.4% (119)
Marital status - White alone, not Hispanic / Latino population 15 years and over
Males 24.7% Never married62.6% Now married0.7% Separated3.7% Widowed8.3% DivorcedFemales 24.4% Never married56.6% Now married0.0% Separated12.8% Widowed6.2% DivorcedWomen who gave birth in the past 12 months Now married:
100.0% (46)Unmarried:
0.0% (0)
Women who did not give birth in the past 12 months Now married:
51.8% (300)Unmarried:
48.2% (279)
Marital status - Hispanic or Latino population 15 years and over
Males 31.9% Never married55.0% Now married0.0% Separated2.7% Widowed10.3% DivorcedFemales 26.6% Never married54.3% Now married3.4% Separated3.1% Widowed12.6% DivorcedWomen who gave birth in the past 12 months Now married:
100.0% (61)Unmarried:
0.0% (0)
Women who did not give birth in the past 12 months Now married:
52.9% (546)Unmarried:
47.1% (485)
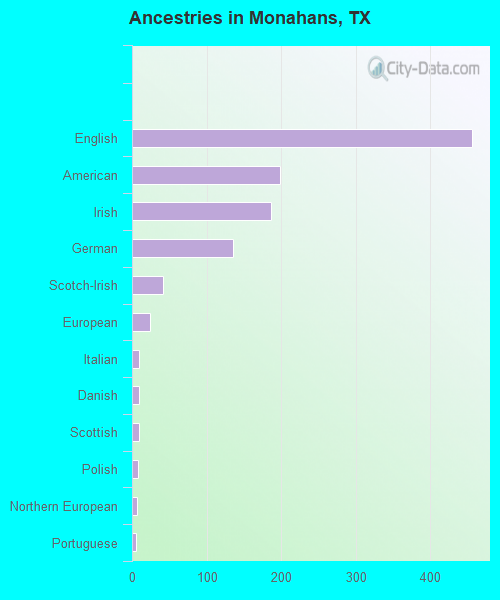
Ancestries in Monahans
456 8.4% English198 3.7% American186 3.4% Irish136 2.5% German42 0.8% Scotch-Irish24 0.4% European10 0.2% Italian9 0.2% Danish9 0.2% Scottish8 0.1% Polish7 0.1% Northern European5 0.09% Portuguese
Children Nativity (place of birth) in Monahans
Children under 6 years - Living with two parents Both parents native 416 100.0% NativeOne native, one foreign-born parent 42 100.0% NativeChildren under 6 years - Living with one parent Native parent 68 100.0% NativeChildren 6 to 17 years - Living with two parents Both parents native 724 100.0% NativeBoth parents foreign-born 74 100.0% NativeOne native, one foreign-born parent 69 100.0% NativeChildren 6 to 17 years - Living with one parent Native parent 555 98.0% Native11 2.0% Foreign-bornForeign-born parent 24 77.0% Native7 23.0% Foreign-born
Grandparents responsible for own grandchildren in Monahans
Grandparents (30 to 59 years) White / Caucasian 22 100.0% Responsible for grandchildrenBlack or African American 69 100.0% Responsible for grandchildrenTwo or more races 33 100.0% Responsible for grandchildrenWhite alone, not Hispanic / Latino 17 100.0% Responsible for grandchildrenHispanic or Latino 32 100.0% Responsible for grandchildrenGrandparents (60 years and over) White / Caucasian 31 53.3% Responsible for grandchildren27 46.7% Not responsible for grandchildrenWhite alone, not Hispanic / Latino 8 37.0% Responsible for grandchildren14 63.0% Not responsible for grandchildrenHispanic or Latino 43 64.5% Responsible for grandchildren24 35.5% Not responsible for grandchildren