Races in Mission, Texas (TX) Detailed Stats
Data:
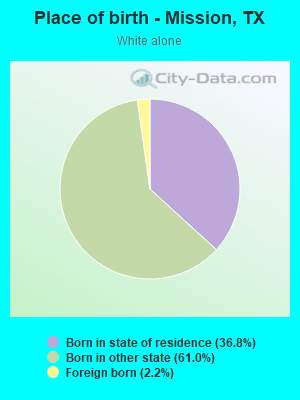
Races - White alone (%)
Races - White alone (% change since 2000)
Races - Black alone (%)
Races - Black alone (% change since 2000)
Races - American Indian alone (%)
Races - American Indian alone (% change since 2000)
Races - Asian alone (%)
Races - Asian alone (% change since 2000)
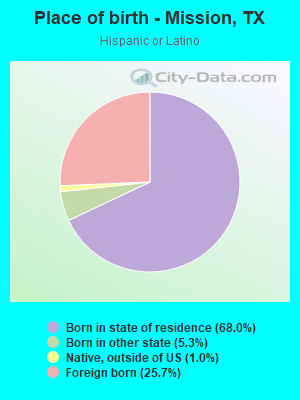
Races - Hispanic (%)
Races - Hispanic (% change since 2000)
Races - Native Hawaiian and Other Pacific Islander alone (%)
Races - Native Hawaiian and Other Pacific Islander alone (% change since 2000)
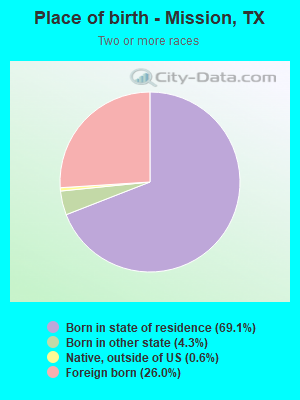
Races - Two or more races(%)
Races - Two or more races(% change since 2000)
Races - Other race alone (%)
Races - Other race alone (% change since 2000)
Racial diversity
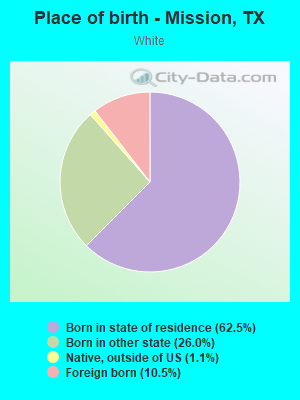
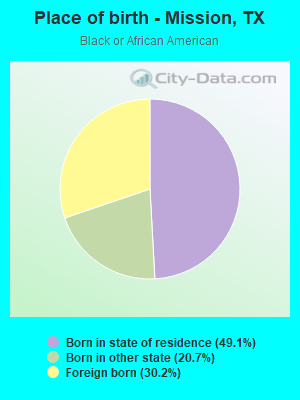
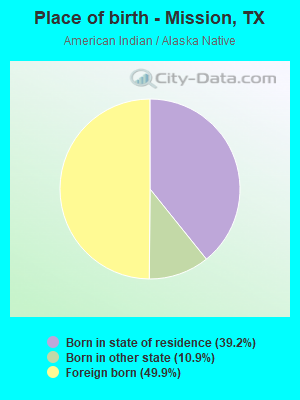
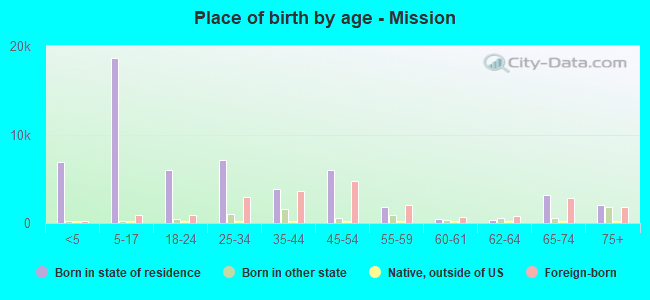
Place of birth - Born in state of residence (%)
Place of birth - Born in state of residence (%) - White
Place of birth - Born in state of residence (%) - Black or African American
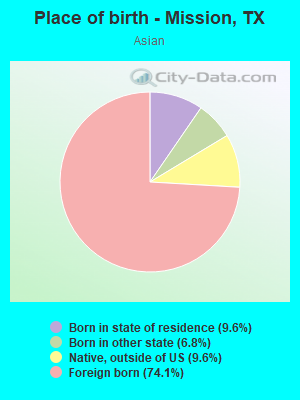
Place of birth - Born in state of residence (%) - Asian
Place of birth - Born in state of residence (%) - Hispanic or Latino
Place of birth - Born in state of residence (%) - American Indian and Alaska Native
Place of birth - Born in state of residence (%) - Multirace
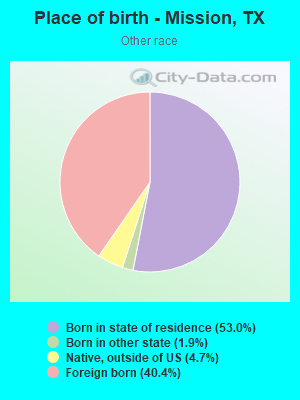
Place of birth - Born in state of residence (%) - Other Race
Place of birth - Born in other state (%)
Place of birth - Born in other state (%) - White
Place of birth - Born in other state (%) - Black or African American
Place of birth - Born in other state (%) - Asian
Place of birth - Born in other state (%) - Hispanic or Latino
Place of birth - Born in other state (%) - American Indian and Alaska Native
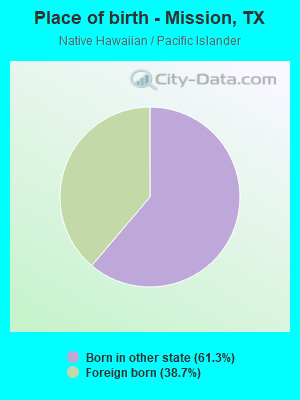
Place of birth - Born in other state (%) - Multirace
Place of birth - Born in other state (%) - Other Race
Place of birth - Native, outside of US (%)
Place of birth - Native, outside of US (%) - White
Place of birth - Native, outside of US (%) - Black or African American
Place of birth - Native, outside of US (%) - Asian
Place of birth - Native, outside of US (%) - Hispanic or Latino
Place of birth - Native, outside of US (%) - American Indian and Alaska Native
Place of birth - Native, outside of US (%) - Multirace
Place of birth - Native, outside of US (%) - Other Race
Place of birth - Foreign born (%)
Place of birth - Foreign born (%) - White
Place of birth - Foreign born (%) - Black or African American
Place of birth - Foreign born (%) - Asian
Place of birth - Foreign born (%) - Hispanic or Latino
Place of birth - Foreign born (%) - American Indian and Alaska Native
Place of birth - Foreign born (%) - Multirace
Place of birth - Foreign born (%) - Other Race
Residents speaking English at home (%)
Residents speaking English at home - Born in the United States (%)
Residents speaking English at home - Native, born elsewhere (%)
Residents speaking English at home - Foreign born (%)
Residents speaking Spanish at home (%)
Residents speaking Spanish at home - Born in the United States (%)
Residents speaking Spanish at home - Native, born elsewhere (%)
Residents speaking Spanish at home - Foreign born (%)
Residents speaking other language at home (%)
Residents speaking other language at home - Born in the United States (%)
Residents speaking other language at home - Native, born elsewhere (%)
Residents speaking other language at home - Foreign born (%)
Marital status - Never married (%)
Marital status - Now married (%)
Marital status - Separated (%)
Marital status - Widowed (%)
Marital status - Divorced (%)
Ancestries Reported - Arab (%)
Ancestries Reported - Czech (%)
Ancestries Reported - Danish (%)
Ancestries Reported - Dutch (%)
Ancestries Reported - English (%)
Ancestries Reported - French (%)
Ancestries Reported - French Canadian (%)
Ancestries Reported - German (%)
Ancestries Reported - Greek (%)
Ancestries Reported - Hungarian (%)
Ancestries Reported - Irish (%)
Ancestries Reported - Italian (%)
Ancestries Reported - Lithuanian (%)
Ancestries Reported - Norwegian (%)
Ancestries Reported - Polish (%)
Ancestries Reported - Portuguese (%)
Ancestries Reported - Russian (%)
Ancestries Reported - Scotch-Irish (%)
Ancestries Reported - Scottish (%)
Ancestries Reported - Slovak (%)
Ancestries Reported - Subsaharan African (%)
Ancestries Reported - Swedish (%)
Ancestries Reported - Swiss (%)
Ancestries Reported - Ukrainian (%)
Ancestries Reported - United States (%)
Ancestries Reported - Welsh (%)
Ancestries Reported - West Indian (%)
Ancestries Reported - Other (%)
Geographical mobility - Same house 1 year ago (%)
Geographical mobility - Same house 1 year ago (%) - White
Geographical mobility - Same house 1 year ago (%) - Black or African American
Geographical mobility - Same house 1 year ago (%) - Asian
Geographical mobility - Same house 1 year ago (%) - Hispanic or Latino
Geographical mobility - Same house 1 year ago (%) - American Indian and Alaska Native
Geographical mobility - Same house 1 year ago (%) - Multirace
Geographical mobility - Same house 1 year ago (%) - Other Race
Geographical mobility - Moved within same county (%)
Geographical mobility - Moved within same county (%) - White
Geographical mobility - Moved within same county (%) - Black or African American
Geographical mobility - Moved within same county (%) - Asian
Geographical mobility - Moved within same county (%) - Hispanic or Latino
Geographical mobility - Moved within same county (%) - American Indian and Alaska Native
Geographical mobility - Moved within same county (%) - Multirace
Geographical mobility - Moved within same county (%) - Other Race
Geographical mobility - Moved from different county within same state (%)
Geographical mobility - Moved from different county within same state (%) - White
Geographical mobility - Moved from different county within same state (%) - Black or African American
Geographical mobility - Moved from different county within same state (%) - Asian
Geographical mobility - Moved from different county within same state (%) - Hispanic or Latino
Geographical mobility - Moved from different county within same state (%) - American Indian and Alaska Native
Geographical mobility - Moved from different county within same state (%) - Multirace
Geographical mobility - Moved from different county within same state (%) - Other Race
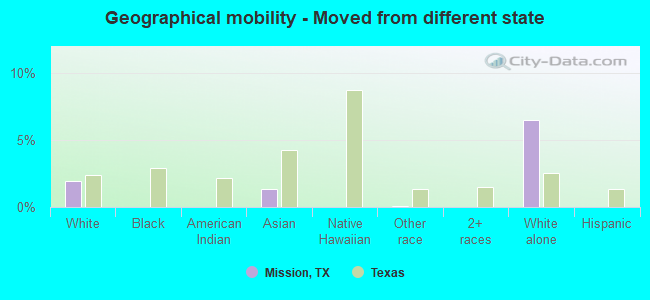
Geographical mobility - Moved from different state (%)
Geographical mobility - Moved from different state (%) - White
Geographical mobility - Moved from different state (%) - Black or African American
Geographical mobility - Moved from different state (%) - Asian
Geographical mobility - Moved from different state (%) - Hispanic or Latino
Geographical mobility - Moved from different state (%) - American Indian and Alaska Native
Geographical mobility - Moved from different state (%) - Multirace
Geographical mobility - Moved from different state (%) - Other Race
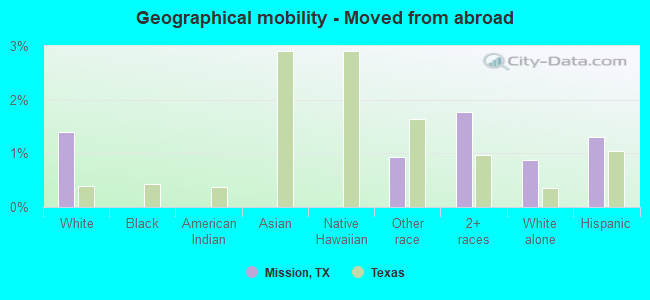
Geographical mobility - Moved from abroad (%)
Geographical mobility - Moved from abroad (%) - White
Geographical mobility - Moved from abroad (%) - Black or African American
Geographical mobility - Moved from abroad (%) - Asian
Geographical mobility - Moved from abroad (%) - Hispanic or Latino
Geographical mobility - Moved from abroad (%) - American Indian and Alaska Native
Geographical mobility - Moved from abroad (%) - Multirace
Geographical mobility - Moved from abroad (%) - Other Race
Place of birth for the foreign-born population - Ireland (%)
Place of birth for the foreign-born population - Denmark (%)
Place of birth for the foreign-born population - Norway (%)
Place of birth for the foreign-born population - Sweden (%)
Place of birth for the foreign-born population - United Kingdom (%)
Place of birth for the foreign-born population - England (%)
Place of birth for the foreign-born population - Scotland (%)
Place of birth for the foreign-born population - Other Northern Europe (%)
Place of birth for the foreign-born population - Austria (%)
Place of birth for the foreign-born population - Belgium (%)
Place of birth for the foreign-born population - France (%)
Place of birth for the foreign-born population - Germany (%)
Place of birth for the foreign-born population - Netherlands (%)
Place of birth for the foreign-born population - Switzerland (%)
Place of birth for the foreign-born population - Other Western Europe (%)
Place of birth for the foreign-born population - Greece (%)
Place of birth for the foreign-born population - Italy (%)
Place of birth for the foreign-born population - Portugal (%)
Place of birth for the foreign-born population - Spain (%)
Place of birth for the foreign-born population - Other Southern Europe (%)
Place of birth for the foreign-born population - Albania (%)
Place of birth for the foreign-born population - Belarus (%)
Place of birth for the foreign-born population - Bosnia and Herzegovina (%)
Place of birth for the foreign-born population - Bulgaria (%)
Place of birth for the foreign-born population - Croatia (%)
Place of birth for the foreign-born population - Czechoslovakia (%)
Place of birth for the foreign-born population - Hungary (%)
Place of birth for the foreign-born population - Latvia (%)
Place of birth for the foreign-born population - Lithuania (%)
Place of birth for the foreign-born population - North Macedonia (Macedonia) (%)
Place of birth for the foreign-born population - Moldova (%)
Place of birth for the foreign-born population - Poland (%)
Place of birth for the foreign-born population - Romania (%)
Place of birth for the foreign-born population - Russia (%)
Place of birth for the foreign-born population - Serbia (%)
Place of birth for the foreign-born population - Ukraine (%)
Place of birth for the foreign-born population - Other Eastern Europe (%)
Place of birth for the foreign-born population - China (%)
Place of birth for the foreign-born population - Hong Kong (%)
Place of birth for the foreign-born population - Taiwan (%)
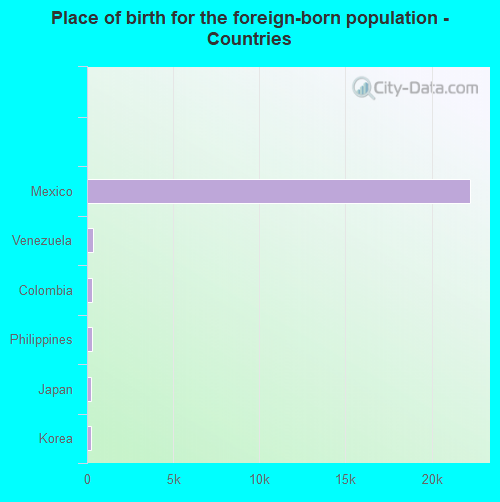
Place of birth for the foreign-born population - Japan (%)
Place of birth for the foreign-born population - Korea (%)
Place of birth for the foreign-born population - Other Eastern Asia (%)
Place of birth for the foreign-born population - Afghanistan (%)
Place of birth for the foreign-born population - Bangladesh (%)
Place of birth for the foreign-born population - India (%)
Place of birth for the foreign-born population - Iran (%)
Place of birth for the foreign-born population - Kazakhstan (%)
Place of birth for the foreign-born population - Nepal (%)
Place of birth for the foreign-born population - Pakistan (%)
Place of birth for the foreign-born population - Sri Lanka (%)
Place of birth for the foreign-born population - Uzbekistan (%)
Place of birth for the foreign-born population - Other South Central Asia (%)
Place of birth for the foreign-born population - Burma (%)
Place of birth for the foreign-born population - Cambodia (%)
Place of birth for the foreign-born population - Indonesia (%)
Place of birth for the foreign-born population - Laos (%)
Place of birth for the foreign-born population - Malaysia (%)
Place of birth for the foreign-born population - Philippines (%)
Place of birth for the foreign-born population - Singapore (%)
Place of birth for the foreign-born population - Thailand (%)
Place of birth for the foreign-born population - Vietnam (%)
Place of birth for the foreign-born population - Other South Eastern Asia (%)
Place of birth for the foreign-born population - Armenia (%)
Place of birth for the foreign-born population - Iraq (%)
Place of birth for the foreign-born population - Israel (%)
Place of birth for the foreign-born population - Jordan (%)
Place of birth for the foreign-born population - Kuwait (%)
Place of birth for the foreign-born population - Lebanon (%)
Place of birth for the foreign-born population - Saudi Arabia (%)
Place of birth for the foreign-born population - Syria (%)
Place of birth for the foreign-born population - Turkey (%)
Place of birth for the foreign-born population - Yemen (%)
Place of birth for the foreign-born population - Other Western Asia (%)
Place of birth for the foreign-born population - Eritrea (%)
Place of birth for the foreign-born population - Ethiopia (%)
Place of birth for the foreign-born population - Kenya (%)
Place of birth for the foreign-born population - Somalia (%)
Place of birth for the foreign-born population - Uganda (%)
Place of birth for the foreign-born population - Zimbabwe (%)
Place of birth for the foreign-born population - Other Eastern Africa (%)
Place of birth for the foreign-born population - Cameroon (%)
Place of birth for the foreign-born population - Congo (%)
Place of birth for the foreign-born population - Democratic Republic of Congo (Zaire) (%)
Place of birth for the foreign-born population - Other Middle Africa (%)
Place of birth for the foreign-born population - Egypt (%)
Place of birth for the foreign-born population - Morocco (%)
Place of birth for the foreign-born population - Sudan (%)
Place of birth for the foreign-born population - Other Northern Africa (%)
Place of birth for the foreign-born population - South Africa (%)
Place of birth for the foreign-born population - Other Southern Africa (%)
Place of birth for the foreign-born population - Cabo Verde (%)
Place of birth for the foreign-born population - Ghana (%)
Place of birth for the foreign-born population - Liberia (%)
Place of birth for the foreign-born population - Nigeria (%)
Place of birth for the foreign-born population - Senegal (%)
Place of birth for the foreign-born population - Sierra Leone (%)
Place of birth for the foreign-born population - Other Western Africa (%)
Place of birth for the foreign-born population - Australia (%)
Place of birth for the foreign-born population - New Zealand (%)
Place of birth for the foreign-born population - Fiji (%)
Place of birth for the foreign-born population - Micronesia (%)
Place of birth for the foreign-born population - Bahamas (%)
Place of birth for the foreign-born population - Barbados (%)
Place of birth for the foreign-born population - Cuba (%)
Place of birth for the foreign-born population - Dominica (%)
Place of birth for the foreign-born population - Dominican Republic (%)
Place of birth for the foreign-born population - Grenada (%)
Place of birth for the foreign-born population - Haiti (%)
Place of birth for the foreign-born population - Jamaica (%)
Place of birth for the foreign-born population - St. Vincent and the Grenadines (%)
Place of birth for the foreign-born population - Trinidad and Tobago (%)
Place of birth for the foreign-born population - West Indies (%)
Place of birth for the foreign-born population - Other Caribbean (%)
Place of birth for the foreign-born population - Belize (%)
Place of birth for the foreign-born population - Costa Rica (%)
Place of birth for the foreign-born population - El Salvador (%)
Place of birth for the foreign-born population - Guatemala (%)
Place of birth for the foreign-born population - Honduras (%)
Place of birth for the foreign-born population - Mexico (%)
Place of birth for the foreign-born population - Nicaragua (%)
Place of birth for the foreign-born population - Panama (%)
Place of birth for the foreign-born population - Other Central America (%)
Place of birth for the foreign-born population - Argentina (%)
Place of birth for the foreign-born population - Bolivia (%)
Place of birth for the foreign-born population - Brazil (%)
Place of birth for the foreign-born population - Chile (%)
Place of birth for the foreign-born population - Colombia (%)
Place of birth for the foreign-born population - Ecuador (%)
Place of birth for the foreign-born population - Guyana (%)
Place of birth for the foreign-born population - Peru (%)
Place of birth for the foreign-born population - Uruguay (%)
Place of birth for the foreign-born population - Venezuela (%)
Place of birth for the foreign-born population - Other South America (%)
Place of birth for the foreign-born population - Canada (%)
Place of birth for the foreign-born population - Other Northern America (%)
Place of birth for the foreign-born population - Other (%)
Latest news about races in Mission, TX collected exclusively by city-data.com from local newspapers, TV, and radio stations
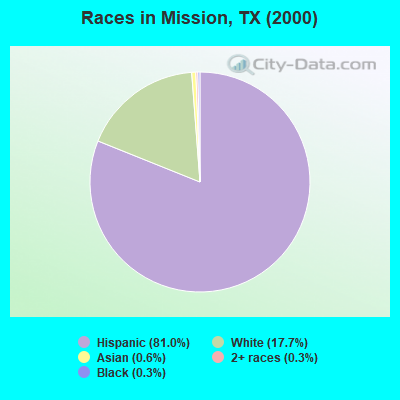
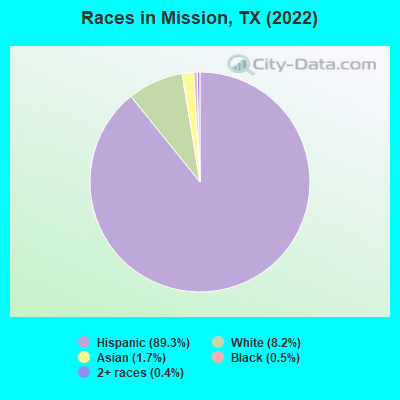
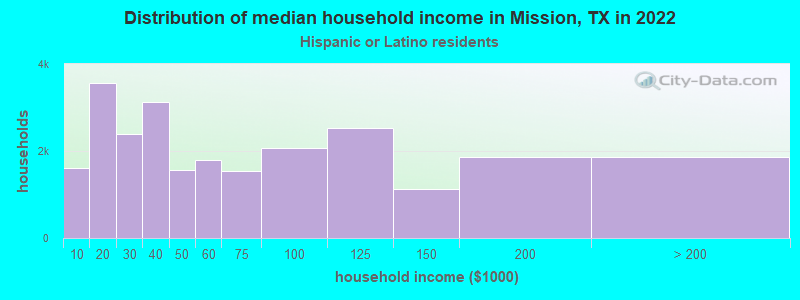
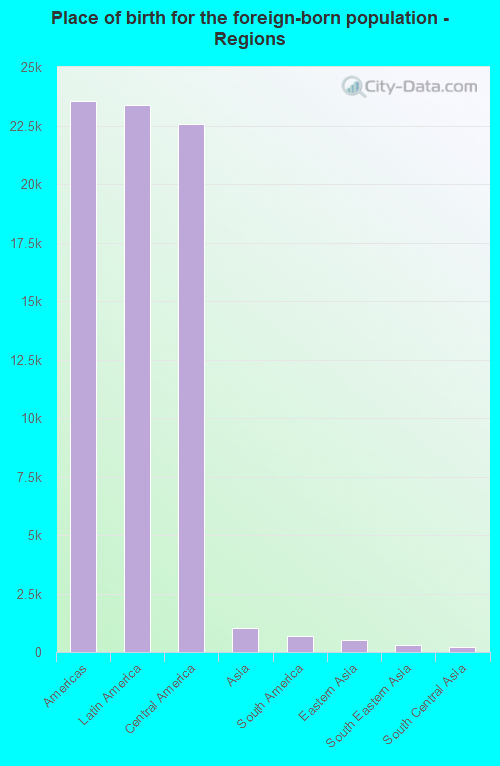
According to 2022 data, the most numerous races in Mission, TX are Hispanic (77,869 residents), White alone (7,155 residents), and Black alone (456 residents). 20.1% of Mission residents speak English at home. 28.5% of Mission, TX residents are foreign-born (26.3% born in Latin America), which is 40.4% greater than the foreign-born rate of 17.0% across the entire state of Texas.
Race distribution in Mission
2000 2022
10,933,313 52.4% White alone 6,669,666 32.0% Hispanic 2,364,255 11.3% Black alone 554,445 2.7% Asian alone 230,567 1.1% Two or more races 68,859 0.3% American Indian alone 19,958 0.10% Other race alone 10,757 0.05% Native Hawaiian and Other
12,070,642 40.2% Hispanic 11,683,430 38.9% White alone 3,508,706 11.7% Black alone 1,608,173 5.4% Asian alone 956,560 3.2% Two or more races 125,763 0.4% Other race alone 47,023 0.2% American Indian alone 29,275 0.10% Native Hawaiian and Other
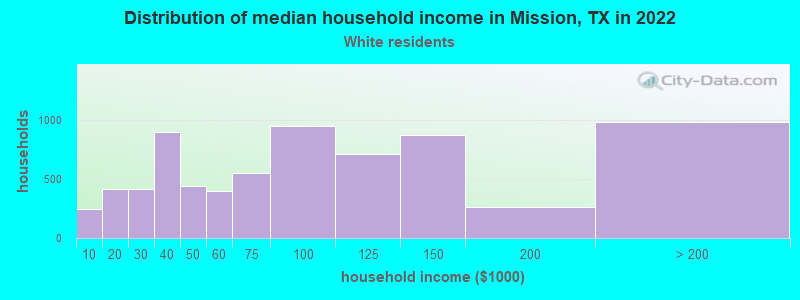
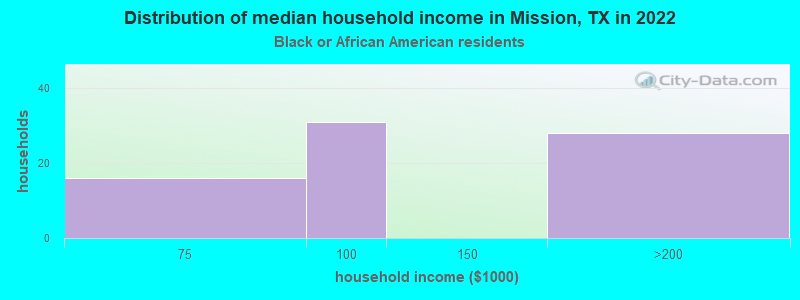
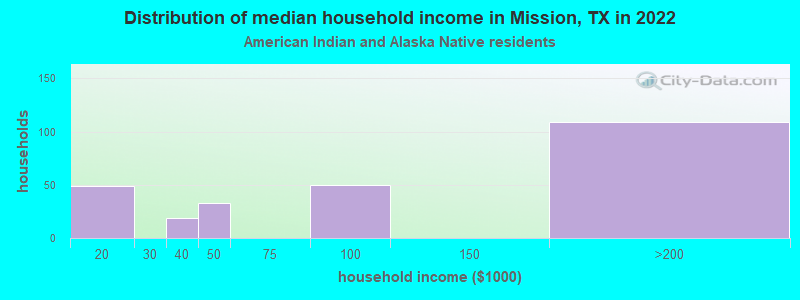
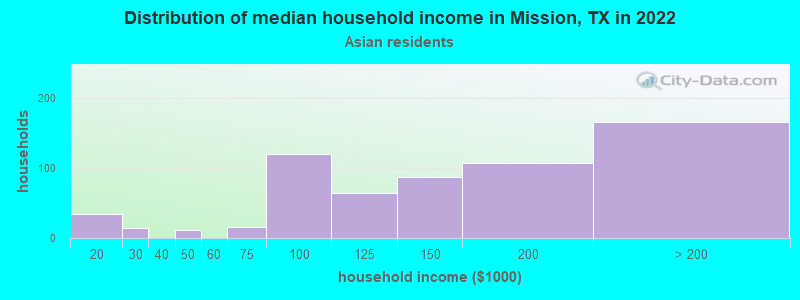
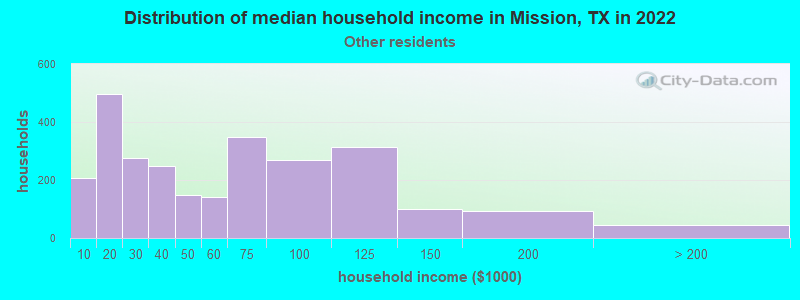
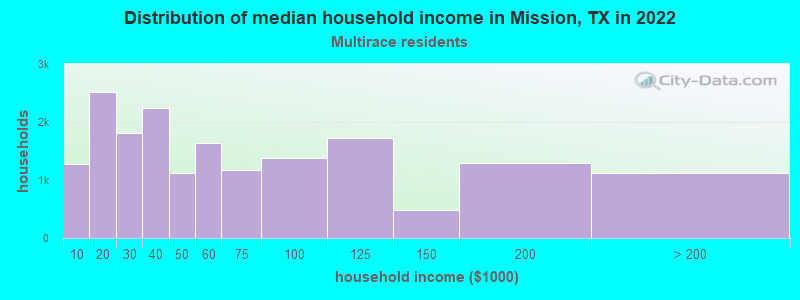
Income and house value in Mission Median household income in 2022 $65,361 White non-Hispanic householders$130,076 Asian householders$30,877 Some other race householders$47,139 Two or more races householders$52,405 Hispanic or Latino race householdersMedian 2022 house value $266,127 White Non-Hispanic householders$215,127 Black or African American householders$47,290 American Indian or Alaska Native householders $262,727 Asian householders$175,254 Some other race householders$145,890 Two or more races householders$177,109 Hispanic or Latino householders
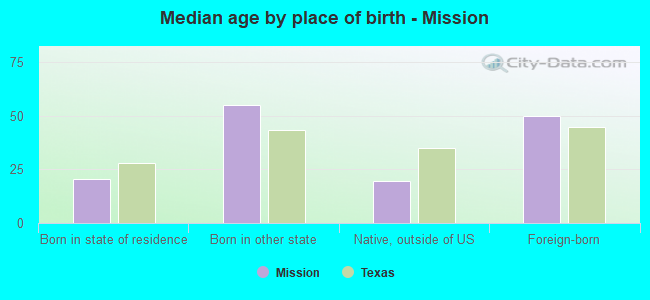
Median age by race in Mission
36.8 Median age for White residents38.2 36.5 63.1 Median age for Black or African American residents-666,666,666.0 -666,666,666.0 34.9 Median age for American Indian / Alaska Native residents26.1 36.8 49.9 Median age for Asian residents52.1 49.2 -666,666,666.0 Median age for Native Hawaiian / Pacific Islander residents-666,666,666.0 -666,666,666.0 45.3 Median age for Other race residents39.4 46.0 31.5 Median age for Two or more races residents32.2 30.0 61.2 Median age for White alone residents61.2 60.9 32.2 Median age for Hispanic or Latino residents32.8 31.6
Owner/renter occupied households by race in Mission
House owners and renters - White residents 6,301 88.3% Owner occupied838 11.7% Renter occupiedHouse owners and renters - Black or African American residents 89 100.0% Owner occupiedHouse owners and renters - American Indian / Alaska Native residents 279 90.5% Owner occupied29 9.5% Renter occupiedHouse owners and renters - Asian residents 193 47.1% Owner occupied217 52.9% Renter occupiedHouse owners and renters - Native Hawaiian / Pacific Islander residents 11 100.0% Owner occupiedHouse owners and renters - Other race residents 1,533 59.3% Owner occupied1,051 40.7% Renter occupiedHouse owners and renters - Two or more races residents 12,623 71.0% Owner occupied5,157 29.0% Renter occupiedHouse owners and renters - White alone residents 2,378 84.2% Owner occupied445 15.8% Renter occupiedHouse owners and renters - Hispanic or Latino residents 18,384 73.4% Owner occupied6,652 26.6% Renter occupied
Language usage in Mission
English speakers - Total 20.1% of residents of Mission speak English at home.
78.4% of residents speak Spanish at home 42,129 67.7% Speak English very well20,118 32.3% Speak English less than very well1.5% of residents speak other language at home 511 42.1% Speak English very well702 57.9% Speak English less than very well
English speakers - Born in the United States 48.5% of residents of Mission speak English at home.
50.4% of residents speak Spanish at home 3,448 86.9% Speak English very well522 13.1% Speak English less than very well1.2% of residents speak other language at home 93 100.0% Speak English very well
English speakers - Native, born elsewhere 0.0% of residents of Mission speak English at home.
100.0% of residents speak Spanish at home 434 69.1% Speak English very well194 30.9% Speak English less than very well
English speakers - Foreign-born 8.0% of residents of Mission speak English at home.
87.9% of residents speak Spanish at home 7,037 37.4% Speak English very well11,781 62.6% Speak English less than very well4.1% of residents speak other language at home 243 27.5% Speak English very well642 72.5% Speak English less than very well
White (Caucasian) - Speak only English Native:
47.2% (7,667)Foreign-born:
27.6% (574)
White (Caucasian) - Speak another language Native:
52.8% (8,560)Foreign-born:
72.4% (1,508)
Black or African American - Speak another language Native:
40.9% (157)Foreign-born:
100.0% (107)
American Indian / Alaska Native - Speak another language Native:
100.0% (337)Foreign-born:
98.9% (421)
Asian - Speak only English Native:
100.0% (162)Foreign-born:
11.1% (130)
Asian - Speak another language Native:
11.4% (18)Foreign-born:
88.9% (1,042)
Other race - Speak only English Native:
23.3% (785)Foreign-born:
4.4% (109)
Other race - Speak another language Native:
76.7% (2,588)Foreign-born:
95.6% (2,343)
Two or more races - Speak only English Native:
15.1% (5,677)Foreign-born:
6.5% (981)
Two or more races - Speak another language Native:
84.9% (31,986)Foreign-born:
93.5% (14,101)
White alone - Speak only English Native:
85.5% (5,603)Foreign-born:
25.1% (69)
White alone - Speak another language Native:
14.6% (954)Foreign-born:
77.6% (213)
Hispanic or Latino - Speak only English Native:
18.7% (9,734)Foreign-born:
7.8% (1,593)
Hispanic or Latino - Speak another language Native:
81.3% (42,241)Foreign-born:
92.2% (18,712)
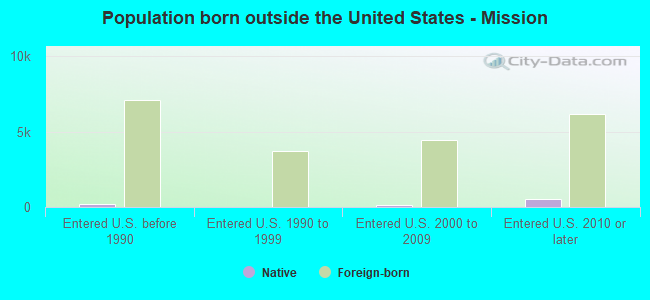
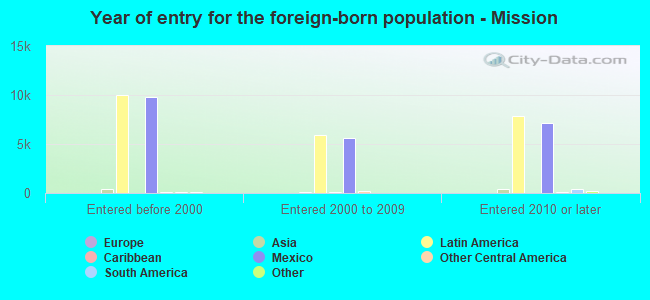
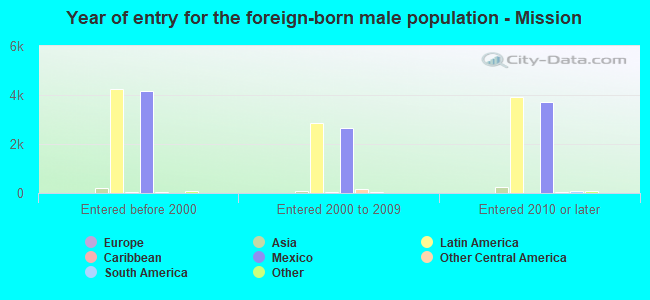
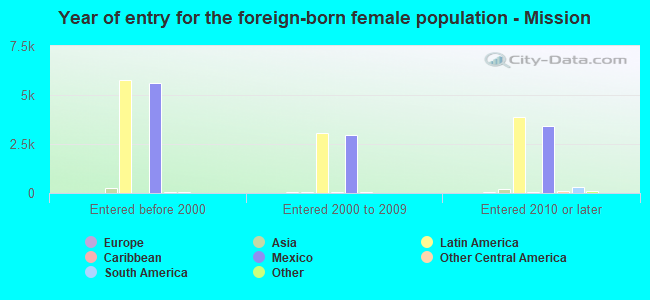
Foreign-born residents in Mission 24,876 residents are foreign born (26.3% Latin America ).
This city:
28.5%Texas:
17.1%
Marital status for residents in Mission Marital status - White (Caucasian) population 15 years and over
Males 31.7% Never married56.0% Now married1.4% Separated2.7% Widowed8.2% DivorcedFemales 29.1% Never married45.7% Now married0.6% Separated6.1% Widowed18.4% DivorcedWomen who gave birth in the past 12 months Now married:
65.1% (164)Unmarried:
34.9% (88)
Women who did not give birth in the past 12 months Now married:
49.5% (1,989)Unmarried:
50.5% (2,027)
Marital status - Black or African American population 15 years and over
Males 13.5% Never married42.8% Now married43.4% Separated0.0% Widowed0.3% DivorcedFemales 13.5% Never married55.9% Now married0.0% Separated18.0% Widowed12.6% DivorcedWomen who did not give birth in the past 12 months Now married:
68.1% (32)Unmarried:
31.9% (15)
Marital status - American Indian / Alaska Native population 15 years and over
Males 54.8% Never married40.2% Now married5.0% Separated0.0% Widowed0.0% DivorcedFemales 17.0% Never married80.0% Now married0.0% Separated3.0% Widowed0.0% DivorcedWomen who did not give birth in the past 12 months Now married:
81.2% (174)Unmarried:
18.8% (40)
Marital status - Asian population 15 years and over
Males 22.3% Never married77.7% Now married0.0% Separated0.0% Widowed0.0% DivorcedFemales 17.8% Never married73.7% Now married0.0% Separated8.6% Widowed0.0% DivorcedWomen who did not give birth in the past 12 months Now married:
77.1% (312)Unmarried:
22.9% (93)
Marital status - Other race population 15 years and over
Males 37.9% Never married48.7% Now married1.9% Separated5.2% Widowed6.3% DivorcedFemales 27.0% Never married58.2% Now married0.0% Separated8.1% Widowed6.7% DivorcedWomen who gave birth in the past 12 months Now married:
41.0% (52)Unmarried:
59.0% (75)
Women who did not give birth in the past 12 months Now married:
48.2% (807)Unmarried:
51.8% (869)
Marital status - Two or more races population 15 years and over
Males 39.1% Never married48.6% Now married1.2% Separated0.6% Widowed10.5% DivorcedFemales 32.6% Never married48.1% Now married5.0% Separated5.6% Widowed8.7% DivorcedWomen who gave birth in the past 12 months Now married:
58.2% (657)Unmarried:
41.8% (471)
Women who did not give birth in the past 12 months Now married:
44.9% (6,029)Unmarried:
55.1% (7,396)
Marital status - White alone, not Hispanic / Latino population 15 years and over
Males 13.4% Never married68.4% Now married0.0% Separated6.3% Widowed11.9% DivorcedFemales 7.0% Never married51.7% Now married0.0% Separated13.0% Widowed28.3% DivorcedWomen who gave birth in the past 12 months Now married:
69.7% (98)Unmarried:
30.3% (43)
Women who did not give birth in the past 12 months Now married:
42.2% (307)Unmarried:
57.8% (420)
Marital status - Hispanic or Latino population 15 years and over
Males 39.9% Never married48.3% Now married1.6% Separated1.1% Widowed9.1% DivorcedFemales 33.6% Never married47.9% Now married3.8% Separated5.3% Widowed9.4% DivorcedWomen who gave birth in the past 12 months Now married:
60.3% (716)Unmarried:
39.7% (471)
Women who did not give birth in the past 12 months Now married:
43.0% (7,760)Unmarried:
57.0% (10,275)
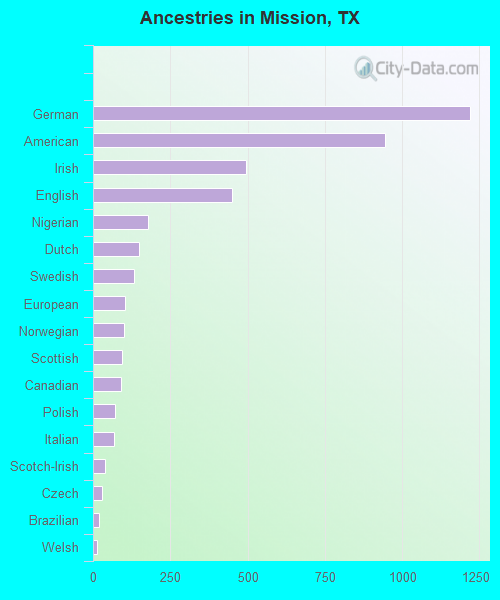
Ancestries in Mission
1,220 1.7% German945 1.4% American495 0.7% Irish451 0.6% English178 0.3% Nigerian149 0.2% Dutch132 0.2% Swedish105 0.2% European101 0.1% Norwegian94 0.1% Scottish90 0.1% Canadian72 0.1% Polish67 0.10% Italian38 0.05% Scotch-Irish30 0.04% Czech20 0.03% Brazilian12 0.02% Welsh11 0.02% Celtic10 0.01% French5 0.01% Finnish4 0.01% Latvian
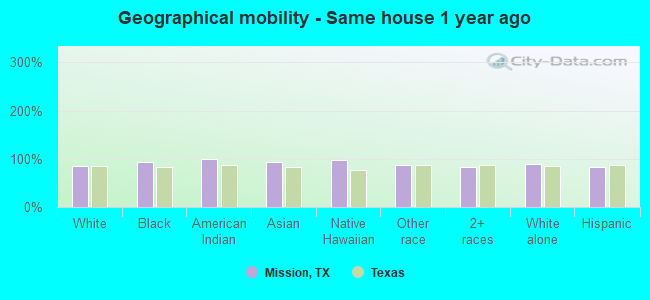
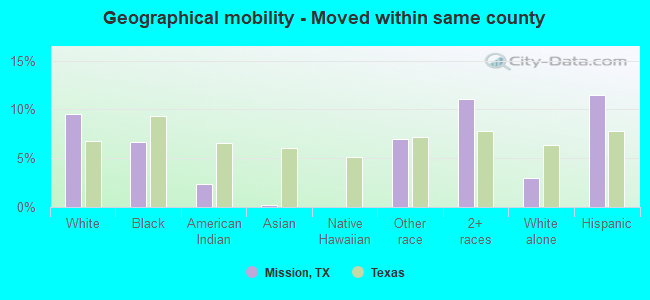
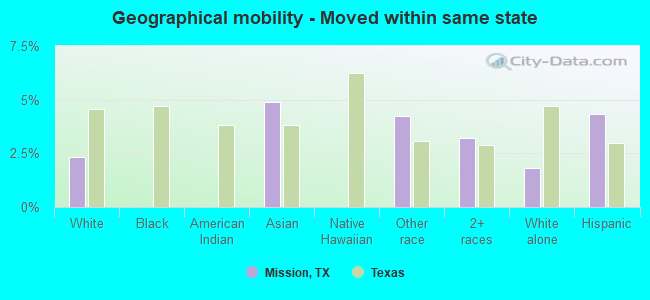
Geographical mobility in Mission Same house 1 year ago 17,078 85.8% White (Caucasian)514 93.2% Black or African American704 99.6% American Indian / Alaska Native1,505 93.5% Asian16 98.2% Native Hawaiian / Pacific Islander6,543 88.1% Other race47,603 83.9% Two or more races6,344 90.1% White alone, not Hispanic / Latino64,505 82.9% Hispanic or LatinoMoved within same county 1,906 9.6% White / Caucasian37 6.6% Black or African American17 2.4% American Indian / Alaska Native3 0.2% Asian515 6.9% Other race6,288 11.1% Two or more races207 2.9% White alone, not Hispanic / Latino8,903 11.4% Hispanic or LatinoMoved within same state 466 2.3% White / Caucasian79 4.9% Asian315 4.2% Other race1,822 3.2% Two or more races129 1.8% White alone, not Hispanic / Latino3,382 4.3% Hispanic or LatinoMoved from different state 383 1.9% White / Caucasian21 1.3% Asian3 0.0% Other race458 6.5% White alone, not Hispanic / LatinoMoved from abroad 278 1.4% White69 0.9% Other race1,009 1.8% Two or more races62 0.9% White alone, not Hispanic / Latino1,009 1.3% Hispanic or Latino
Children Nativity (place of birth) in Mission
Children under 6 years - Living with two parents Both parents native 1,970 100.0% NativeBoth parents foreign-born 1,100 100.0% NativeOne native, one foreign-born parent 1,700 100.0% NativeChildren under 6 years - Living with one parent Native parent 3,038 100.0% NativeForeign-born parent 397 62.6% Native237 37.4% Foreign-bornChildren 6 to 17 years - Living with two parents Both parents native 2,633 100.0% NativeBoth parents foreign-born 2,442 90.9% Native243 9.1% Foreign-bornOne native, one foreign-born parent 4,021 100.0% NativeChildren 6 to 17 years - Living with one parent Native parent 4,509 100.0% NativeForeign-born parent 3,676 52.9% Native3,275 47.1% Foreign-born
Grandparents responsible for own grandchildren in Mission
Grandparents (30 to 59 years) White / Caucasian 34 13.0% Responsible for grandchildren224 87.0% Not responsible for grandchildrenOther race 26 100.0% Not responsible for grandchildrenTwo or more races 733 70.2% Responsible for grandchildren311 29.8% Not responsible for grandchildrenWhite alone, not Hispanic / Latino 28 100.0% Not responsible for grandchildrenHispanic or Latino 733 66.7% Responsible for grandchildren366 33.3% Not responsible for grandchildrenGrandparents (60 years and over) White / Caucasian 98 18.1% Responsible for grandchildren443 81.9% Not responsible for grandchildrenOther race 80 32.9% Responsible for grandchildren164 67.1% Not responsible for grandchildrenTwo or more races 611 59.8% Responsible for grandchildren410 40.2% Not responsible for grandchildrenWhite alone, not Hispanic / Latino 15 52.9% Responsible for grandchildren13 47.1% Not responsible for grandchildrenHispanic or Latino 611 52.8% Responsible for grandchildren547 47.2% Not responsible for grandchildren