Races in Mineville-Witherbee, New York (NY) Detailed Stats
Ancestries, Foreign-born residents, place of birth

Discuss Mineville-Witherbee, New York races on our local forum with over 2,400,000 registered users
2.6% of Mineville-Witherbee, NY residents are foreign-born (1.9% born in Latin America, 0.7% born in North America), which is 754.1% less than the foreign-born rate of 22.0% across the entire state of New York.
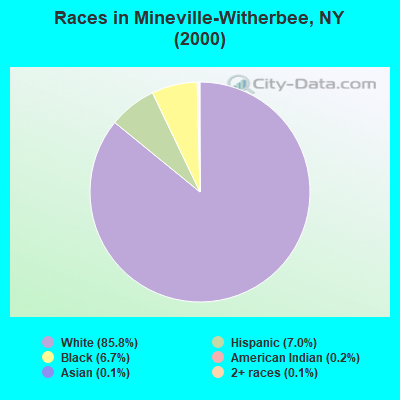
Race distribution in Mineville-Witherbee

- 1,49985.8%White alone
- 1227.0%Hispanic
- 1176.7%Black alone
- 40.2%American Indian alone
- 20.1%Asian alone
- 20.1%Two or more races
- 10.06%Native Hawaiian and Other
Pacific Islander alone
2000
2022
-
- 11,760,98162.0%White alone
- 2,867,58315.1%Hispanic
- 2,812,62314.8%Black alone
- 1,035,9265.5%Asian alone
- 366,1161.9%Two or more races
- 75,4990.4%Other race alone
- 52,4990.3%American Indian alone
- 5,2300.03%Native Hawaiian and Other
Pacific Islander alone

-
- 10,408,93352.9%White alone
- 3,867,29919.7%Hispanic
- 2,633,84013.4%Black alone
- 1,776,2869.0%Asian alone
- 732,6703.7%Two or more races
- 216,1101.1%Other race alone
- 35,0820.2%American Indian alone
- 6,9310.04%Native Hawaiian and Other
Pacific Islander alone

Income and house value in Mineville-Witherbee
- Median household income in 2022
- $65,642White non-Hispanic householders
- Median 2022 house value
- $141,468White Non-Hispanic householders
Household income for White non-Hispanic householders

Foreign-born residents in Mineville-Witherbee
45 residents are foreign born (1.9% Latin America, 0.7% North America).
| This city: | 2.6% |
| New York: | 20.4% |
Ancestries in Mineville-Witherbee

- 47627.7%French
- 25514.8%Other
- 19011.0%Irish
- 1579.1%French Canadian
- 1468.5%Polish
- 1357.8%Italian
- 985.7%German
- 865.0%English
- 854.9%United States
- 352.0%Scottish
- 120.7%Dutch
- 110.6%Lithuanian
- 80.5%Russian
- 80.5%Ukrainian
- 70.4%Scotch-Irish
- 60.3%Hungarian
- 50.3%Subsaharan African

Zip codes: 12956.