Races in Milton, Massachusetts (MA) Detailed Stats
Data:
Races - White alone (%)
Races - White alone (% change since 2000)
Races - Black alone (%)
Races - Black alone (% change since 2000)
Races - American Indian alone (%)
Races - American Indian alone (% change since 2000)
Races - Asian alone (%)
Races - Asian alone (% change since 2000)
Races - Hispanic (%)
Races - Hispanic (% change since 2000)
Races - Native Hawaiian and Other Pacific Islander alone (%)
Races - Native Hawaiian and Other Pacific Islander alone (% change since 2000)
Races - Two or more races(%)
Races - Two or more races(% change since 2000)
Races - Other race alone (%)
Races - Other race alone (% change since 2000)
Racial diversity
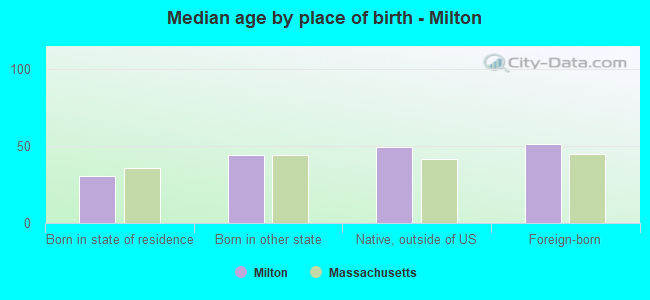
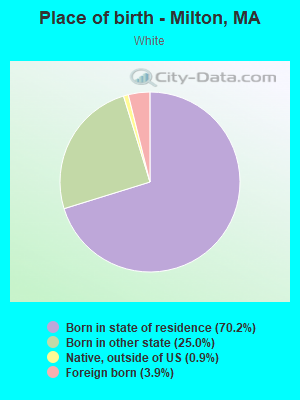
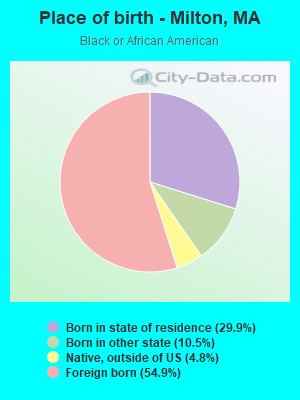
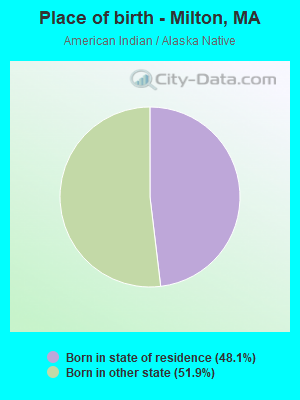
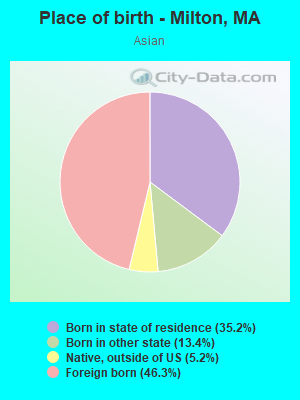
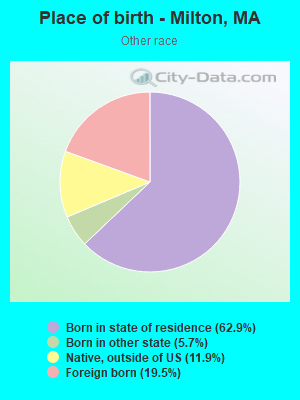
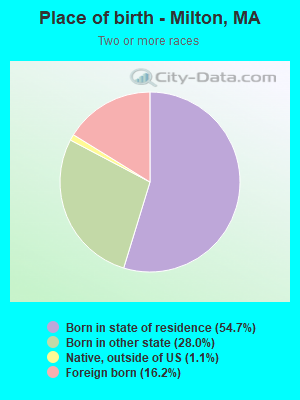
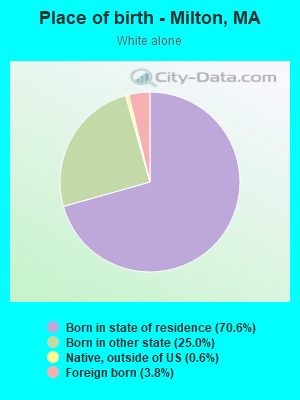
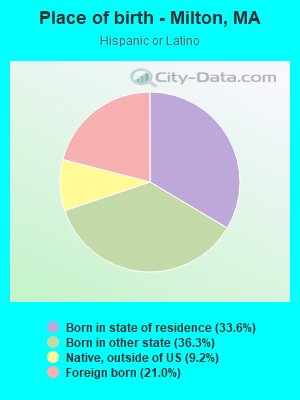
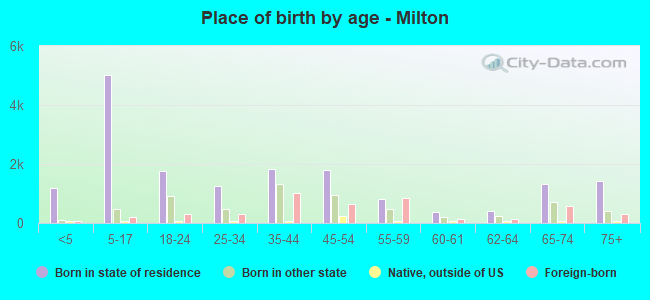
Place of birth - Born in state of residence (%)
Place of birth - Born in state of residence (%) - White
Place of birth - Born in state of residence (%) - Black or African American
Place of birth - Born in state of residence (%) - Asian
Place of birth - Born in state of residence (%) - Hispanic or Latino
Place of birth - Born in state of residence (%) - American Indian and Alaska Native
Place of birth - Born in state of residence (%) - Multirace
Place of birth - Born in state of residence (%) - Other Race
Place of birth - Born in other state (%)
Place of birth - Born in other state (%) - White
Place of birth - Born in other state (%) - Black or African American
Place of birth - Born in other state (%) - Asian
Place of birth - Born in other state (%) - Hispanic or Latino
Place of birth - Born in other state (%) - American Indian and Alaska Native
Place of birth - Born in other state (%) - Multirace
Place of birth - Born in other state (%) - Other Race
Place of birth - Native, outside of US (%)
Place of birth - Native, outside of US (%) - White
Place of birth - Native, outside of US (%) - Black or African American
Place of birth - Native, outside of US (%) - Asian
Place of birth - Native, outside of US (%) - Hispanic or Latino
Place of birth - Native, outside of US (%) - American Indian and Alaska Native
Place of birth - Native, outside of US (%) - Multirace
Place of birth - Native, outside of US (%) - Other Race
Place of birth - Foreign born (%)
Place of birth - Foreign born (%) - White
Place of birth - Foreign born (%) - Black or African American
Place of birth - Foreign born (%) - Asian
Place of birth - Foreign born (%) - Hispanic or Latino
Place of birth - Foreign born (%) - American Indian and Alaska Native
Place of birth - Foreign born (%) - Multirace
Place of birth - Foreign born (%) - Other Race
Residents speaking English at home (%)
Residents speaking English at home - Born in the United States (%)
Residents speaking English at home - Native, born elsewhere (%)
Residents speaking English at home - Foreign born (%)
Residents speaking Spanish at home (%)
Residents speaking Spanish at home - Born in the United States (%)
Residents speaking Spanish at home - Native, born elsewhere (%)
Residents speaking Spanish at home - Foreign born (%)
Residents speaking other language at home (%)
Residents speaking other language at home - Born in the United States (%)
Residents speaking other language at home - Native, born elsewhere (%)
Residents speaking other language at home - Foreign born (%)
Marital status - Never married (%)
Marital status - Now married (%)
Marital status - Separated (%)
Marital status - Widowed (%)
Marital status - Divorced (%)
Ancestries Reported - Arab (%)
Ancestries Reported - Czech (%)
Ancestries Reported - Danish (%)
Ancestries Reported - Dutch (%)
Ancestries Reported - English (%)
Ancestries Reported - French (%)
Ancestries Reported - French Canadian (%)
Ancestries Reported - German (%)
Ancestries Reported - Greek (%)
Ancestries Reported - Hungarian (%)
Ancestries Reported - Irish (%)
Ancestries Reported - Italian (%)
Ancestries Reported - Lithuanian (%)
Ancestries Reported - Norwegian (%)
Ancestries Reported - Polish (%)
Ancestries Reported - Portuguese (%)
Ancestries Reported - Russian (%)
Ancestries Reported - Scotch-Irish (%)
Ancestries Reported - Scottish (%)
Ancestries Reported - Slovak (%)
Ancestries Reported - Subsaharan African (%)
Ancestries Reported - Swedish (%)
Ancestries Reported - Swiss (%)
Ancestries Reported - Ukrainian (%)
Ancestries Reported - United States (%)
Ancestries Reported - Welsh (%)
Ancestries Reported - West Indian (%)
Ancestries Reported - Other (%)
Geographical mobility - Same house 1 year ago (%)
Geographical mobility - Same house 1 year ago (%) - White
Geographical mobility - Same house 1 year ago (%) - Black or African American
Geographical mobility - Same house 1 year ago (%) - Asian
Geographical mobility - Same house 1 year ago (%) - Hispanic or Latino
Geographical mobility - Same house 1 year ago (%) - American Indian and Alaska Native
Geographical mobility - Same house 1 year ago (%) - Multirace
Geographical mobility - Same house 1 year ago (%) - Other Race
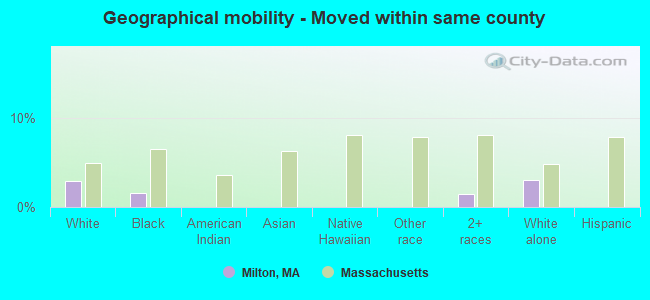
Geographical mobility - Moved within same county (%)
Geographical mobility - Moved within same county (%) - White
Geographical mobility - Moved within same county (%) - Black or African American
Geographical mobility - Moved within same county (%) - Asian
Geographical mobility - Moved within same county (%) - Hispanic or Latino
Geographical mobility - Moved within same county (%) - American Indian and Alaska Native
Geographical mobility - Moved within same county (%) - Multirace
Geographical mobility - Moved within same county (%) - Other Race
Geographical mobility - Moved from different county within same state (%)
Geographical mobility - Moved from different county within same state (%) - White
Geographical mobility - Moved from different county within same state (%) - Black or African American
Geographical mobility - Moved from different county within same state (%) - Asian
Geographical mobility - Moved from different county within same state (%) - Hispanic or Latino
Geographical mobility - Moved from different county within same state (%) - American Indian and Alaska Native
Geographical mobility - Moved from different county within same state (%) - Multirace
Geographical mobility - Moved from different county within same state (%) - Other Race
Geographical mobility - Moved from different state (%)
Geographical mobility - Moved from different state (%) - White
Geographical mobility - Moved from different state (%) - Black or African American
Geographical mobility - Moved from different state (%) - Asian
Geographical mobility - Moved from different state (%) - Hispanic or Latino
Geographical mobility - Moved from different state (%) - American Indian and Alaska Native
Geographical mobility - Moved from different state (%) - Multirace
Geographical mobility - Moved from different state (%) - Other Race
Geographical mobility - Moved from abroad (%)
Geographical mobility - Moved from abroad (%) - White
Geographical mobility - Moved from abroad (%) - Black or African American
Geographical mobility - Moved from abroad (%) - Asian
Geographical mobility - Moved from abroad (%) - Hispanic or Latino
Geographical mobility - Moved from abroad (%) - American Indian and Alaska Native
Geographical mobility - Moved from abroad (%) - Multirace
Geographical mobility - Moved from abroad (%) - Other Race
Place of birth for the foreign-born population - Ireland (%)
Place of birth for the foreign-born population - Denmark (%)
Place of birth for the foreign-born population - Norway (%)
Place of birth for the foreign-born population - Sweden (%)
Place of birth for the foreign-born population - United Kingdom (%)
Place of birth for the foreign-born population - England (%)
Place of birth for the foreign-born population - Scotland (%)
Place of birth for the foreign-born population - Other Northern Europe (%)
Place of birth for the foreign-born population - Austria (%)
Place of birth for the foreign-born population - Belgium (%)
Place of birth for the foreign-born population - France (%)
Place of birth for the foreign-born population - Germany (%)
Place of birth for the foreign-born population - Netherlands (%)
Place of birth for the foreign-born population - Switzerland (%)
Place of birth for the foreign-born population - Other Western Europe (%)
Place of birth for the foreign-born population - Greece (%)
Place of birth for the foreign-born population - Italy (%)
Place of birth for the foreign-born population - Portugal (%)
Place of birth for the foreign-born population - Spain (%)
Place of birth for the foreign-born population - Other Southern Europe (%)
Place of birth for the foreign-born population - Albania (%)
Place of birth for the foreign-born population - Belarus (%)
Place of birth for the foreign-born population - Bosnia and Herzegovina (%)
Place of birth for the foreign-born population - Bulgaria (%)
Place of birth for the foreign-born population - Croatia (%)
Place of birth for the foreign-born population - Czechoslovakia (%)
Place of birth for the foreign-born population - Hungary (%)
Place of birth for the foreign-born population - Latvia (%)
Place of birth for the foreign-born population - Lithuania (%)
Place of birth for the foreign-born population - North Macedonia (Macedonia) (%)
Place of birth for the foreign-born population - Moldova (%)
Place of birth for the foreign-born population - Poland (%)
Place of birth for the foreign-born population - Romania (%)
Place of birth for the foreign-born population - Russia (%)
Place of birth for the foreign-born population - Serbia (%)
Place of birth for the foreign-born population - Ukraine (%)
Place of birth for the foreign-born population - Other Eastern Europe (%)
Place of birth for the foreign-born population - China (%)
Place of birth for the foreign-born population - Hong Kong (%)
Place of birth for the foreign-born population - Taiwan (%)
Place of birth for the foreign-born population - Japan (%)
Place of birth for the foreign-born population - Korea (%)
Place of birth for the foreign-born population - Other Eastern Asia (%)
Place of birth for the foreign-born population - Afghanistan (%)
Place of birth for the foreign-born population - Bangladesh (%)
Place of birth for the foreign-born population - India (%)
Place of birth for the foreign-born population - Iran (%)
Place of birth for the foreign-born population - Kazakhstan (%)
Place of birth for the foreign-born population - Nepal (%)
Place of birth for the foreign-born population - Pakistan (%)
Place of birth for the foreign-born population - Sri Lanka (%)
Place of birth for the foreign-born population - Uzbekistan (%)
Place of birth for the foreign-born population - Other South Central Asia (%)
Place of birth for the foreign-born population - Burma (%)
Place of birth for the foreign-born population - Cambodia (%)
Place of birth for the foreign-born population - Indonesia (%)
Place of birth for the foreign-born population - Laos (%)
Place of birth for the foreign-born population - Malaysia (%)
Place of birth for the foreign-born population - Philippines (%)
Place of birth for the foreign-born population - Singapore (%)
Place of birth for the foreign-born population - Thailand (%)
Place of birth for the foreign-born population - Vietnam (%)
Place of birth for the foreign-born population - Other South Eastern Asia (%)
Place of birth for the foreign-born population - Armenia (%)
Place of birth for the foreign-born population - Iraq (%)
Place of birth for the foreign-born population - Israel (%)
Place of birth for the foreign-born population - Jordan (%)
Place of birth for the foreign-born population - Kuwait (%)
Place of birth for the foreign-born population - Lebanon (%)
Place of birth for the foreign-born population - Saudi Arabia (%)
Place of birth for the foreign-born population - Syria (%)
Place of birth for the foreign-born population - Turkey (%)
Place of birth for the foreign-born population - Yemen (%)
Place of birth for the foreign-born population - Other Western Asia (%)
Place of birth for the foreign-born population - Eritrea (%)
Place of birth for the foreign-born population - Ethiopia (%)
Place of birth for the foreign-born population - Kenya (%)
Place of birth for the foreign-born population - Somalia (%)
Place of birth for the foreign-born population - Uganda (%)
Place of birth for the foreign-born population - Zimbabwe (%)
Place of birth for the foreign-born population - Other Eastern Africa (%)
Place of birth for the foreign-born population - Cameroon (%)
Place of birth for the foreign-born population - Congo (%)
Place of birth for the foreign-born population - Democratic Republic of Congo (Zaire) (%)
Place of birth for the foreign-born population - Other Middle Africa (%)
Place of birth for the foreign-born population - Egypt (%)
Place of birth for the foreign-born population - Morocco (%)
Place of birth for the foreign-born population - Sudan (%)
Place of birth for the foreign-born population - Other Northern Africa (%)
Place of birth for the foreign-born population - South Africa (%)
Place of birth for the foreign-born population - Other Southern Africa (%)
Place of birth for the foreign-born population - Cabo Verde (%)
Place of birth for the foreign-born population - Ghana (%)
Place of birth for the foreign-born population - Liberia (%)
Place of birth for the foreign-born population - Nigeria (%)
Place of birth for the foreign-born population - Senegal (%)
Place of birth for the foreign-born population - Sierra Leone (%)
Place of birth for the foreign-born population - Other Western Africa (%)
Place of birth for the foreign-born population - Australia (%)
Place of birth for the foreign-born population - New Zealand (%)
Place of birth for the foreign-born population - Fiji (%)
Place of birth for the foreign-born population - Micronesia (%)
Place of birth for the foreign-born population - Bahamas (%)
Place of birth for the foreign-born population - Barbados (%)
Place of birth for the foreign-born population - Cuba (%)
Place of birth for the foreign-born population - Dominica (%)
Place of birth for the foreign-born population - Dominican Republic (%)
Place of birth for the foreign-born population - Grenada (%)
Place of birth for the foreign-born population - Haiti (%)
Place of birth for the foreign-born population - Jamaica (%)
Place of birth for the foreign-born population - St. Vincent and the Grenadines (%)
Place of birth for the foreign-born population - Trinidad and Tobago (%)
Place of birth for the foreign-born population - West Indies (%)
Place of birth for the foreign-born population - Other Caribbean (%)
Place of birth for the foreign-born population - Belize (%)
Place of birth for the foreign-born population - Costa Rica (%)
Place of birth for the foreign-born population - El Salvador (%)
Place of birth for the foreign-born population - Guatemala (%)
Place of birth for the foreign-born population - Honduras (%)
Place of birth for the foreign-born population - Mexico (%)
Place of birth for the foreign-born population - Nicaragua (%)
Place of birth for the foreign-born population - Panama (%)
Place of birth for the foreign-born population - Other Central America (%)
Place of birth for the foreign-born population - Argentina (%)
Place of birth for the foreign-born population - Bolivia (%)
Place of birth for the foreign-born population - Brazil (%)
Place of birth for the foreign-born population - Chile (%)
Place of birth for the foreign-born population - Colombia (%)
Place of birth for the foreign-born population - Ecuador (%)
Place of birth for the foreign-born population - Guyana (%)
Place of birth for the foreign-born population - Peru (%)
Place of birth for the foreign-born population - Uruguay (%)
Place of birth for the foreign-born population - Venezuela (%)
Place of birth for the foreign-born population - Other South America (%)
Place of birth for the foreign-born population - Canada (%)
Place of birth for the foreign-born population - Other Northern America (%)
Place of birth for the foreign-born population - Other (%)
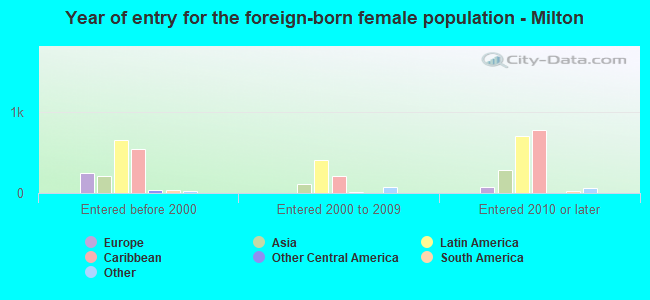
According to 2022 data, the most numerous races in Milton, MA are White alone (19,114 residents), Hispanic (1,182 residents), and Asian alone (1,687 residents). 79.9% of Milton residents speak English at home. 16.0% of Milton, MA residents are foreign-born (8.7% born in Latin America, 3.1% born in Asia, 2.5% born in Europe), which is 12.6% less than the foreign-born rate of 18.0% across the entire state of Massachusetts.
Race distribution in Milton
2000 2022
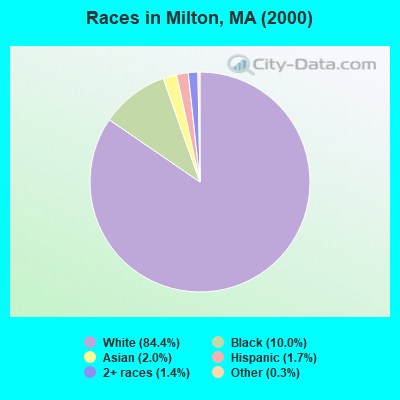
5,198,359 81.9% White alone 428,729 6.8% Hispanic 318,329 5.0% Black alone 236,786 3.7% Asian alone 110,338 1.7% Two or more races 43,586 0.7% Other race alone 11,264 0.2% American Indian alone 1,706 0.03% Native Hawaiian and Other
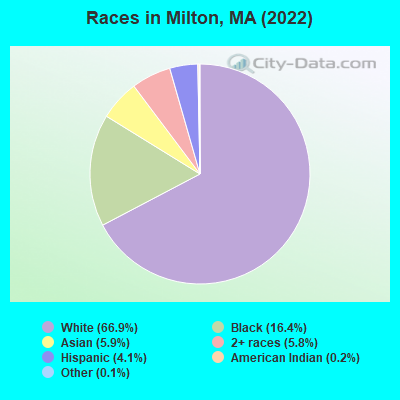
4,676,627 67.0% White alone 911,038 13.0% Hispanic 501,463 7.2% Asian alone 459,740 6.6% Black alone 341,889 4.9% Two or more races 84,403 1.2% Other race alone 5,838 0.08% American Indian alone 976 0.01% Native Hawaiian and Other
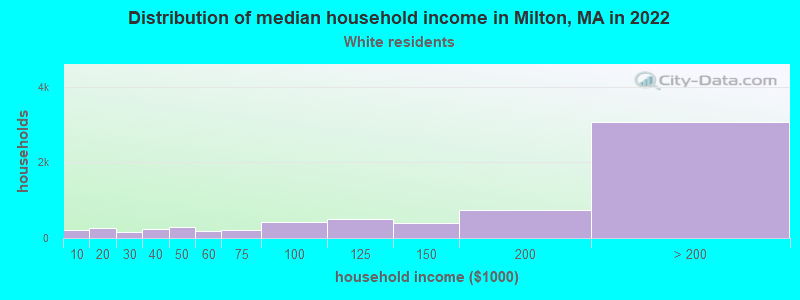
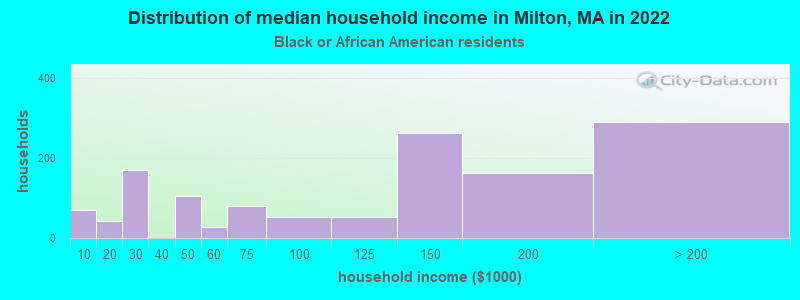
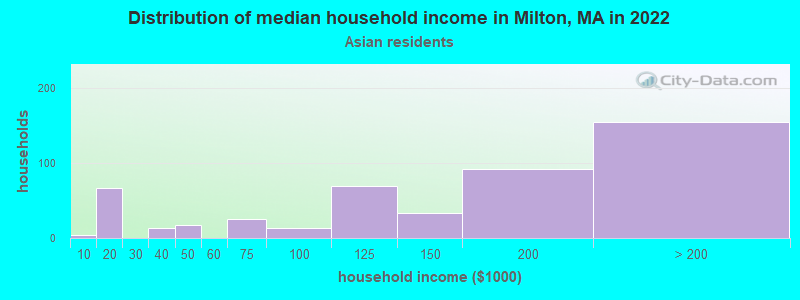
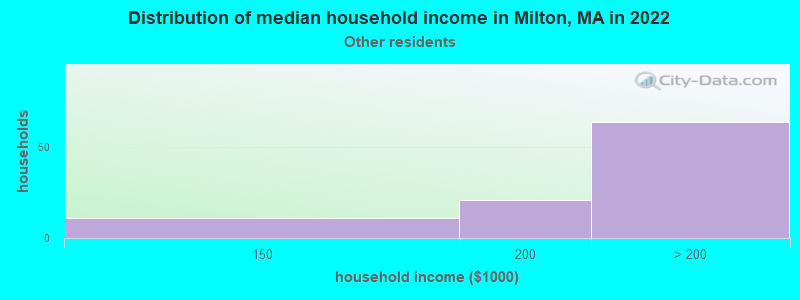
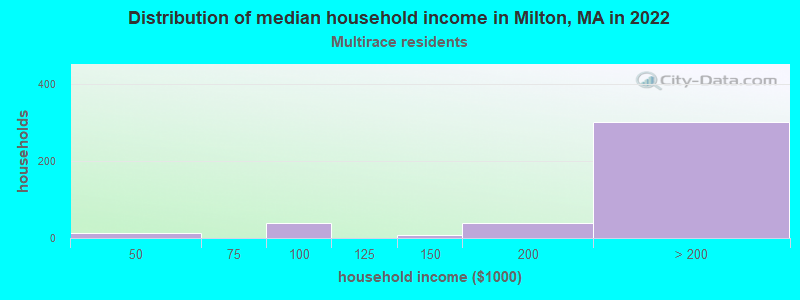
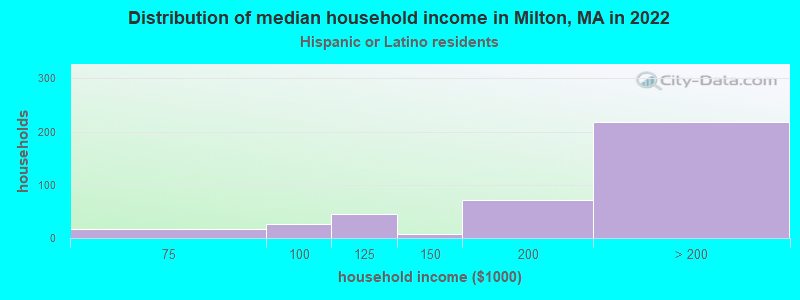
Income and house value in Milton Median household income in 2022 $167,680 White non-Hispanic householders$138,358 Black householders$147,030 Asian householders$167,580 Some other race householdersover $200,000 Two or more races householdersover $200,000 Hispanic or Latino race householdersMedian 2022 house value $919,168 White Non-Hispanic householders$739,695 Black or African American householders$776,664 American Indian or Alaska Native householders over $1,000,000 Asian householders$742,538 Some other race householders$526,728 Two or more races householders$548,846 Hispanic or Latino householders
Median age by race in Milton
41.8 Median age for White residents41.8 41.7 43.4 Median age for Black or African American residents41.0 53.3 28.4 Median age for American Indian / Alaska Native residents-649,474,688.9 -657,223,795.4 37.3 Median age for Asian residents33.7 37.7 -514,227,641.8 Median age for Native Hawaiian / Pacific Islander residents-513,131,312.6 -508,717,948.2 34.0 Median age for Other race residents35.9 44.5 19.6 Median age for Two or more races residents24.9 17.4 41.5 Median age for White alone residents41.3 41.9 36.1 Median age for Hispanic or Latino residents46.6 33.8
Owner/renter occupied households by race in Milton
House owners and renters - White residents 5,983 88.3% Owner occupied793 11.7% Renter occupiedHouse owners and renters - Black or African American residents 855 61.1% Owner occupied545 38.9% Renter occupiedHouse owners and renters - American Indian / Alaska Native residents 27 100.0% Owner occupiedHouse owners and renters - Asian residents 515 100.0% Owner occupiedHouse owners and renters - Other race residents 102 100.0% Owner occupiedHouse owners and renters - Two or more races residents 411 93.5% Owner occupied29 6.5% Renter occupiedHouse owners and renters - White alone residents 5,878 87.9% Owner occupied809 12.1% Renter occupiedHouse owners and renters - Hispanic or Latino residents 465 100.0% Owner occupied
Language usage in Milton
English speakers - Total 79.9% of residents of Milton speak English at home.
2.9% of residents speak Spanish at home 657 82.8% Speak English very well136 17.2% Speak English less than very well16.9% of residents speak other language at home 3,552 77.2% Speak English very well1,048 22.8% Speak English less than very well
English speakers - Born in the United States 86.5% of residents of Milton speak English at home.
3.6% of residents speak Spanish at home 200 90.5% Speak English very well21 9.5% Speak English less than very well10.3% of residents speak other language at home 606 95.7% Speak English very well27 4.3% Speak English less than very well
English speakers - Native, born elsewhere 71.5% of residents of Milton speak English at home.
21.5% of residents speak Spanish at home 93 80.2% Speak English very well23 19.8% Speak English less than very well9.3% of residents speak other language at home 40 80.0% Speak English very well10 20.0% Speak English less than very well
English speakers - Foreign-born 36.3% of residents of Milton speak English at home.
4.4% of residents speak Spanish at home 155 76.4% Speak English very well48 23.6% Speak English less than very well57.9% of residents speak other language at home 1,847 69.3% Speak English very well818 30.7% Speak English less than very well
White (Caucasian) - Speak only English Native:
93.6% (16,492)Foreign-born:
49.5% (370)
White (Caucasian) - Speak another language Native:
6.5% (1,142)Foreign-born:
50.0% (373)
Black or African American - Speak only English Native:
81.9% (1,626)Foreign-born:
33.5% (852)
Black or African American - Speak another language Native:
18.1% (360)Foreign-born:
61.2% (1,553)
Asian - Speak only English Native:
50.9% (442)Foreign-born:
15.1% (126)
Asian - Speak another language Native:
49.3% (428)Foreign-born:
85.4% (713)
Other race - Speak another language Native:
58.8% (191)Foreign-born:
98.2% (78)
Two or more races - Speak only English Native:
76.3% (1,383)Foreign-born:
36.1% (141)
Two or more races - Speak another language Native:
24.1% (436)Foreign-born:
59.8% (234)
White alone - Speak only English Native:
93.8% (16,460)Foreign-born:
50.5% (366)
White alone - Speak another language Native:
6.4% (1,115)Foreign-born:
47.4% (343)
Hispanic or Latino - Speak only English Native:
49.5% (439)Foreign-born:
5.1% (13)
Hispanic or Latino - Speak another language Native:
50.7% (450)Foreign-born:
96.0% (238)
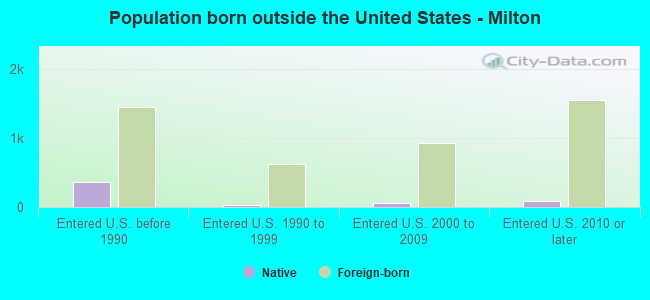
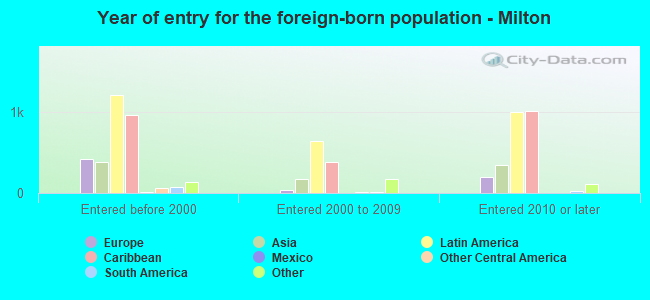
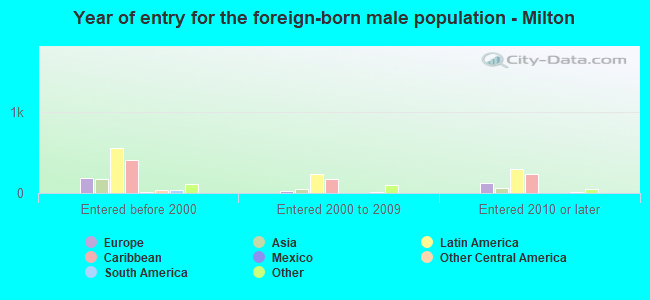
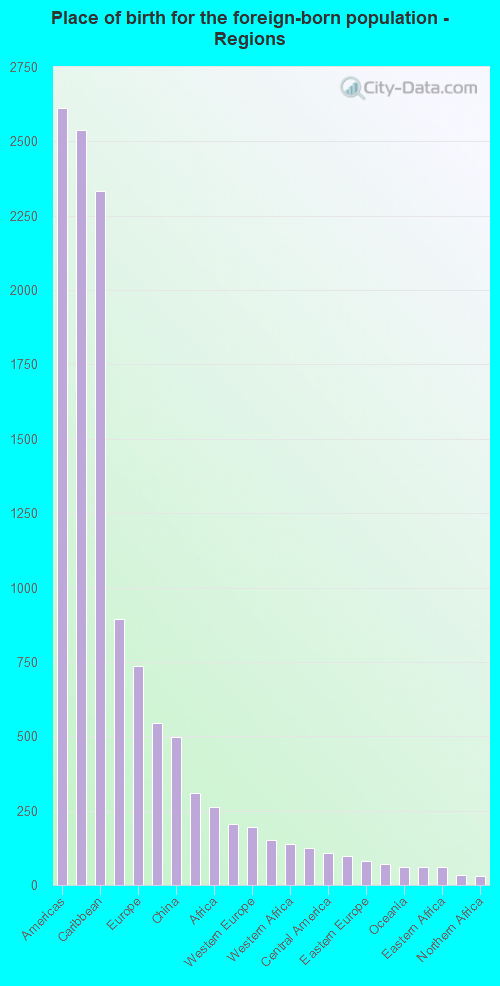
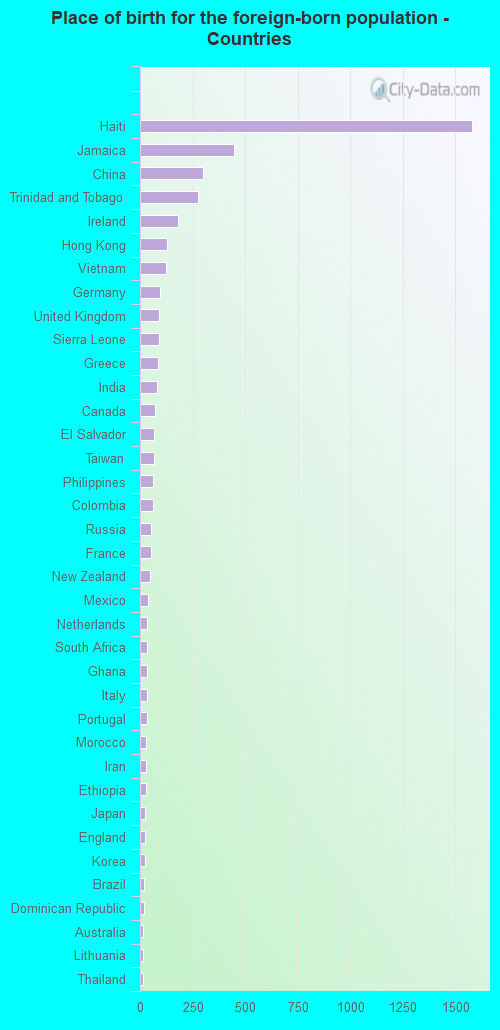
Foreign-born residents in Milton 4,568 residents are foreign born (8.7% Latin America , 3.1% Asia , 2.5% Europe ).
This city:
16.0%Massachusetts:
17.6%
Marital status for residents in Milton Marital status - White (Caucasian) population 15 years and over
Males 25.4% Never married67.2% Now married0.1% Separated2.3% Widowed5.0% DivorcedFemales 30.5% Never married53.9% Now married0.5% Separated7.2% Widowed7.9% DivorcedWomen who gave birth in the past 12 months Now married:
100.0% (244)Unmarried:
0.0% (0)
Women who did not give birth in the past 12 months Now married:
45.2% (1,925)Unmarried:
54.8% (2,332)
Marital status - Black or African American population 15 years and over
Males 35.8% Never married46.9% Now married2.2% Separated1.9% Widowed13.1% DivorcedFemales 38.4% Never married33.7% Now married1.1% Separated7.3% Widowed19.4% DivorcedWomen who did not give birth in the past 12 months Now married:
28.2% (251)Unmarried:
71.8% (639)
Marital status - American Indian / Alaska Native population 15 years and over
Males 0.0% Never married0.0% Now married0.0% Separated0.0% Widowed100.0% DivorcedFemales 77.1% Never married0.0% Now married0.0% Separated22.9% Widowed0.0% DivorcedWomen who did not give birth in the past 12 months Now married:
0.0% (0)Unmarried:
100.0% (32)
Marital status - Asian population 15 years and over
Males 38.3% Never married61.1% Now married0.0% Separated0.0% Widowed0.5% DivorcedFemales 31.8% Never married58.4% Now married0.0% Separated4.0% Widowed5.8% DivorcedWomen who gave birth in the past 12 months Now married:
100.0% (42)Unmarried:
0.0% (0)
Women who did not give birth in the past 12 months Now married:
44.3% (239)Unmarried:
55.7% (300)
Marital status - Other race population 15 years and over
Males 70.5% Never married29.5% Now married0.0% Separated0.0% Widowed0.0% DivorcedFemales 47.7% Never married45.0% Now married0.0% Separated0.0% Widowed7.4% DivorcedWomen who did not give birth in the past 12 months Now married:
47.0% (100)Unmarried:
53.0% (112)
Marital status - Two or more races population 15 years and over
Males 48.4% Never married46.9% Now married0.0% Separated0.8% Widowed3.9% DivorcedFemales 46.7% Never married49.5% Now married0.0% Separated2.4% Widowed1.5% DivorcedWomen who gave birth in the past 12 months Now married:
100.0% (7)Unmarried:
0.0% (0)
Women who did not give birth in the past 12 months Now married:
47.1% (243)Unmarried:
52.9% (272)
Marital status - White alone, not Hispanic / Latino population 15 years and over
Males 25.1% Never married67.3% Now married0.1% Separated2.4% Widowed5.1% DivorcedFemales 30.2% Never married54.1% Now married0.5% Separated7.2% Widowed7.9% DivorcedWomen who gave birth in the past 12 months Now married:
100.0% (248)Unmarried:
0.0% (0)
Women who did not give birth in the past 12 months Now married:
45.5% (1,930)Unmarried:
54.5% (2,316)
Marital status - Hispanic or Latino population 15 years and over
Males 40.1% Never married55.1% Now married0.0% Separated0.0% Widowed4.8% DivorcedFemales 31.7% Never married51.5% Now married0.0% Separated0.0% Widowed16.8% DivorcedWomen who did not give birth in the past 12 months Now married:
50.1% (196)Unmarried:
49.9% (195)
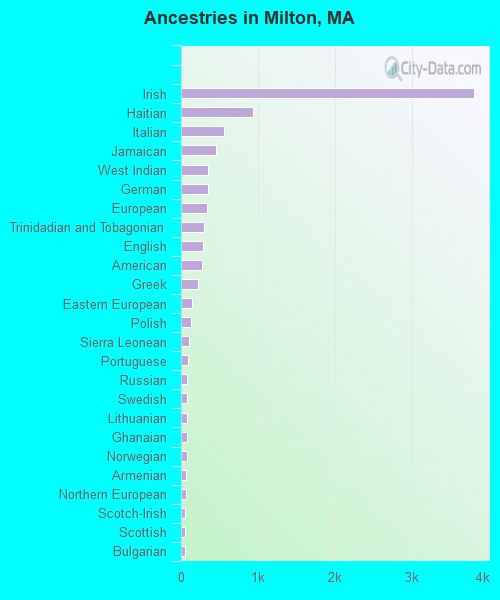
Ancestries in Milton
3,810 29.3% Irish940 7.2% Haitian559 4.3% Italian459 3.5% Jamaican357 2.7% West Indian349 2.7% German341 2.6% European302 2.3% Trinidadian and Tobagonian280 2.2% English277 2.1% American216 1.7% Greek147 1.1% Eastern European126 1.0% Polish104 0.8% Sierra Leonean92 0.7% Portuguese84 0.6% Russian81 0.6% Swedish79 0.6% Lithuanian75 0.6% Ghanaian73 0.6% Norwegian66 0.5% Armenian64 0.5% Northern European54 0.4% Scotch-Irish54 0.4% Scottish49 0.4% Bulgarian49 0.4% Somali48 0.4% Moroccan43 0.3% French40 0.3% South African36 0.3% U.S. Virgin Islander35 0.3% French Canadian25 0.2% Iranian25 0.2% Ukrainian21 0.2% Canadian19 0.1% Croatian18 0.1% Ethiopian12 0.09% Lebanese12 0.09% Syrian12 0.09% Romanian12 0.09% Dutch12 0.09% Belizean11 0.08% Czechoslovakian11 0.08% British10 0.08% Nigerian10 0.08% Czech9 0.07% Celtic7 0.05% Welsh5 0.04% Cajun5 0.04% Turkish4 0.03% Brazilian3 0.02% Cape Verdean
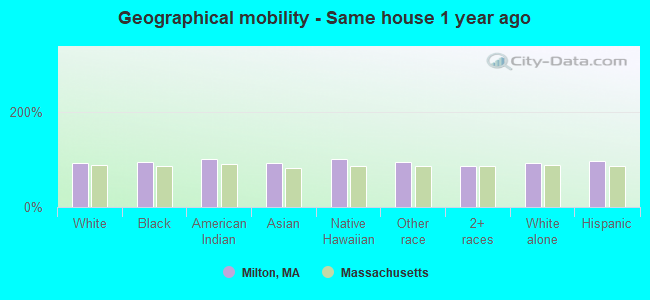
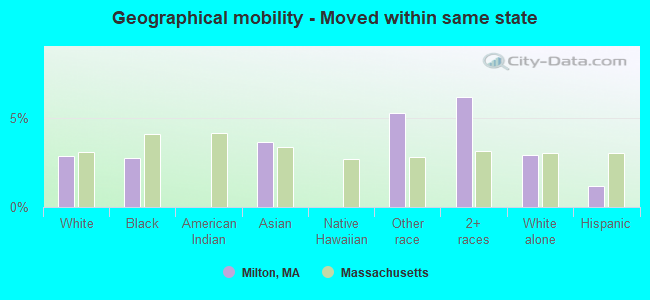
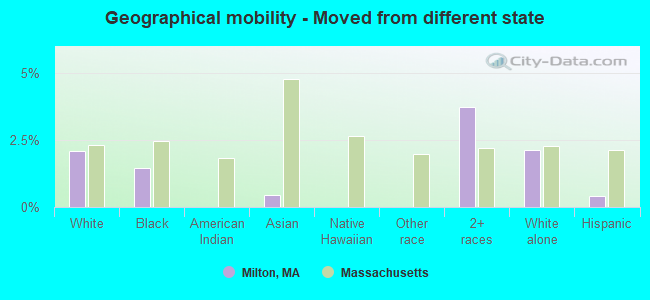
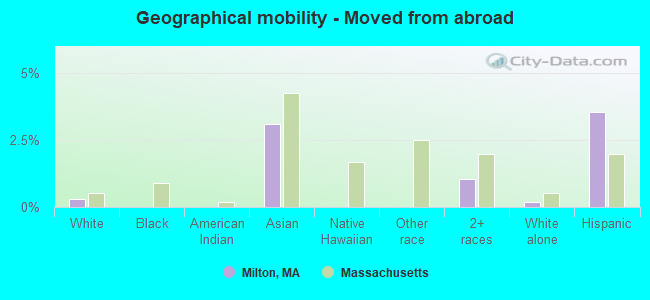
Geographical mobility in Milton Same house 1 year ago 17,411 91.7% White (Caucasian)4,392 94.8% Black or African American71 100.0% American Indian / Alaska Native1,599 92.9% Asian21 100.0% Native Hawaiian / Pacific Islander317 94.3% Other race2,093 86.2% Two or more races17,339 91.6% White alone, not Hispanic / Latino1,118 95.5% Hispanic or LatinoMoved within same county 555 2.9% White / Caucasian75 1.6% Black or African American34 1.4% Two or more races563 3.0% White alone, not Hispanic / LatinoMoved within same state 544 2.9% White / Caucasian126 2.7% Black or African American62 3.6% Asian18 5.3% Other race149 6.1% Two or more races551 2.9% White alone, not Hispanic / Latino14 1.2% Hispanic or LatinoMoved from different state 397 2.1% White / Caucasian67 1.5% Black or African American8 0.4% Asian90 3.7% Two or more races402 2.1% White alone, not Hispanic / Latino5 0.4% Hispanic or LatinoMoved from abroad 55 0.3% White53 3.1% Asian26 1.1% Two or more races38 0.2% White alone, not Hispanic / Latino41 3.5% Hispanic or Latino
Children Nativity (place of birth) in Milton
Children under 6 years - Living with two parents Both parents native 1,331 100.0% NativeBoth parents foreign-born 55 100.0% NativeOne native, one foreign-born parent 104 100.0% NativeChildren under 6 years - Living with one parent Native parent 85 100.0% NativeForeign-born parent 61 100.0% NativeChildren 6 to 17 years - Living with two parents Both parents native 3,224 98.4% Native52 1.6% Foreign-bornBoth parents foreign-born 436 90.9% Native44 9.1% Foreign-bornOne native, one foreign-born parent 490 100.0% NativeChildren 6 to 17 years - Living with one parent Native parent 638 100.0% NativeForeign-born parent 231 59.9% Native154 40.1% Foreign-born
Grandparents responsible for own grandchildren in Milton
Grandparents (30 to 59 years) Asian 15 100.0% Not responsible for grandchildren
Grandparents (60 years and over) Asian 11 100.0% Not responsible for grandchildren