Races in Millwood, South Carolina (SC) Detailed Stats
Ancestries, Foreign-born residents, place of birth

Recent posts about races in Millwood, South Carolina on our local forum with over 2,400,000 registered users:
 | New metro area development/construction (790 replies) |
| Garners Ferry Construction (123 replies) |
| Columbia - general (5183 replies) |
| Columbia needs to go "all in" with the Vista... (113 replies) |
| South Carolina's Hippest Neighborhoods (44 replies) |
| Area near providence hospital (10 replies) |
1.0% of Millwood, SC residents are foreign-born , which is 391.7% less than the foreign-born rate of 5.0% across the entire state of South Carolina.
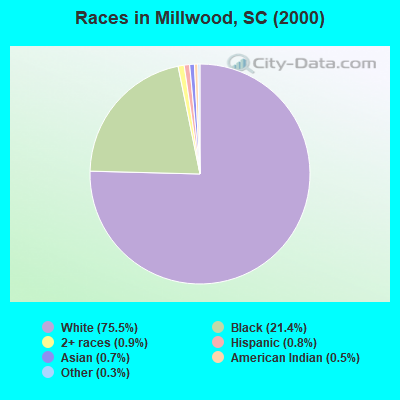
Race distribution in Millwood

- 66875.5%White alone
- 18921.4%Black alone
- 80.9%Two or more races
- 70.8%Hispanic
- 60.7%Asian alone
- 40.5%American Indian alone
- 30.3%Other race alone
2000
2022
-
- 2,652,29166.1%White alone
- 1,178,48629.4%Black alone
- 95,0762.4%Hispanic
- 35,5680.9%Asian alone
- 33,2900.8%Two or more races
- 12,7650.3%American Indian alone
- 3,2660.08%Other race alone
- 1,2700.03%Native Hawaiian and Other
Pacific Islander alone

-
- 3,301,73962.5%White alone
- 1,313,29024.9%Black alone
- 343,7836.5%Hispanic
- 190,5083.6%Two or more races
- 89,8881.7%Asian alone
- 29,3900.6%Other race alone
- 12,1120.2%American Indian alone
- 1,9240.04%Native Hawaiian and Other
Pacific Islander alone

Income and house value in Millwood
- Median household income in 2022
- $80,136White non-Hispanic householders
- $134,449Black householders
- $67,287Two or more races householders
- $15,915Hispanic or Latino race householders
- Median 2022 house value
- $194,761White Non-Hispanic householders
- $207,826Black or African American householders
- $133,067Two or more races householders
Household income for White non-Hispanic householders

Household income for Black householders

Household income for Two or more races householders

Household income for Hispanic or Latino race householders

Foreign-born residents in Millwood
9 residents are foreign born
| This city: | 1.0% |
| South Carolina: | 2.9% |
Ancestries in Millwood

- 29431.1%United States
- 18819.9%Other
- 11211.8%English
- 10411.0%German
- 808.5%Italian
- 707.4%Subsaharan African
- 272.9%Irish
- 212.2%Polish
- 161.7%Scottish
- 121.3%Scotch-Irish
- 80.8%Swedish
- 70.7%Danish
- 70.7%Norwegian

Zip codes: 29154.