Races in Miller Place, New York (NY) Detailed Stats
Data:
Races - White alone (%)
Races - White alone (% change since 2000)
Races - Black alone (%)
Races - Black alone (% change since 2000)
Races - American Indian alone (%)
Races - American Indian alone (% change since 2000)
Races - Asian alone (%)
Races - Asian alone (% change since 2000)
Races - Hispanic (%)
Races - Hispanic (% change since 2000)
Races - Native Hawaiian and Other Pacific Islander alone (%)
Races - Native Hawaiian and Other Pacific Islander alone (% change since 2000)
Races - Two or more races(%)
Races - Two or more races(% change since 2000)
Races - Other race alone (%)
Races - Other race alone (% change since 2000)
Racial diversity
Place of birth - Born in state of residence (%)
Place of birth - Born in state of residence (%) - White
Place of birth - Born in state of residence (%) - Black or African American
Place of birth - Born in state of residence (%) - Asian
Place of birth - Born in state of residence (%) - Hispanic or Latino
Place of birth - Born in state of residence (%) - American Indian and Alaska Native
Place of birth - Born in state of residence (%) - Multirace
Place of birth - Born in state of residence (%) - Other Race
Place of birth - Born in other state (%)
Place of birth - Born in other state (%) - White
Place of birth - Born in other state (%) - Black or African American
Place of birth - Born in other state (%) - Asian
Place of birth - Born in other state (%) - Hispanic or Latino
Place of birth - Born in other state (%) - American Indian and Alaska Native
Place of birth - Born in other state (%) - Multirace
Place of birth - Born in other state (%) - Other Race
Place of birth - Native, outside of US (%)
Place of birth - Native, outside of US (%) - White
Place of birth - Native, outside of US (%) - Black or African American
Place of birth - Native, outside of US (%) - Asian
Place of birth - Native, outside of US (%) - Hispanic or Latino
Place of birth - Native, outside of US (%) - American Indian and Alaska Native
Place of birth - Native, outside of US (%) - Multirace
Place of birth - Native, outside of US (%) - Other Race
Place of birth - Foreign born (%)
Place of birth - Foreign born (%) - White
Place of birth - Foreign born (%) - Black or African American
Place of birth - Foreign born (%) - Asian
Place of birth - Foreign born (%) - Hispanic or Latino
Place of birth - Foreign born (%) - American Indian and Alaska Native
Place of birth - Foreign born (%) - Multirace
Place of birth - Foreign born (%) - Other Race
Residents speaking English at home (%)
Residents speaking English at home - Born in the United States (%)
Residents speaking English at home - Native, born elsewhere (%)
Residents speaking English at home - Foreign born (%)
Residents speaking Spanish at home (%)
Residents speaking Spanish at home - Born in the United States (%)
Residents speaking Spanish at home - Native, born elsewhere (%)
Residents speaking Spanish at home - Foreign born (%)
Residents speaking other language at home (%)
Residents speaking other language at home - Born in the United States (%)
Residents speaking other language at home - Native, born elsewhere (%)
Residents speaking other language at home - Foreign born (%)
Marital status - Never married (%)
Marital status - Now married (%)
Marital status - Separated (%)
Marital status - Widowed (%)
Marital status - Divorced (%)
Ancestries Reported - Arab (%)
Ancestries Reported - Czech (%)
Ancestries Reported - Danish (%)
Ancestries Reported - Dutch (%)
Ancestries Reported - English (%)
Ancestries Reported - French (%)
Ancestries Reported - French Canadian (%)
Ancestries Reported - German (%)
Ancestries Reported - Greek (%)
Ancestries Reported - Hungarian (%)
Ancestries Reported - Irish (%)
Ancestries Reported - Italian (%)
Ancestries Reported - Lithuanian (%)
Ancestries Reported - Norwegian (%)
Ancestries Reported - Polish (%)
Ancestries Reported - Portuguese (%)
Ancestries Reported - Russian (%)
Ancestries Reported - Scotch-Irish (%)
Ancestries Reported - Scottish (%)
Ancestries Reported - Slovak (%)
Ancestries Reported - Subsaharan African (%)
Ancestries Reported - Swedish (%)
Ancestries Reported - Swiss (%)
Ancestries Reported - Ukrainian (%)
Ancestries Reported - United States (%)
Ancestries Reported - Welsh (%)
Ancestries Reported - West Indian (%)
Ancestries Reported - Other (%)
Geographical mobility - Same house 1 year ago (%)
Geographical mobility - Same house 1 year ago (%) - White
Geographical mobility - Same house 1 year ago (%) - Black or African American
Geographical mobility - Same house 1 year ago (%) - Asian
Geographical mobility - Same house 1 year ago (%) - Hispanic or Latino
Geographical mobility - Same house 1 year ago (%) - American Indian and Alaska Native
Geographical mobility - Same house 1 year ago (%) - Multirace
Geographical mobility - Same house 1 year ago (%) - Other Race
Geographical mobility - Moved within same county (%)
Geographical mobility - Moved within same county (%) - White
Geographical mobility - Moved within same county (%) - Black or African American
Geographical mobility - Moved within same county (%) - Asian
Geographical mobility - Moved within same county (%) - Hispanic or Latino
Geographical mobility - Moved within same county (%) - American Indian and Alaska Native
Geographical mobility - Moved within same county (%) - Multirace
Geographical mobility - Moved within same county (%) - Other Race
Geographical mobility - Moved from different county within same state (%)
Geographical mobility - Moved from different county within same state (%) - White
Geographical mobility - Moved from different county within same state (%) - Black or African American
Geographical mobility - Moved from different county within same state (%) - Asian
Geographical mobility - Moved from different county within same state (%) - Hispanic or Latino
Geographical mobility - Moved from different county within same state (%) - American Indian and Alaska Native
Geographical mobility - Moved from different county within same state (%) - Multirace
Geographical mobility - Moved from different county within same state (%) - Other Race
Geographical mobility - Moved from different state (%)
Geographical mobility - Moved from different state (%) - White
Geographical mobility - Moved from different state (%) - Black or African American
Geographical mobility - Moved from different state (%) - Asian
Geographical mobility - Moved from different state (%) - Hispanic or Latino
Geographical mobility - Moved from different state (%) - American Indian and Alaska Native
Geographical mobility - Moved from different state (%) - Multirace
Geographical mobility - Moved from different state (%) - Other Race
Geographical mobility - Moved from abroad (%)
Geographical mobility - Moved from abroad (%) - White
Geographical mobility - Moved from abroad (%) - Black or African American
Geographical mobility - Moved from abroad (%) - Asian
Geographical mobility - Moved from abroad (%) - Hispanic or Latino
Geographical mobility - Moved from abroad (%) - American Indian and Alaska Native
Geographical mobility - Moved from abroad (%) - Multirace
Geographical mobility - Moved from abroad (%) - Other Race
Place of birth for the foreign-born population - Ireland (%)
Place of birth for the foreign-born population - Denmark (%)
Place of birth for the foreign-born population - Norway (%)
Place of birth for the foreign-born population - Sweden (%)
Place of birth for the foreign-born population - United Kingdom (%)
Place of birth for the foreign-born population - England (%)
Place of birth for the foreign-born population - Scotland (%)
Place of birth for the foreign-born population - Other Northern Europe (%)
Place of birth for the foreign-born population - Austria (%)
Place of birth for the foreign-born population - Belgium (%)
Place of birth for the foreign-born population - France (%)
Place of birth for the foreign-born population - Germany (%)
Place of birth for the foreign-born population - Netherlands (%)
Place of birth for the foreign-born population - Switzerland (%)
Place of birth for the foreign-born population - Other Western Europe (%)
Place of birth for the foreign-born population - Greece (%)
Place of birth for the foreign-born population - Italy (%)
Place of birth for the foreign-born population - Portugal (%)
Place of birth for the foreign-born population - Spain (%)
Place of birth for the foreign-born population - Other Southern Europe (%)
Place of birth for the foreign-born population - Albania (%)
Place of birth for the foreign-born population - Belarus (%)
Place of birth for the foreign-born population - Bosnia and Herzegovina (%)
Place of birth for the foreign-born population - Bulgaria (%)
Place of birth for the foreign-born population - Croatia (%)
Place of birth for the foreign-born population - Czechoslovakia (%)
Place of birth for the foreign-born population - Hungary (%)
Place of birth for the foreign-born population - Latvia (%)
Place of birth for the foreign-born population - Lithuania (%)
Place of birth for the foreign-born population - North Macedonia (Macedonia) (%)
Place of birth for the foreign-born population - Moldova (%)
Place of birth for the foreign-born population - Poland (%)
Place of birth for the foreign-born population - Romania (%)
Place of birth for the foreign-born population - Russia (%)
Place of birth for the foreign-born population - Serbia (%)
Place of birth for the foreign-born population - Ukraine (%)
Place of birth for the foreign-born population - Other Eastern Europe (%)
Place of birth for the foreign-born population - China (%)
Place of birth for the foreign-born population - Hong Kong (%)
Place of birth for the foreign-born population - Taiwan (%)
Place of birth for the foreign-born population - Japan (%)
Place of birth for the foreign-born population - Korea (%)
Place of birth for the foreign-born population - Other Eastern Asia (%)
Place of birth for the foreign-born population - Afghanistan (%)
Place of birth for the foreign-born population - Bangladesh (%)
Place of birth for the foreign-born population - India (%)
Place of birth for the foreign-born population - Iran (%)
Place of birth for the foreign-born population - Kazakhstan (%)
Place of birth for the foreign-born population - Nepal (%)
Place of birth for the foreign-born population - Pakistan (%)
Place of birth for the foreign-born population - Sri Lanka (%)
Place of birth for the foreign-born population - Uzbekistan (%)
Place of birth for the foreign-born population - Other South Central Asia (%)
Place of birth for the foreign-born population - Burma (%)
Place of birth for the foreign-born population - Cambodia (%)
Place of birth for the foreign-born population - Indonesia (%)
Place of birth for the foreign-born population - Laos (%)
Place of birth for the foreign-born population - Malaysia (%)
Place of birth for the foreign-born population - Philippines (%)
Place of birth for the foreign-born population - Singapore (%)
Place of birth for the foreign-born population - Thailand (%)
Place of birth for the foreign-born population - Vietnam (%)
Place of birth for the foreign-born population - Other South Eastern Asia (%)
Place of birth for the foreign-born population - Armenia (%)
Place of birth for the foreign-born population - Iraq (%)
Place of birth for the foreign-born population - Israel (%)
Place of birth for the foreign-born population - Jordan (%)
Place of birth for the foreign-born population - Kuwait (%)
Place of birth for the foreign-born population - Lebanon (%)
Place of birth for the foreign-born population - Saudi Arabia (%)
Place of birth for the foreign-born population - Syria (%)
Place of birth for the foreign-born population - Turkey (%)
Place of birth for the foreign-born population - Yemen (%)
Place of birth for the foreign-born population - Other Western Asia (%)
Place of birth for the foreign-born population - Eritrea (%)
Place of birth for the foreign-born population - Ethiopia (%)
Place of birth for the foreign-born population - Kenya (%)
Place of birth for the foreign-born population - Somalia (%)
Place of birth for the foreign-born population - Uganda (%)
Place of birth for the foreign-born population - Zimbabwe (%)
Place of birth for the foreign-born population - Other Eastern Africa (%)
Place of birth for the foreign-born population - Cameroon (%)
Place of birth for the foreign-born population - Congo (%)
Place of birth for the foreign-born population - Democratic Republic of Congo (Zaire) (%)
Place of birth for the foreign-born population - Other Middle Africa (%)
Place of birth for the foreign-born population - Egypt (%)
Place of birth for the foreign-born population - Morocco (%)
Place of birth for the foreign-born population - Sudan (%)
Place of birth for the foreign-born population - Other Northern Africa (%)
Place of birth for the foreign-born population - South Africa (%)
Place of birth for the foreign-born population - Other Southern Africa (%)
Place of birth for the foreign-born population - Cabo Verde (%)
Place of birth for the foreign-born population - Ghana (%)
Place of birth for the foreign-born population - Liberia (%)
Place of birth for the foreign-born population - Nigeria (%)
Place of birth for the foreign-born population - Senegal (%)
Place of birth for the foreign-born population - Sierra Leone (%)
Place of birth for the foreign-born population - Other Western Africa (%)
Place of birth for the foreign-born population - Australia (%)
Place of birth for the foreign-born population - New Zealand (%)
Place of birth for the foreign-born population - Fiji (%)
Place of birth for the foreign-born population - Micronesia (%)
Place of birth for the foreign-born population - Bahamas (%)
Place of birth for the foreign-born population - Barbados (%)
Place of birth for the foreign-born population - Cuba (%)
Place of birth for the foreign-born population - Dominica (%)
Place of birth for the foreign-born population - Dominican Republic (%)
Place of birth for the foreign-born population - Grenada (%)
Place of birth for the foreign-born population - Haiti (%)
Place of birth for the foreign-born population - Jamaica (%)
Place of birth for the foreign-born population - St. Vincent and the Grenadines (%)
Place of birth for the foreign-born population - Trinidad and Tobago (%)
Place of birth for the foreign-born population - West Indies (%)
Place of birth for the foreign-born population - Other Caribbean (%)
Place of birth for the foreign-born population - Belize (%)
Place of birth for the foreign-born population - Costa Rica (%)
Place of birth for the foreign-born population - El Salvador (%)
Place of birth for the foreign-born population - Guatemala (%)
Place of birth for the foreign-born population - Honduras (%)
Place of birth for the foreign-born population - Mexico (%)
Place of birth for the foreign-born population - Nicaragua (%)
Place of birth for the foreign-born population - Panama (%)
Place of birth for the foreign-born population - Other Central America (%)
Place of birth for the foreign-born population - Argentina (%)
Place of birth for the foreign-born population - Bolivia (%)
Place of birth for the foreign-born population - Brazil (%)
Place of birth for the foreign-born population - Chile (%)
Place of birth for the foreign-born population - Colombia (%)
Place of birth for the foreign-born population - Ecuador (%)
Place of birth for the foreign-born population - Guyana (%)
Place of birth for the foreign-born population - Peru (%)
Place of birth for the foreign-born population - Uruguay (%)
Place of birth for the foreign-born population - Venezuela (%)
Place of birth for the foreign-born population - Other South America (%)
Place of birth for the foreign-born population - Canada (%)
Place of birth for the foreign-born population - Other Northern America (%)
Place of birth for the foreign-born population - Other (%)
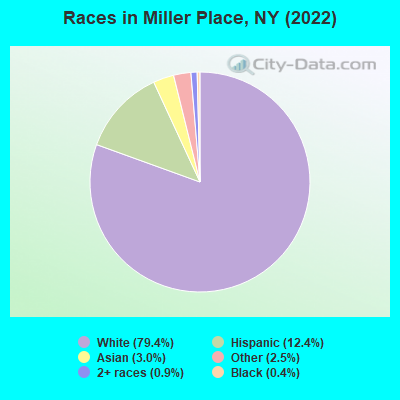
According to 2022 data, the most numerous races in Miller Place, NY are White alone (9,415 residents), Hispanic (1,466 residents), and Black alone (43 residents). 84.7% of Miller Place residents speak English at home. 6.3% of Miller Place, NY residents are foreign-born (2.3% born in Asia, 1.8% born in Latin America, 1.7% born in Europe), which is 247.3% less than the foreign-born rate of 22.0% across the entire state of New York.
Race distribution in Miller Place
2000 2022
11,760,981 62.0% White alone 2,867,583 15.1% Hispanic 2,812,623 14.8% Black alone 1,035,926 5.5% Asian alone 366,116 1.9% Two or more races 75,499 0.4% Other race alone 52,499 0.3% American Indian alone 5,230 0.03% Native Hawaiian and Other
10,408,933 52.9% White alone 3,867,299 19.7% Hispanic 2,633,840 13.4% Black alone 1,776,286 9.0% Asian alone 732,670 3.7% Two or more races 216,110 1.1% Other race alone 35,082 0.2% American Indian alone 6,931 0.04% Native Hawaiian and Other
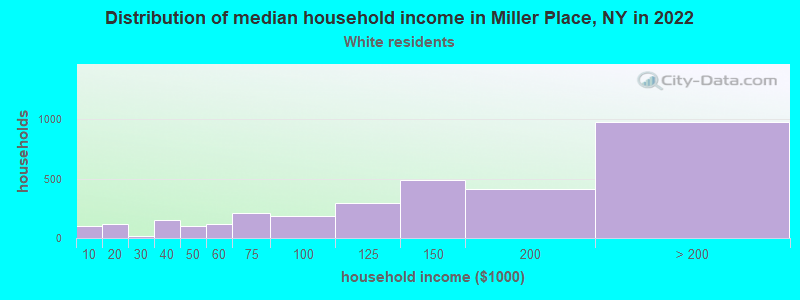
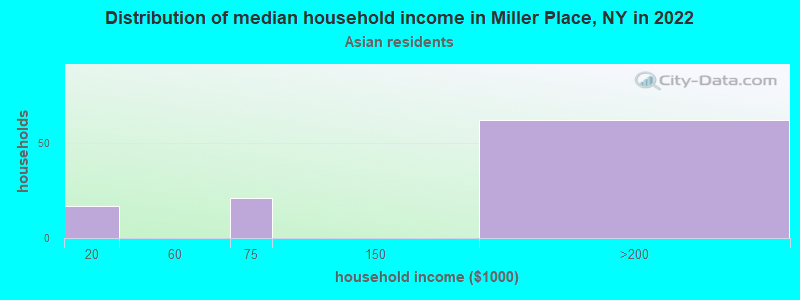
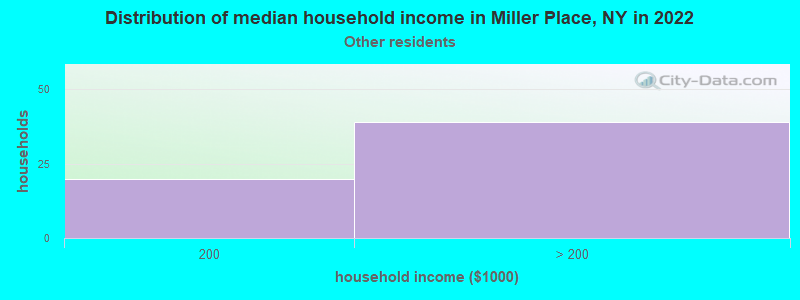
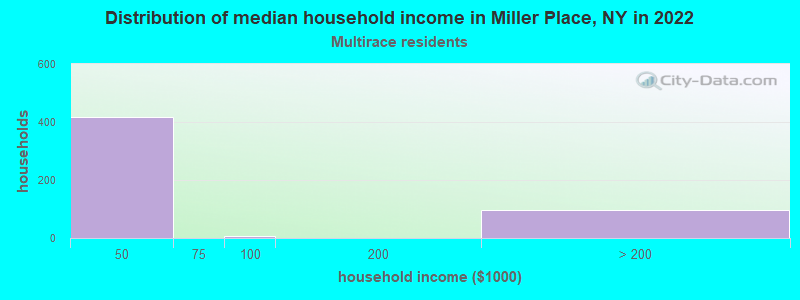
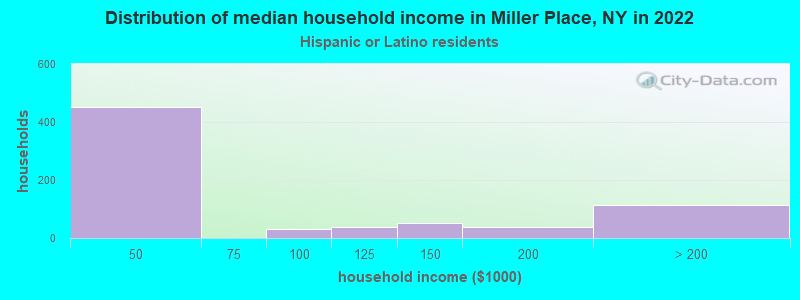
Income and house value in Miller Place Median household income in 2022 $134,104 White non-Hispanic householders$175,469 Asian householders$45,946 Two or more races householdersMedian 2022 house value $601,820 White Non-Hispanic householders$494,417 Black or African American householders$418,353 American Indian or Alaska Native householders $812,366 Asian householders$494,417 Two or more races householders$684,578 Hispanic or Latino householders
Median age by race in Miller Place
45.4 Median age for White residents45.7 44.7 34.1 Median age for Black or African American residents34.0 -661,403,508.1 -748,832,865.7 Median age for American Indian / Alaska Native residents-807,017,543.1 -513,692,161.9 36.9 Median age for Asian residents17.6 39.7 -742,816,091.2 Median age for Native Hawaiian / Pacific Islander residents-831,187,409.8 -771,300,447.7 24.7 Median age for Other race residents24.4 19.2 38.9 Median age for Two or more races residents22.1 73.8 44.6 Median age for White alone residents45.0 43.4 38.2 Median age for Hispanic or Latino residents28.2 54.9
Owner/renter occupied households by race in Miller Place
House owners and renters - White residents 2,821 88.6% Owner occupied365 11.4% Renter occupiedHouse owners and renters - Black or African American residents 27 100.0% Owner occupiedHouse owners and renters - Asian residents 90 100.0% Owner occupiedHouse owners and renters - Other race residents 58 100.0% Owner occupiedHouse owners and renters - Two or more races residents 107 16.7% Owner occupied533 83.3% Renter occupiedHouse owners and renters - White alone residents 2,770 88.1% Owner occupied374 11.9% Renter occupiedHouse owners and renters - Hispanic or Latino residents 255 38.9% Owner occupied400 61.1% Renter occupied
Language usage in Miller Place
English speakers - Total 84.7% of residents of Miller Place speak English at home.
7.2% of residents speak Spanish at home 714 86.4% Speak English very well112 13.6% Speak English less than very well7.1% of residents speak other language at home 630 77.4% Speak English very well184 22.6% Speak English less than very well
English speakers - Born in the United States 88.2% of residents of Miller Place speak English at home.
2.6% of residents speak Spanish at home 20 100.0% Speak English very well10.7% of residents speak other language at home 58 70.7% Speak English very well24 29.3% Speak English less than very well
English speakers - Native, born elsewhere 18.4% of residents of Miller Place speak English at home.
55.7% of residents speak Spanish at home 97 100.0% Speak English very well32.8% of residents speak other language at home 57 100.0% Speak English very well
English speakers - Foreign-born 35.3% of residents of Miller Place speak English at home.
21.3% of residents speak Spanish at home 58 33.3% Speak English very well116 66.7% Speak English less than very well40.6% of residents speak other language at home 162 48.9% Speak English very well169 51.1% Speak English less than very well
White (Caucasian) - Speak only English Native:
96.2% (8,613)Foreign-born:
48.5% (143)
White (Caucasian) - Speak another language Native:
4.1% (370)Foreign-born:
57.3% (169)
Black or African American - Speak only English Native:
97.0% (73)Foreign-born:
100.0% (10)
Asian - Speak only English Native:
81.8% (152)Foreign-born:
39.2% (65)
Asian - Speak another language Native:
11.6% (22)Foreign-born:
41.9% (70)
Other race - Speak another language Native:
21.0% (83)Foreign-born:
100.0% (18)
Two or more races - Speak only English Native:
23.3% (206)Foreign-born:
8.3% (17)
Two or more races - Speak another language Native:
75.1% (664)Foreign-born:
92.2% (190)
White alone - Speak only English Native:
95.2% (8,411)Foreign-born:
40.6% (156)
White alone - Speak another language Native:
4.9% (429)Foreign-born:
59.5% (228)
Hispanic or Latino - Speak only English Native:
45.5% (535)Foreign-born:
7.0% (13)
Hispanic or Latino - Speak another language Native:
54.3% (638)Foreign-born:
93.0% (176)
Foreign-born residents in Miller Place 751 residents are foreign born (2.3% Asia , 1.8% Latin America , 1.7% Europe ).
This city:
6.3%New York:
22.6%
Marital status for residents in Miller Place Marital status - White (Caucasian) population 15 years and over
Males 29.6% Never married64.0% Now married1.1% Separated1.0% Widowed4.3% DivorcedFemales 30.9% Never married58.1% Now married0.1% Separated5.6% Widowed5.3% DivorcedWomen who gave birth in the past 12 months Now married:
100.0% (101)Unmarried:
0.0% (0)
Women who did not give birth in the past 12 months Now married:
33.7% (595)Unmarried:
66.3% (1,172)
Marital status - Black or African American population 15 years and over
Males 30.8% Never married0.0% Now married34.6% Separated0.0% Widowed34.6% DivorcedFemales 100.0% Never married0.0% Now married0.0% Separated0.0% Widowed0.0% DivorcedMarital status - Asian population 15 years and over
Males 38.6% Never married47.7% Now married0.0% Separated13.6% Widowed0.0% DivorcedFemales 27.4% Never married65.6% Now married0.0% Separated6.4% Widowed0.6% DivorcedWomen who did not give birth in the past 12 months Now married:
30.3% (24)Unmarried:
69.7% (55)
Marital status - Other race population 15 years and over
Males 100.0% Never married0.0% Now married0.0% Separated0.0% Widowed0.0% DivorcedFemales 65.3% Never married26.6% Now married0.0% Separated0.0% Widowed8.1% DivorcedWomen who did not give birth in the past 12 months Now married:
0.0% (0)Unmarried:
100.0% (155)
Marital status - Two or more races population 15 years and over
Males 48.0% Never married26.4% Now married0.0% Separated0.0% Widowed25.7% DivorcedFemales 13.7% Never married20.6% Now married0.0% Separated0.0% Widowed65.7% DivorcedWomen who did not give birth in the past 12 months Now married:
53.2% (120)Unmarried:
46.8% (105)
Marital status - White alone, not Hispanic / Latino population 15 years and over
Males 30.0% Never married63.4% Now married1.2% Separated1.0% Widowed4.5% DivorcedFemales 32.0% Never married57.6% Now married0.1% Separated5.6% Widowed4.7% DivorcedWomen who gave birth in the past 12 months Now married:
100.0% (110)Unmarried:
0.0% (0)
Women who did not give birth in the past 12 months Now married:
30.4% (555)Unmarried:
69.6% (1,270)
Marital status - Hispanic or Latino population 15 years and over
Males 35.5% Never married53.0% Now married0.0% Separated0.0% Widowed11.5% DivorcedFemales 12.6% Never married34.1% Now married0.0% Separated1.0% Widowed52.3% DivorcedWomen who did not give birth in the past 12 months Now married:
64.9% (162)Unmarried:
35.1% (88)
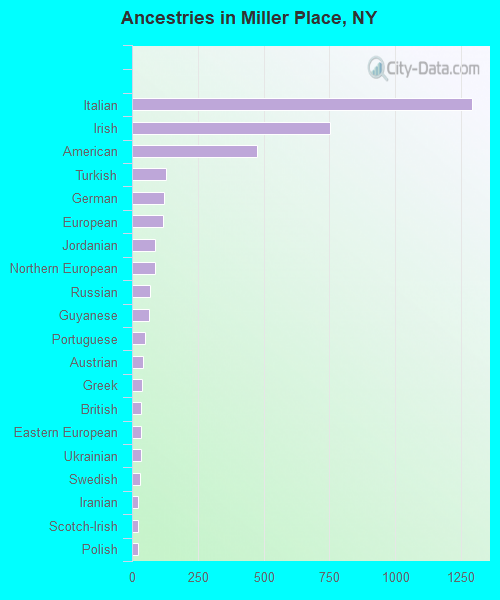
Ancestries in Miller Place
1,292 28.3% Italian753 16.5% Irish474 10.4% American131 2.9% Turkish122 2.7% German119 2.6% European88 1.9% Jordanian87 1.9% Northern European68 1.5% Russian65 1.4% Guyanese48 1.1% Portuguese43 0.9% Austrian37 0.8% Greek36 0.8% British36 0.8% Eastern European34 0.7% Ukrainian31 0.7% Swedish24 0.5% Iranian23 0.5% Scotch-Irish21 0.5% Polish11 0.2% Lebanese10 0.2% Haitian7 0.2% Romanian6 0.1% Lithuanian
Children Nativity (place of birth) in Miller Place
Children under 6 years - Living with two parents Both parents native 249 100.0% NativeBoth parents foreign-born 51 100.0% NativeOne native, one foreign-born parent 82 100.0% NativeChildren under 6 years - Living with one parent Native parent 42 100.0% NativeChildren 6 to 17 years - Living with two parents Both parents native 1,492 100.0% Native0 0.0% Foreign-bornBoth parents foreign-born 193 95.8% Native9 4.2% Foreign-bornOne native, one foreign-born parent 68 100.0% NativeChildren 6 to 17 years - Living with one parent Native parent 229 100.0% NativeForeign-born parent 40 51.5% Native38 48.5% Foreign-born
Grandparents responsible for own grandchildren in Miller Place
Grandparents (30 to 59 years) White / Caucasian 24 78.2% Responsible for grandchildren7 21.8% Not responsible for grandchildrenTwo or more races 32 100.0% Not responsible for grandchildrenWhite alone, not Hispanic / Latino 23 75.4% Responsible for grandchildren8 24.6% Not responsible for grandchildrenHispanic or Latino 13 100.0% Not responsible for grandchildrenGrandparents (60 years and over) White / Caucasian 15 9.2% Responsible for grandchildren148 90.8% Not responsible for grandchildrenTwo or more races 27 100.0% Not responsible for grandchildrenWhite alone, not Hispanic / Latino 18 10.1% Responsible for grandchildren161 89.9% Not responsible for grandchildrenHispanic or Latino 19 100.0% Not responsible for grandchildren