Races in Milford, Delaware (DE) Detailed Stats
Data:
Races - White alone (%)
Races - White alone (% change since 2000)
Races - Black alone (%)
Races - Black alone (% change since 2000)
Races - American Indian alone (%)
Races - American Indian alone (% change since 2000)
Races - Asian alone (%)
Races - Asian alone (% change since 2000)
Races - Hispanic (%)
Races - Hispanic (% change since 2000)
Races - Native Hawaiian and Other Pacific Islander alone (%)
Races - Native Hawaiian and Other Pacific Islander alone (% change since 2000)
Races - Two or more races(%)
Races - Two or more races(% change since 2000)
Races - Other race alone (%)
Races - Other race alone (% change since 2000)
Racial diversity
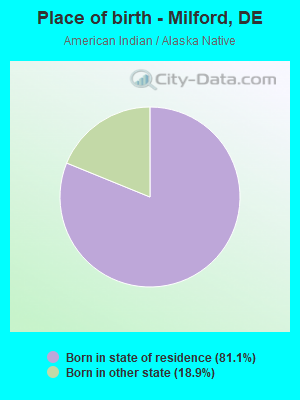
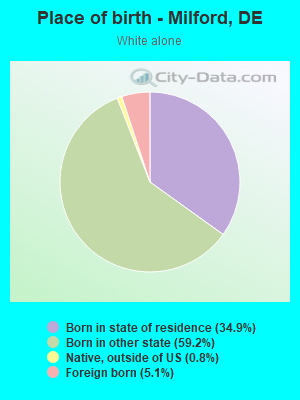
Place of birth - Born in state of residence (%)
Place of birth - Born in state of residence (%) - White
Place of birth - Born in state of residence (%) - Black or African American
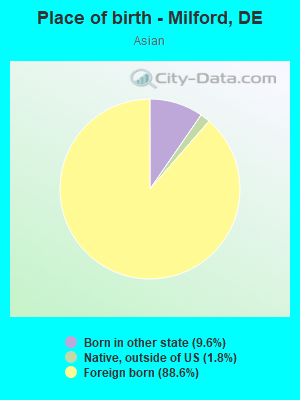
Place of birth - Born in state of residence (%) - Asian
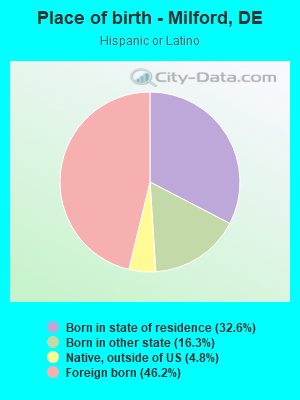
Place of birth - Born in state of residence (%) - Hispanic or Latino
Place of birth - Born in state of residence (%) - American Indian and Alaska Native
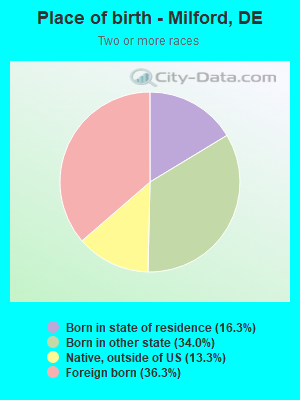
Place of birth - Born in state of residence (%) - Multirace
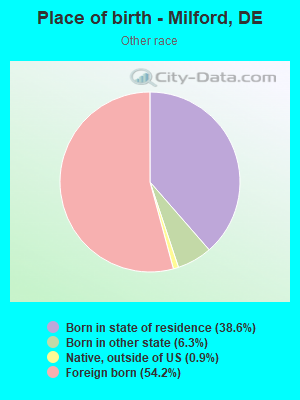
Place of birth - Born in state of residence (%) - Other Race
Place of birth - Born in other state (%)
Place of birth - Born in other state (%) - White
Place of birth - Born in other state (%) - Black or African American
Place of birth - Born in other state (%) - Asian
Place of birth - Born in other state (%) - Hispanic or Latino
Place of birth - Born in other state (%) - American Indian and Alaska Native
Place of birth - Born in other state (%) - Multirace
Place of birth - Born in other state (%) - Other Race
Place of birth - Native, outside of US (%)
Place of birth - Native, outside of US (%) - White
Place of birth - Native, outside of US (%) - Black or African American
Place of birth - Native, outside of US (%) - Asian
Place of birth - Native, outside of US (%) - Hispanic or Latino
Place of birth - Native, outside of US (%) - American Indian and Alaska Native
Place of birth - Native, outside of US (%) - Multirace
Place of birth - Native, outside of US (%) - Other Race
Place of birth - Foreign born (%)
Place of birth - Foreign born (%) - White
Place of birth - Foreign born (%) - Black or African American
Place of birth - Foreign born (%) - Asian
Place of birth - Foreign born (%) - Hispanic or Latino
Place of birth - Foreign born (%) - American Indian and Alaska Native
Place of birth - Foreign born (%) - Multirace
Place of birth - Foreign born (%) - Other Race
Residents speaking English at home (%)
Residents speaking English at home - Born in the United States (%)
Residents speaking English at home - Native, born elsewhere (%)
Residents speaking English at home - Foreign born (%)
Residents speaking Spanish at home (%)
Residents speaking Spanish at home - Born in the United States (%)
Residents speaking Spanish at home - Native, born elsewhere (%)
Residents speaking Spanish at home - Foreign born (%)
Residents speaking other language at home (%)
Residents speaking other language at home - Born in the United States (%)
Residents speaking other language at home - Native, born elsewhere (%)
Residents speaking other language at home - Foreign born (%)
Marital status - Never married (%)
Marital status - Now married (%)
Marital status - Separated (%)
Marital status - Widowed (%)
Marital status - Divorced (%)
Ancestries Reported - Arab (%)
Ancestries Reported - Czech (%)
Ancestries Reported - Danish (%)
Ancestries Reported - Dutch (%)
Ancestries Reported - English (%)
Ancestries Reported - French (%)
Ancestries Reported - French Canadian (%)
Ancestries Reported - German (%)
Ancestries Reported - Greek (%)
Ancestries Reported - Hungarian (%)
Ancestries Reported - Irish (%)
Ancestries Reported - Italian (%)
Ancestries Reported - Lithuanian (%)
Ancestries Reported - Norwegian (%)
Ancestries Reported - Polish (%)
Ancestries Reported - Portuguese (%)
Ancestries Reported - Russian (%)
Ancestries Reported - Scotch-Irish (%)
Ancestries Reported - Scottish (%)
Ancestries Reported - Slovak (%)
Ancestries Reported - Subsaharan African (%)
Ancestries Reported - Swedish (%)
Ancestries Reported - Swiss (%)
Ancestries Reported - Ukrainian (%)
Ancestries Reported - United States (%)
Ancestries Reported - Welsh (%)
Ancestries Reported - West Indian (%)
Ancestries Reported - Other (%)
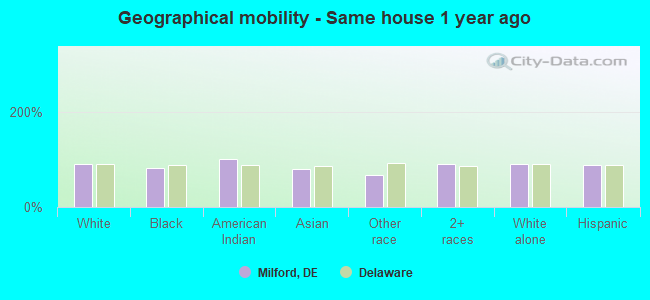
Geographical mobility - Same house 1 year ago (%)
Geographical mobility - Same house 1 year ago (%) - White
Geographical mobility - Same house 1 year ago (%) - Black or African American
Geographical mobility - Same house 1 year ago (%) - Asian
Geographical mobility - Same house 1 year ago (%) - Hispanic or Latino
Geographical mobility - Same house 1 year ago (%) - American Indian and Alaska Native
Geographical mobility - Same house 1 year ago (%) - Multirace
Geographical mobility - Same house 1 year ago (%) - Other Race
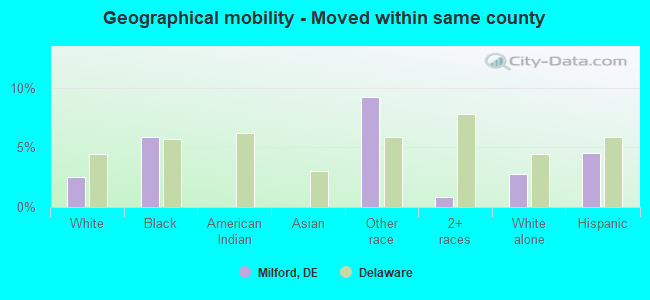
Geographical mobility - Moved within same county (%)
Geographical mobility - Moved within same county (%) - White
Geographical mobility - Moved within same county (%) - Black or African American
Geographical mobility - Moved within same county (%) - Asian
Geographical mobility - Moved within same county (%) - Hispanic or Latino
Geographical mobility - Moved within same county (%) - American Indian and Alaska Native
Geographical mobility - Moved within same county (%) - Multirace
Geographical mobility - Moved within same county (%) - Other Race
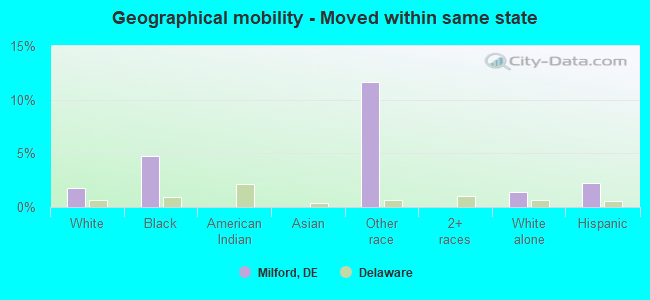
Geographical mobility - Moved from different county within same state (%)
Geographical mobility - Moved from different county within same state (%) - White
Geographical mobility - Moved from different county within same state (%) - Black or African American
Geographical mobility - Moved from different county within same state (%) - Asian
Geographical mobility - Moved from different county within same state (%) - Hispanic or Latino
Geographical mobility - Moved from different county within same state (%) - American Indian and Alaska Native
Geographical mobility - Moved from different county within same state (%) - Multirace
Geographical mobility - Moved from different county within same state (%) - Other Race
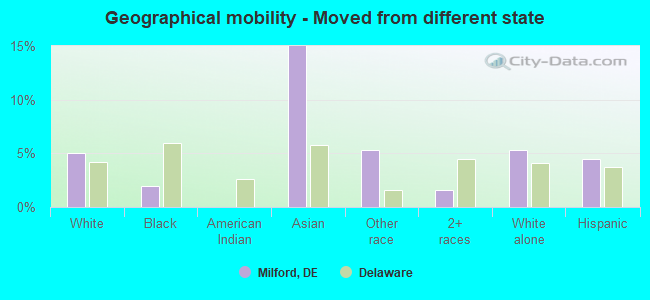
Geographical mobility - Moved from different state (%)
Geographical mobility - Moved from different state (%) - White
Geographical mobility - Moved from different state (%) - Black or African American
Geographical mobility - Moved from different state (%) - Asian
Geographical mobility - Moved from different state (%) - Hispanic or Latino
Geographical mobility - Moved from different state (%) - American Indian and Alaska Native
Geographical mobility - Moved from different state (%) - Multirace
Geographical mobility - Moved from different state (%) - Other Race
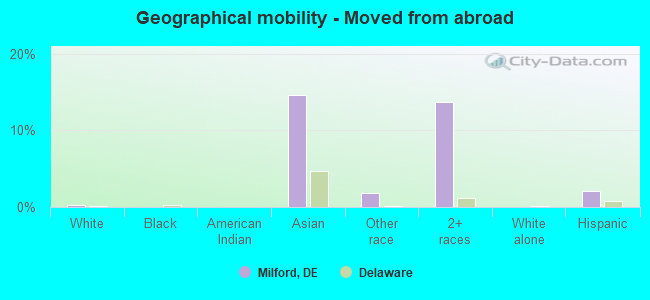
Geographical mobility - Moved from abroad (%)
Geographical mobility - Moved from abroad (%) - White
Geographical mobility - Moved from abroad (%) - Black or African American
Geographical mobility - Moved from abroad (%) - Asian
Geographical mobility - Moved from abroad (%) - Hispanic or Latino
Geographical mobility - Moved from abroad (%) - American Indian and Alaska Native
Geographical mobility - Moved from abroad (%) - Multirace
Geographical mobility - Moved from abroad (%) - Other Race
Place of birth for the foreign-born population - Ireland (%)
Place of birth for the foreign-born population - Denmark (%)
Place of birth for the foreign-born population - Norway (%)
Place of birth for the foreign-born population - Sweden (%)
Place of birth for the foreign-born population - United Kingdom (%)
Place of birth for the foreign-born population - England (%)
Place of birth for the foreign-born population - Scotland (%)
Place of birth for the foreign-born population - Other Northern Europe (%)
Place of birth for the foreign-born population - Austria (%)
Place of birth for the foreign-born population - Belgium (%)
Place of birth for the foreign-born population - France (%)
Place of birth for the foreign-born population - Germany (%)
Place of birth for the foreign-born population - Netherlands (%)
Place of birth for the foreign-born population - Switzerland (%)
Place of birth for the foreign-born population - Other Western Europe (%)
Place of birth for the foreign-born population - Greece (%)
Place of birth for the foreign-born population - Italy (%)
Place of birth for the foreign-born population - Portugal (%)
Place of birth for the foreign-born population - Spain (%)
Place of birth for the foreign-born population - Other Southern Europe (%)
Place of birth for the foreign-born population - Albania (%)
Place of birth for the foreign-born population - Belarus (%)
Place of birth for the foreign-born population - Bosnia and Herzegovina (%)
Place of birth for the foreign-born population - Bulgaria (%)
Place of birth for the foreign-born population - Croatia (%)
Place of birth for the foreign-born population - Czechoslovakia (%)
Place of birth for the foreign-born population - Hungary (%)
Place of birth for the foreign-born population - Latvia (%)
Place of birth for the foreign-born population - Lithuania (%)
Place of birth for the foreign-born population - North Macedonia (Macedonia) (%)
Place of birth for the foreign-born population - Moldova (%)
Place of birth for the foreign-born population - Poland (%)
Place of birth for the foreign-born population - Romania (%)
Place of birth for the foreign-born population - Russia (%)
Place of birth for the foreign-born population - Serbia (%)
Place of birth for the foreign-born population - Ukraine (%)
Place of birth for the foreign-born population - Other Eastern Europe (%)
Place of birth for the foreign-born population - China (%)
Place of birth for the foreign-born population - Hong Kong (%)
Place of birth for the foreign-born population - Taiwan (%)
Place of birth for the foreign-born population - Japan (%)
Place of birth for the foreign-born population - Korea (%)
Place of birth for the foreign-born population - Other Eastern Asia (%)
Place of birth for the foreign-born population - Afghanistan (%)
Place of birth for the foreign-born population - Bangladesh (%)
Place of birth for the foreign-born population - India (%)
Place of birth for the foreign-born population - Iran (%)
Place of birth for the foreign-born population - Kazakhstan (%)
Place of birth for the foreign-born population - Nepal (%)
Place of birth for the foreign-born population - Pakistan (%)
Place of birth for the foreign-born population - Sri Lanka (%)
Place of birth for the foreign-born population - Uzbekistan (%)
Place of birth for the foreign-born population - Other South Central Asia (%)
Place of birth for the foreign-born population - Burma (%)
Place of birth for the foreign-born population - Cambodia (%)
Place of birth for the foreign-born population - Indonesia (%)
Place of birth for the foreign-born population - Laos (%)
Place of birth for the foreign-born population - Malaysia (%)
Place of birth for the foreign-born population - Philippines (%)
Place of birth for the foreign-born population - Singapore (%)
Place of birth for the foreign-born population - Thailand (%)
Place of birth for the foreign-born population - Vietnam (%)
Place of birth for the foreign-born population - Other South Eastern Asia (%)
Place of birth for the foreign-born population - Armenia (%)
Place of birth for the foreign-born population - Iraq (%)
Place of birth for the foreign-born population - Israel (%)
Place of birth for the foreign-born population - Jordan (%)
Place of birth for the foreign-born population - Kuwait (%)
Place of birth for the foreign-born population - Lebanon (%)
Place of birth for the foreign-born population - Saudi Arabia (%)
Place of birth for the foreign-born population - Syria (%)
Place of birth for the foreign-born population - Turkey (%)
Place of birth for the foreign-born population - Yemen (%)
Place of birth for the foreign-born population - Other Western Asia (%)
Place of birth for the foreign-born population - Eritrea (%)
Place of birth for the foreign-born population - Ethiopia (%)
Place of birth for the foreign-born population - Kenya (%)
Place of birth for the foreign-born population - Somalia (%)
Place of birth for the foreign-born population - Uganda (%)
Place of birth for the foreign-born population - Zimbabwe (%)
Place of birth for the foreign-born population - Other Eastern Africa (%)
Place of birth for the foreign-born population - Cameroon (%)
Place of birth for the foreign-born population - Congo (%)
Place of birth for the foreign-born population - Democratic Republic of Congo (Zaire) (%)
Place of birth for the foreign-born population - Other Middle Africa (%)
Place of birth for the foreign-born population - Egypt (%)
Place of birth for the foreign-born population - Morocco (%)
Place of birth for the foreign-born population - Sudan (%)
Place of birth for the foreign-born population - Other Northern Africa (%)
Place of birth for the foreign-born population - South Africa (%)
Place of birth for the foreign-born population - Other Southern Africa (%)
Place of birth for the foreign-born population - Cabo Verde (%)
Place of birth for the foreign-born population - Ghana (%)
Place of birth for the foreign-born population - Liberia (%)
Place of birth for the foreign-born population - Nigeria (%)
Place of birth for the foreign-born population - Senegal (%)
Place of birth for the foreign-born population - Sierra Leone (%)
Place of birth for the foreign-born population - Other Western Africa (%)
Place of birth for the foreign-born population - Australia (%)
Place of birth for the foreign-born population - New Zealand (%)
Place of birth for the foreign-born population - Fiji (%)
Place of birth for the foreign-born population - Micronesia (%)
Place of birth for the foreign-born population - Bahamas (%)
Place of birth for the foreign-born population - Barbados (%)
Place of birth for the foreign-born population - Cuba (%)
Place of birth for the foreign-born population - Dominica (%)
Place of birth for the foreign-born population - Dominican Republic (%)
Place of birth for the foreign-born population - Grenada (%)
Place of birth for the foreign-born population - Haiti (%)
Place of birth for the foreign-born population - Jamaica (%)
Place of birth for the foreign-born population - St. Vincent and the Grenadines (%)
Place of birth for the foreign-born population - Trinidad and Tobago (%)
Place of birth for the foreign-born population - West Indies (%)
Place of birth for the foreign-born population - Other Caribbean (%)
Place of birth for the foreign-born population - Belize (%)
Place of birth for the foreign-born population - Costa Rica (%)
Place of birth for the foreign-born population - El Salvador (%)
Place of birth for the foreign-born population - Guatemala (%)
Place of birth for the foreign-born population - Honduras (%)
Place of birth for the foreign-born population - Mexico (%)
Place of birth for the foreign-born population - Nicaragua (%)
Place of birth for the foreign-born population - Panama (%)
Place of birth for the foreign-born population - Other Central America (%)
Place of birth for the foreign-born population - Argentina (%)
Place of birth for the foreign-born population - Bolivia (%)
Place of birth for the foreign-born population - Brazil (%)
Place of birth for the foreign-born population - Chile (%)
Place of birth for the foreign-born population - Colombia (%)
Place of birth for the foreign-born population - Ecuador (%)
Place of birth for the foreign-born population - Guyana (%)
Place of birth for the foreign-born population - Peru (%)
Place of birth for the foreign-born population - Uruguay (%)
Place of birth for the foreign-born population - Venezuela (%)
Place of birth for the foreign-born population - Other South America (%)
Place of birth for the foreign-born population - Canada (%)
Place of birth for the foreign-born population - Other Northern America (%)
Place of birth for the foreign-born population - Other (%)
Latest news about races in Milford, DE collected exclusively by city-data.com from local newspapers, TV, and radio stations
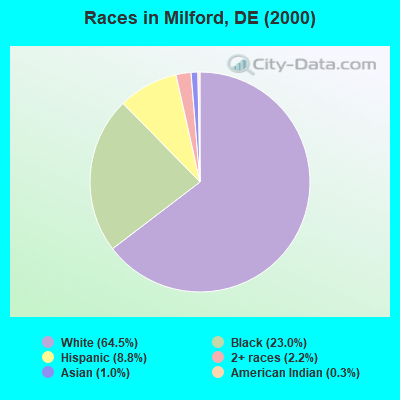
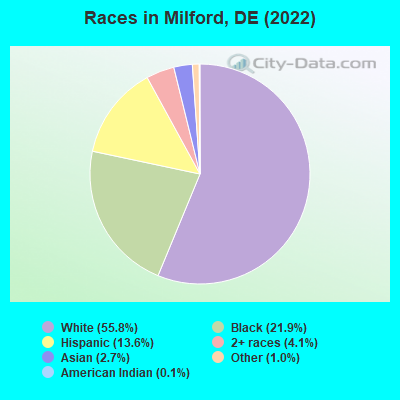
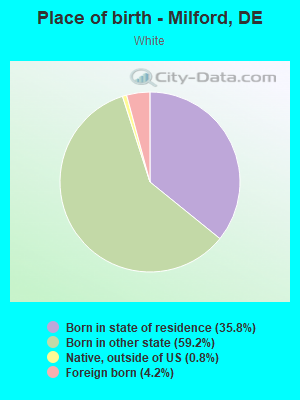
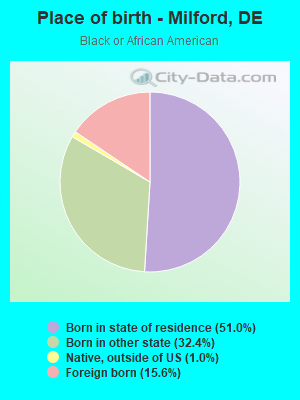
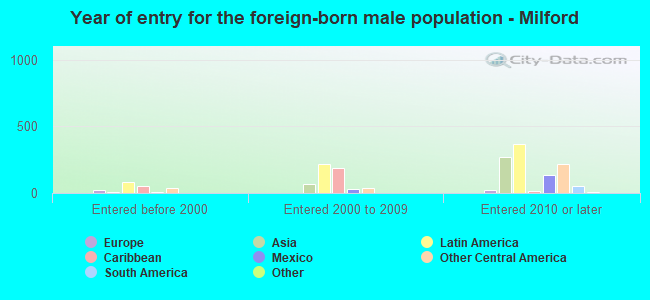
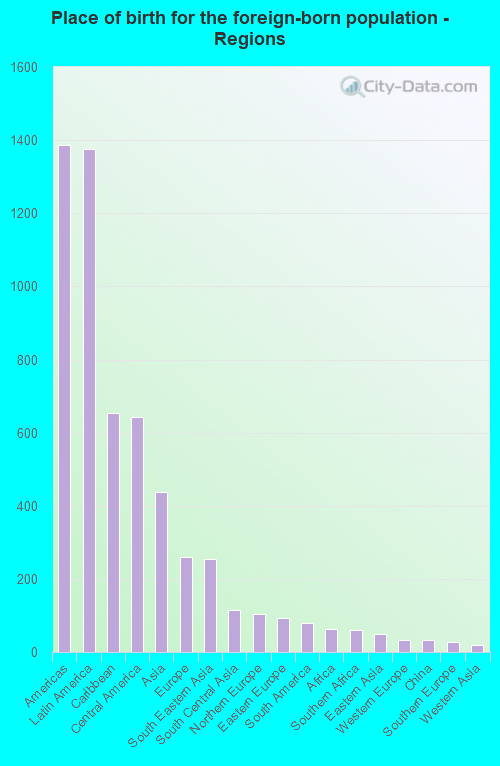
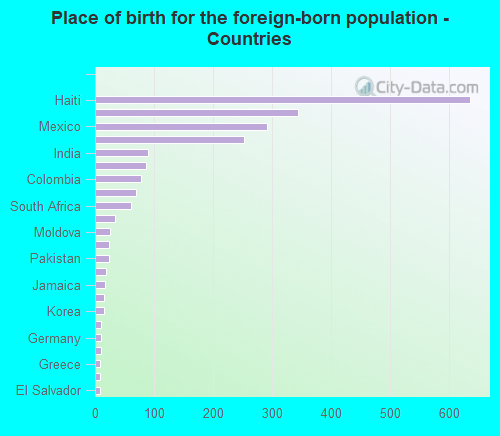
According to 2022 data, the most numerous races in Milford, DE are White alone (6,947 residents), Black alone (2,725 residents), and Hispanic (1,700 residents). 74.6% of Milford residents speak English at home. 17.2% of Milford, DE residents are foreign-born (11.5% born in Latin America, 3.7% born in Asia, 2.2% born in Europe), which is 47.8% greater than the foreign-born rate of 9.0% across the entire state of Delaware.
Race distribution in Milford
2000 2022
567,973 72.5% White alone 148,435 18.9% Black alone 37,277 4.8% Hispanic 16,110 2.1% Asian alone 10,222 1.3% Two or more races 2,324 0.3% American Indian alone 1,025 0.1% Other race alone 234 0.03% Native Hawaiian and Other
599,347 58.9% White alone 220,010 21.6% Black alone 105,300 10.3% Hispanic 46,016 4.5% Two or more races 41,350 4.1% Asian alone 5,097 0.5% Other race alone 1,276 0.1% American Indian alone
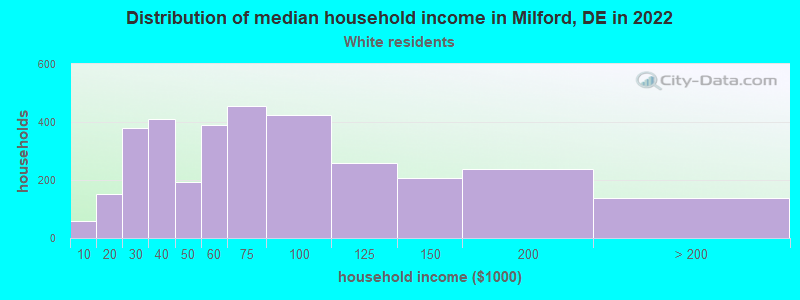
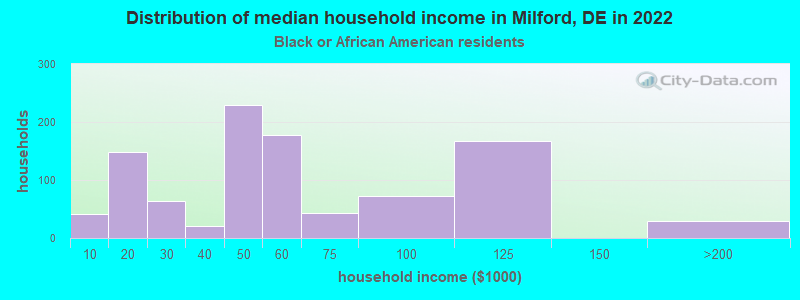
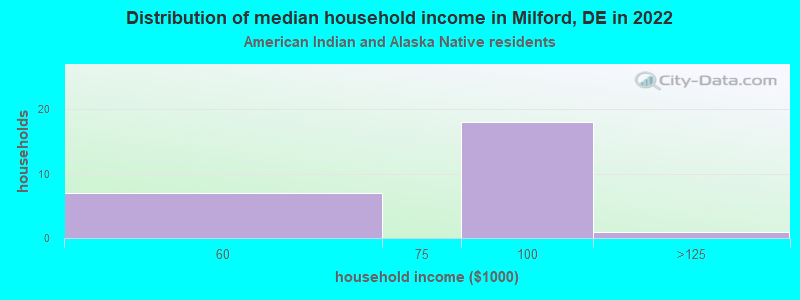
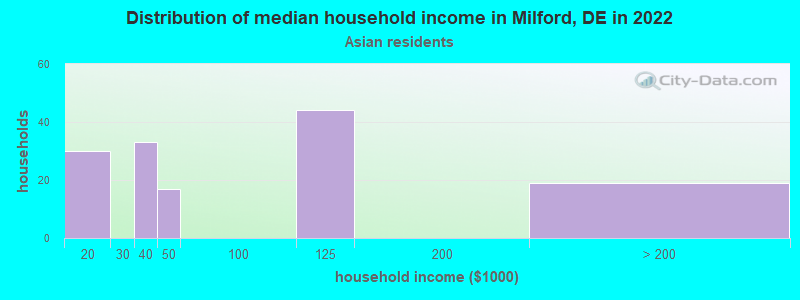
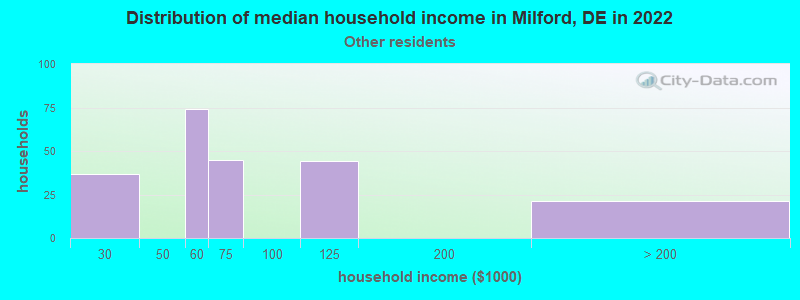
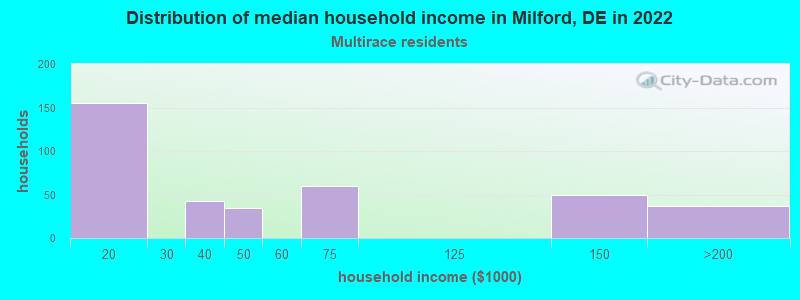
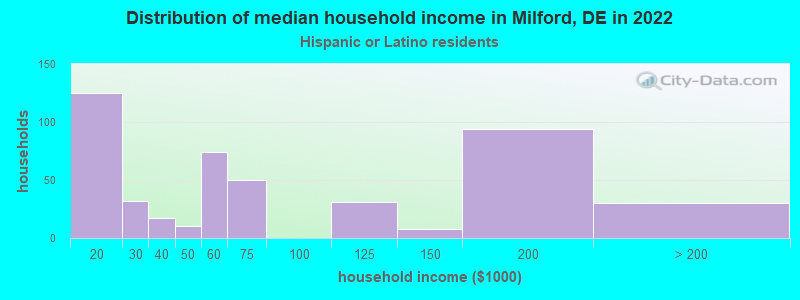
Income and house value in Milford Median household income in 2022 $63,679 White non-Hispanic householders$54,781 Black householders$122,469 American Indian and Alaska Native householders$54,554 Some other race householders$56,577 Hispanic or Latino race householdersMedian 2022 house value $306,973 White Non-Hispanic householders$257,098 Black or African American householders$254,845 American Indian or Alaska Native householders $442,440 Asian householders$273,508 Some other race householders$373,581 Two or more races householders$256,776 Hispanic or Latino householders
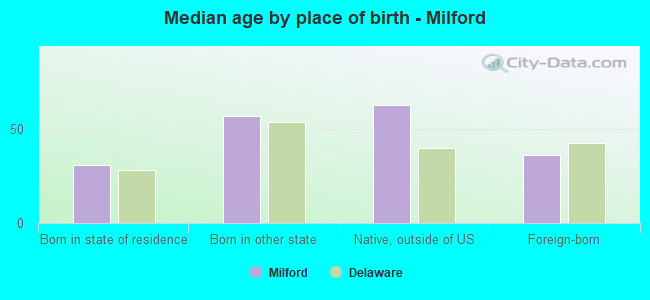
Median age by race in Milford
57.5 Median age for White residents56.7 60.6 35.2 Median age for Black or African American residents35.7 37.0 23.2 Median age for American Indian / Alaska Native residents13.7 -523,255,813.4 71.3 Median age for Asian residents61.8 78.3 -666,666,666.0 Median age for Native Hawaiian / Pacific Islander residents-666,666,666.0 -670,599,802.7 22.1 Median age for Other race residents35.2 6.4 29.1 Median age for Two or more races residents19.5 75.6 58.9 Median age for White alone residents56.2 60.9 28.4 Median age for Hispanic or Latino residents28.6 30.0
Owner/renter occupied households by race in Milford
House owners and renters - White residents 2,162 65.7% Owner occupied1,127 34.3% Renter occupiedHouse owners and renters - Black or African American residents 271 30.5% Owner occupied617 69.5% Renter occupiedHouse owners and renters - American Indian / Alaska Native residents 19 93.8% Owner occupied1 6.2% Renter occupiedHouse owners and renters - Asian residents 62 34.2% Owner occupied119 65.8% Renter occupiedHouse owners and renters - Other race residents 72 33.5% Owner occupied142 66.5% Renter occupiedHouse owners and renters - Two or more races residents 108 16.6% Owner occupied540 83.4% Renter occupiedHouse owners and renters - White alone residents 2,160 65.5% Owner occupied1,139 34.5% Renter occupiedHouse owners and renters - Hispanic or Latino residents 110 24.5% Owner occupied338 75.5% Renter occupied
Language usage in Milford
English speakers - Total 74.6% of residents of Milford speak English at home.
10.7% of residents speak Spanish at home 480 39.3% Speak English very well742 60.7% Speak English less than very well12.2% of residents speak other language at home 930 66.3% Speak English very well473 33.7% Speak English less than very well
English speakers - Born in the United States 96.4% of residents of Milford speak English at home.
2.0% of residents speak Spanish at home 37 35.2% Speak English very well68 64.8% Speak English less than very well2.0% of residents speak other language at home 101 100.0% Speak English very well
English speakers - Native, born elsewhere 36.4% of residents of Milford speak English at home.
40.5% of residents speak Spanish at home 109 100.0% Speak English less than very well42.4% of residents speak other language at home 109 95.6% Speak English very well5 4.4% Speak English less than very well
English speakers - Foreign-born 11.7% of residents of Milford speak English at home.
36.2% of residents speak Spanish at home 198 26.8% Speak English very well540 73.2% Speak English less than very well41.6% of residents speak other language at home 400 47.2% Speak English very well447 52.8% Speak English less than very well
White (Caucasian) - Speak only English Native:
95.9% (6,158)Foreign-born:
39.4% (113)
White (Caucasian) - Speak another language Native:
3.0% (196)Foreign-born:
57.6% (166)
Black or African American - Speak only English Native:
83.8% (1,606)Foreign-born:
18.1% (60)
Black or African American - Speak another language Native:
9.1% (174)Foreign-born:
66.8% (220)
Asian - Speak only English Native:
100.0% (15)Foreign-born:
14.8% (50)
Asian - Speak another language Native:
38.3% (6)Foreign-born:
76.6% (260)
Other race - Speak another language Native:
61.9% (115)Foreign-born:
100.0% (582)
Two or more races - Speak only English Native:
43.2% (403)Foreign-born:
11.3% (31)
Two or more races - Speak another language Native:
58.4% (545)Foreign-born:
86.4% (233)
White alone - Speak only English Native:
96.8% (6,159)Foreign-born:
34.1% (119)
White alone - Speak another language Native:
3.4% (214)Foreign-born:
66.4% (232)
Hispanic or Latino - Speak only English Native:
35.1% (219)Foreign-born:
2.5% (19)
Hispanic or Latino - Speak another language Native:
64.9% (406)Foreign-born:
97.6% (749)
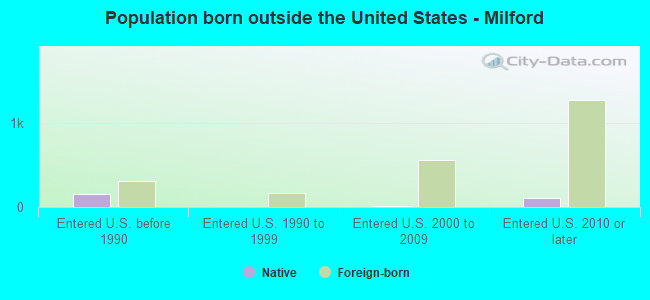
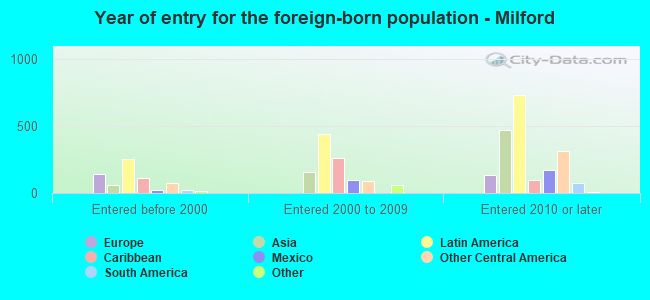
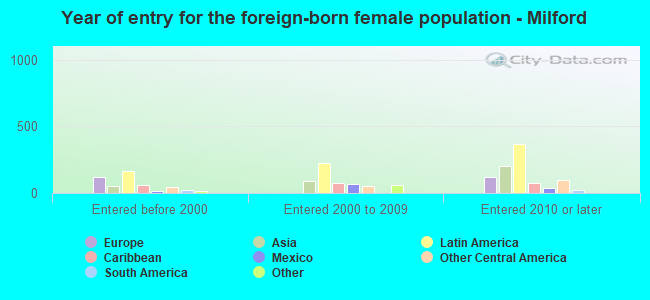
Foreign-born residents in Milford 2,149 residents are foreign born (11.5% Latin America , 3.7% Asia , 2.2% Europe ).
This city:
17.2%Delaware:
9.8%
Marital status for residents in Milford Marital status - White (Caucasian) population 15 years and over
Males 28.2% Never married52.8% Now married0.6% Separated0.8% Widowed17.6% DivorcedFemales 14.2% Never married44.1% Now married0.9% Separated22.4% Widowed18.4% DivorcedWomen who gave birth in the past 12 months Now married:
39.0% (16)Unmarried:
61.0% (25)
Women who did not give birth in the past 12 months Now married:
45.8% (461)Unmarried:
54.2% (545)
Marital status - Black or African American population 15 years and over
Males 42.4% Never married31.6% Now married3.2% Separated1.6% Widowed21.3% DivorcedFemales 48.1% Never married17.0% Now married5.2% Separated9.3% Widowed20.3% DivorcedWomen who did not give birth in the past 12 months Now married:
26.4% (185)Unmarried:
73.6% (518)
Marital status - American Indian / Alaska Native population 15 years and over
Males 67.3% Never married21.2% Now married0.0% Separated0.0% Widowed11.5% DivorcedFemales 0.0% Never married0.0% Now married0.0% Separated100.0% Widowed0.0% DivorcedMarital status - Asian population 15 years and over
Males 24.2% Never married75.8% Now married0.0% Separated0.0% Widowed0.0% DivorcedFemales 6.6% Never married53.3% Now married0.0% Separated30.1% Widowed10.0% DivorcedWomen who did not give birth in the past 12 months Now married:
83.5% (80)Unmarried:
16.5% (16)
Marital status - Other race population 15 years and over
Males 69.8% Never married30.2% Now married0.0% Separated0.0% Widowed0.0% DivorcedFemales 64.4% Never married35.6% Now married0.0% Separated0.0% Widowed0.0% DivorcedWomen who did not give birth in the past 12 months Now married:
26.8% (60)Unmarried:
73.2% (164)
Marital status - Two or more races population 15 years and over
Males 46.2% Never married7.3% Now married4.4% Separated6.2% Widowed36.0% DivorcedFemales 34.7% Never married9.4% Now married0.0% Separated3.3% Widowed52.5% DivorcedWomen who did not give birth in the past 12 months Now married:
10.7% (28)Unmarried:
89.3% (230)
Marital status - White alone, not Hispanic / Latino population 15 years and over
Males 25.4% Never married54.0% Now married0.7% Separated0.8% Widowed19.1% DivorcedFemales 14.0% Never married43.3% Now married0.9% Separated22.9% Widowed18.9% DivorcedWomen who gave birth in the past 12 months Now married:
39.0% (17)Unmarried:
61.0% (26)
Women who did not give birth in the past 12 months Now married:
44.4% (443)Unmarried:
55.6% (555)
Marital status - Hispanic or Latino population 15 years and over
Males 64.6% Never married32.3% Now married2.0% Separated0.0% Widowed1.0% DivorcedFemales 33.6% Never married30.4% Now married0.0% Separated2.8% Widowed33.2% DivorcedWomen who did not give birth in the past 12 months Now married:
35.4% (125)Unmarried:
64.6% (229)
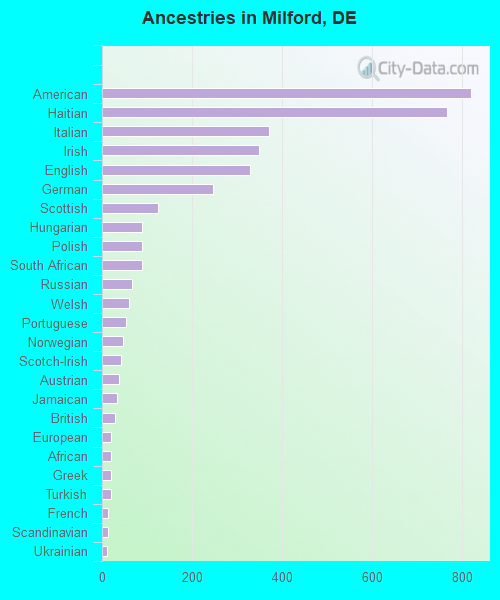
Ancestries in Milford
820 11.9% American767 11.1% Haitian372 5.4% Italian349 5.1% Irish329 4.8% English248 3.6% German124 1.8% Scottish90 1.3% Hungarian90 1.3% Polish89 1.3% South African67 1.0% Russian60 0.9% Welsh54 0.8% Portuguese47 0.7% Norwegian42 0.6% Scotch-Irish38 0.6% Austrian33 0.5% Jamaican29 0.4% British21 0.3% European21 0.3% African20 0.3% Greek20 0.3% Turkish14 0.2% French14 0.2% Scandinavian11 0.2% Ukrainian10 0.1% Lebanese9 0.1% Dutch
Geographical mobility in Milford Same house 1 year ago 6,322 89.8% White (Caucasian)2,216 81.0% Black or African American62 100.0% American Indian / Alaska Native309 79.4% Asian648 68.4% Other race1,261 91.1% Two or more races6,214 90.4% White alone, not Hispanic / Latino1,530 88.7% Hispanic or LatinoMoved within same county 178 2.5% White / Caucasian161 5.9% Black or African American88 9.2% Other race12 0.9% Two or more races187 2.7% White alone, not Hispanic / Latino78 4.5% Hispanic or LatinoMoved within same state 127 1.8% White / Caucasian131 4.8% Black or African American110 11.6% Other race99 1.4% White alone, not Hispanic / Latino38 2.2% Hispanic or LatinoMoved from different state 355 5.0% White / Caucasian53 1.9% Black or African American58 15.0% Asian51 5.3% Other race22 1.6% Two or more races363 5.3% White alone, not Hispanic / Latino77 4.5% Hispanic or LatinoMoved from abroad 21 0.3% White57 14.6% Asian17 1.8% Other race190 13.7% Two or more races1 0.0% White alone, not Hispanic / Latino36 2.1% Hispanic or Latino
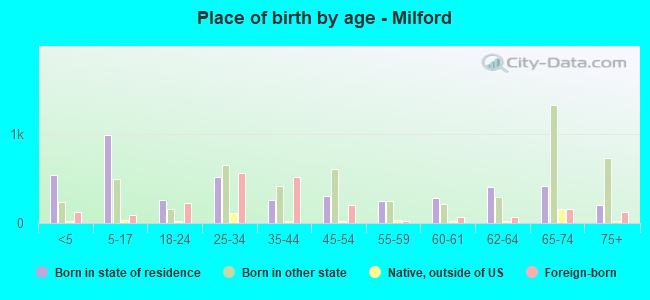
Children Nativity (place of birth) in Milford
Children under 6 years - Living with two parents Both parents native 92 100.0% NativeBoth parents foreign-born 341 77.8% Native97 22.2% Foreign-bornOne native, one foreign-born parent 159 100.0% Foreign-bornChildren under 6 years - Living with one parent Native parent 98 100.0% NativeForeign-born parent 249 94.7% Native14 5.3% Foreign-bornChildren 6 to 17 years - Living with two parents Both parents native 561 100.0% NativeBoth parents foreign-born 30 27.5% Native78 72.5% Foreign-bornOne native, one foreign-born parent 130 100.0% NativeChildren 6 to 17 years - Living with one parent Native parent 310 100.0% NativeForeign-born parent 298 49.5% Native304 50.5% Foreign-born
Grandparents responsible for own grandchildren in Milford
Grandparents (30 to 59 years) White / Caucasian 57 100.0% Not responsible for grandchildrenBlack or African American 42 100.0% Not responsible for grandchildrenWhite alone, not Hispanic / Latino 68 100.0% Not responsible for grandchildren
Grandparents (60 years and over)