Races in Miamisburg, Ohio (OH) Detailed Stats
Ancestries, Foreign-born residents, place of birth
Settings
X


Recent posts about races in Miamisburg, Ohio on our local forum with over 2,400,000 registered users:
 | Family moving to Dayton OH (4 replies) |
| Moving from India to Miamisburg, OH (4 replies) |
| Miamisburg good\bad Neighborhoods (10 replies) |
| Miamisburg Thoughts (3 replies) |
| The Dayton "Attitude" problem (115 replies) |
| Relocating to Dayton best areas for Families (23 replies) |
Latest news about races in Miamisburg, OH collected exclusively by city-data.com from local newspapers, TV, and radio stations
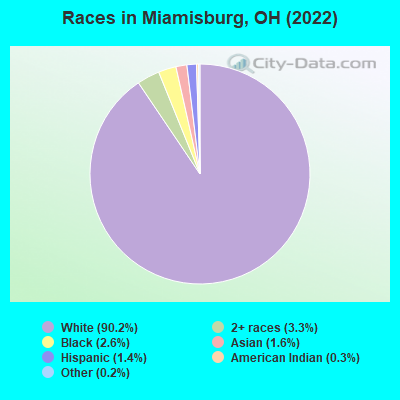
According to 2022 data, the most numerous races in Miamisburg, OH are White alone (17,846 residents), Black alone (521 residents), and Two or more races (650 residents). 96.0% of Miamisburg residents speak English at home. 2.7% of Miamisburg, OH residents are foreign-born (1.5% born in Asia, 0.5% born in Europe, 0.3% born in Latin America), which is 48.3% less than the foreign-born rate of 4.0% across the entire state of Ohio.
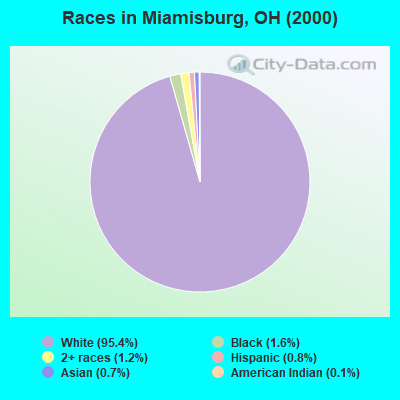
Race distribution in Miamisburg
2000
2022

- 18,60095.4%White alone
- 3091.6%Black alone
- 2301.2%Two or more races
- 1650.8%Hispanic
- 1420.7%Asian alone
- 230.1%American Indian alone
- 130.07%Other race alone
- 70.04%Native Hawaiian and Other
Pacific Islander alone
-
- 17,84690.2%White alone
- 6503.3%Two or more races
- 5212.6%Black alone
- 3111.6%Asian alone
- 2751.4%Hispanic
- 610.3%American Indian alone
- 440.2%Other race alone
2000
2022
-
- 9,538,11184.0%White alone
- 1,290,66211.4%Black alone
- 217,1231.9%Hispanic
- 137,7701.2%Two or more races
- 131,6701.2%Asian alone
- 21,9850.2%American Indian alone
- 13,4830.1%Other race alone
- 2,3360.02%Native Hawaiian and Other
Pacific Islander alone

-
- 8,948,79376.1%White alone
- 1,401,40311.9%Black alone
- 529,2914.5%Two or more races
- 517,2324.4%Hispanic
- 293,3872.5%Asian alone
- 52,8050.4%Other race alone
- 9,7850.08%American Indian alone
- 3,3620.03%Native Hawaiian and Other
Pacific Islander alone

Income and house value in Miamisburg
- Median household income in 2022
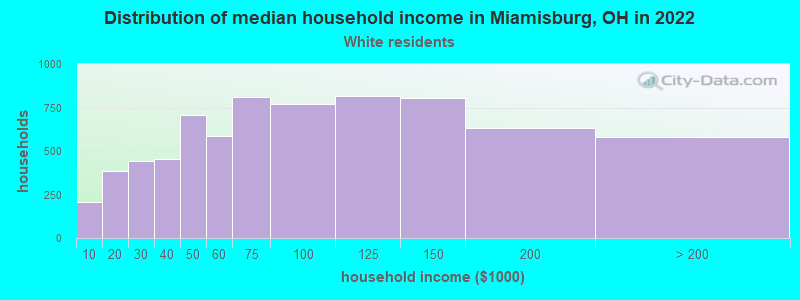
- $76,156White non-Hispanic householders
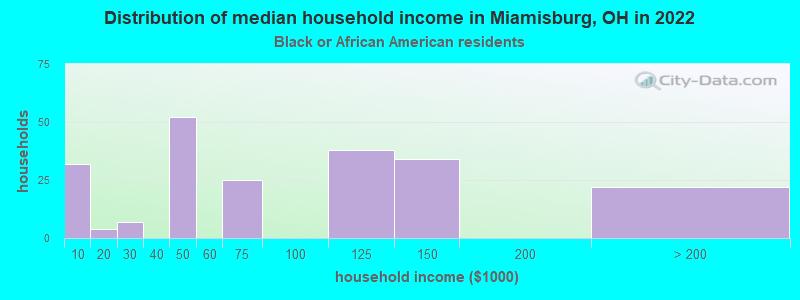
- $75,125Black householders
- $31,554Two or more races householders
- Median 2022 house value
- $214,095White Non-Hispanic householders
- $284,120Black or African American householders
- $167,290American Indian or Alaska Native householders
- $212,267Asian householders
- $179,723Two or more races householders
- $203,857Hispanic or Latino householders
Household income for White non-Hispanic householders
Household income for Black householders
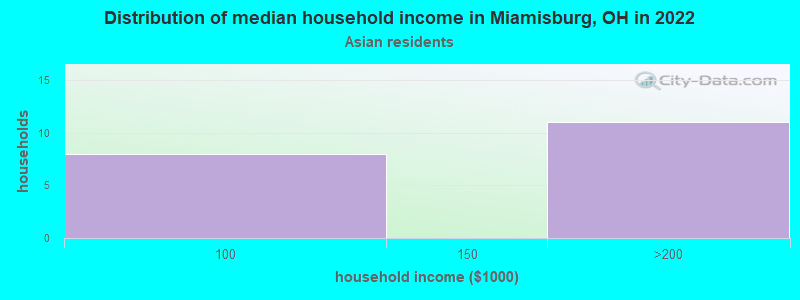
Household income for Asian householders
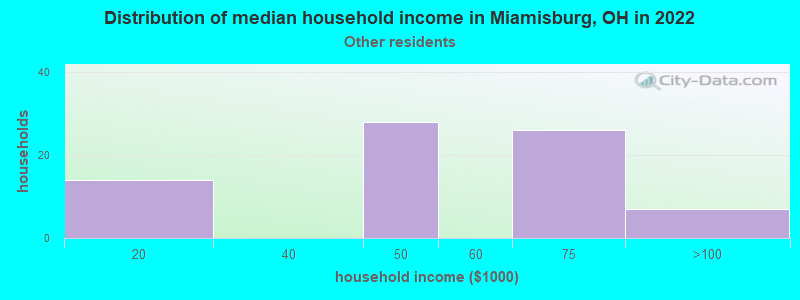
Household income for Some other race householders
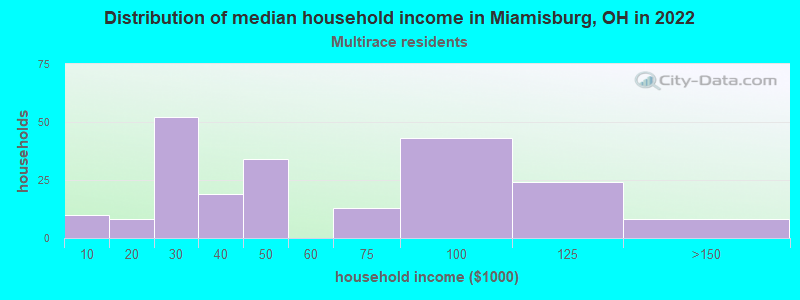
Household income for Two or more races householders
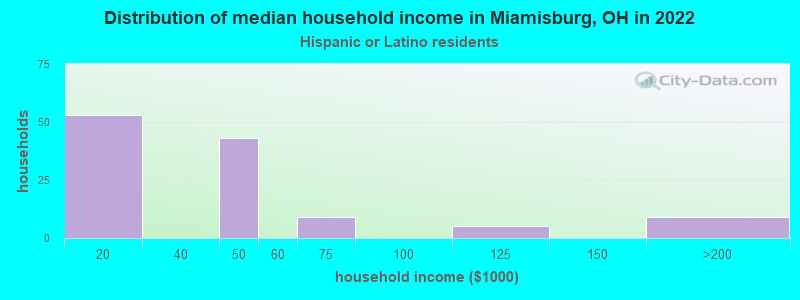
Household income for Hispanic or Latino race householders
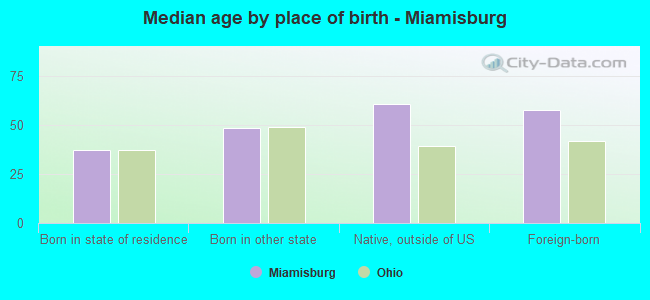
Median age by race in Miamisburg
- 41.0Median age for White residents
- 37.2Males
- 45.2Females
- 41.5Median age for Black or African American residents
- 60.2Males
- 36.6Females
- 33.0Median age for American Indian / Alaska Native residents
- -685,185,184.5Males
- -1,438,172,041.6Females
- 59.6Median age for Asian residents
- 36.6Males
- 57.7Females
- -800,387,596.1Median age for Native Hawaiian / Pacific Islander residents
- -750,242,953.6Males
- -805,394,989.6Females
- 61.5Median age for Other race residents
- 73.9Males
- 47.6Females
- 23.0Median age for Two or more races residents
- 29.9Males
- 9.3Females
- 40.8Median age for White alone residents
- 37.3Males
- 45.1Females
- 36.8Median age for Hispanic or Latino residents
- 37.1Males
- 36.5Females
Owner/renter occupied households by race in Miamisburg
- House owners and renters - White residents
- 5,11970.8%Owner occupied
- 2,11229.2%Renter occupied
- House owners and renters - Black or African American residents
- 13568.4%Owner occupied
- 6231.6%Renter occupied
- House owners and renters - American Indian / Alaska Native residents
- 21100.0%Owner occupied
- House owners and renters - Asian residents
- 20100.0%Owner occupied
- House owners and renters - Other race residents
- 5370.9%Owner occupied
- 2229.1%Renter occupied
- House owners and renters - Two or more races residents
- 5020.8%Owner occupied
- 19179.2%Renter occupied
- House owners and renters - White alone residents
- 5,07970.3%Owner occupied
- 2,14629.7%Renter occupied
- House owners and renters - Hispanic or Latino residents
- 6956.7%Owner occupied
- 5243.3%Renter occupied
Language usage in Miamisburg
- English speakers - Total
- 96.0% of residents of Miamisburg speak English at home.
- 0.9% of residents speak Spanish at home
- 12067.8%Speak English very well
- 5732.2%Speak English less than very well
- 2.8% of residents speak other language at home
- 40677.6%Speak English very well
- 11722.4%Speak English less than very well
- English speakers - Born in the United States
- 99.6% of residents of Miamisburg speak English at home.
- 0.1% of residents speak Spanish at home
- 5100.0%Speak English very well
- English speakers - Native, born elsewhere
- 52.6% of residents of Miamisburg speak English at home.
- 35.3% of residents speak Spanish at home
- 82100.0%Speak English very well
- 14.2% of residents speak other language at home
- 33100.0%Speak English very well
- English speakers - Foreign-born
- 29.1% of residents of Miamisburg speak English at home.
- 10.9% of residents speak Spanish at home
- 4174.5%Speak English very well
- 1425.5%Speak English less than very well
- 61.7% of residents speak other language at home
- 19662.8%Speak English very well
- 11637.2%Speak English less than very well
White (Caucasian) - Speak only English
| Native: | 98.6% (16,503) |
| Foreign-born: | 64.3% (137) |
White (Caucasian) - Speak another language
| Native: | 1.2% (208) |
| Foreign-born: | 35.3% (75) |
Black or African American - Speak only English
| Native: | 100.0% (466) |
| Foreign-born: | 46.4% (7) |
Asian - Speak another language
| Native: | 100.0% (29) |
| Foreign-born: | 100.0% (267) |
Two or more races - Speak another language
| Native: | 9.2% (54) |
| Foreign-born: | 100.0% (30) |
White alone - Speak only English
| Native: | 98.6% (16,475) |
| Foreign-born: | 68.0% (135) |
White alone - Speak another language
| Native: | 1.3% (223) |
| Foreign-born: | 25.8% (51) |
Hispanic or Latino - Speak another language
| Native: | 49.2% (96) |
| Foreign-born: | 97.0% (57) |
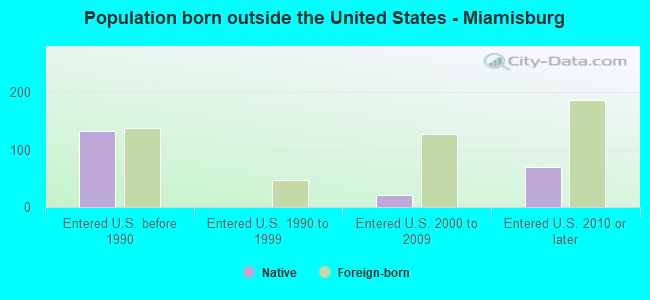
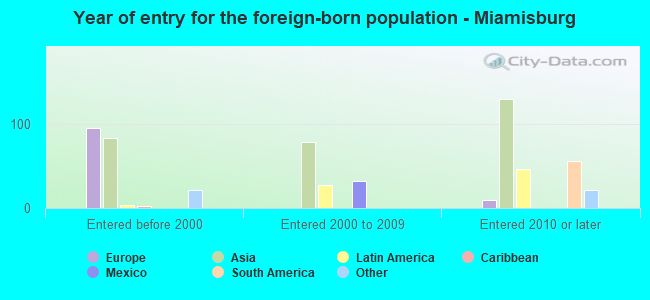
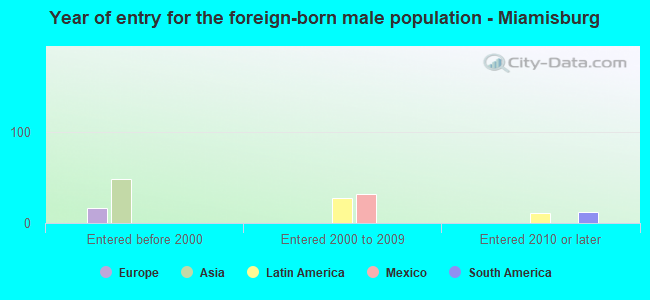
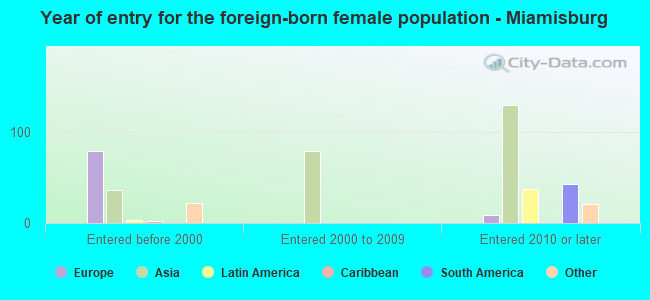
Foreign-born residents in Miamisburg
534 residents are foreign born (1.5% Asia, 0.5% Europe, 0.3% Latin America).
| This city: | 2.7% |
| Ohio: | 4.9% |

Marital status for residents in Miamisburg
Marital status - White (Caucasian) population 15 years and over
- Males
- 31.4%Never married
- 56.8%Now married
- 0.7%Separated
- 2.2%Widowed
- 8.9%Divorced
- Females
- 24.2%Never married
- 52.2%Now married
- 1.5%Separated
- 10.7%Widowed
- 11.4%Divorced
Women who gave birth in the past 12 months
| Now married: | 31.0% (199) |
| Unmarried: | 69.0% (444) |
Women who did not give birth in the past 12 months
| Now married: | 44.1% (1,316) |
| Unmarried: | 55.9% (1,669) |
Marital status - Black or African American population 15 years and over
- Males
- 36.6%Never married
- 46.6%Now married
- 0.0%Separated
- 16.8%Widowed
- 0.0%Divorced
- Females
- 45.5%Never married
- 25.4%Now married
- 0.0%Separated
- 12.9%Widowed
- 16.3%Divorced
Women who did not give birth in the past 12 months
| Now married: | 8.4% (13) |
| Unmarried: | 91.6% (142) |
Marital status - Asian population 15 years and over
- Males
- 16.3%Never married
- 67.4%Now married
- 0.0%Separated
- 0.0%Widowed
- 16.3%Divorced
- Females
- 0.0%Never married
- 43.5%Now married
- 0.0%Separated
- 56.5%Widowed
- 0.0%Divorced
Women who did not give birth in the past 12 months
| Now married: | 100.0% (92) |
| Unmarried: | 0.0% (0) |
Marital status - Other race population 15 years and over
- Males
- 50.0%Never married
- 50.0%Now married
- 0.0%Separated
- 0.0%Widowed
- 0.0%Divorced
- Females
- 48.6%Never married
- 0.0%Now married
- 0.0%Separated
- 16.2%Widowed
- 35.1%Divorced
Women who did not give birth in the past 12 months
| Now married: | 0.0% (0) |
| Unmarried: | 100.0% (24) |
Marital status - Two or more races population 15 years and over
- Males
- 44.7%Never married
- 38.1%Now married
- 0.0%Separated
- 7.0%Widowed
- 10.2%Divorced
- Females
- 47.5%Never married
- 42.4%Now married
- 0.0%Separated
- 5.9%Widowed
- 4.2%Divorced
Women who gave birth in the past 12 months
| Now married: | 100.0% (41) |
| Unmarried: | 0.0% (0) |
Women who did not give birth in the past 12 months
| Now married: | 37.0% (27) |
| Unmarried: | 63.0% (46) |
Marital status - White alone, not Hispanic / Latino population 15 years and over
- Males
- 31.5%Never married
- 56.6%Now married
- 0.7%Separated
- 2.2%Widowed
- 9.0%Divorced
- Females
- 24.2%Never married
- 52.4%Now married
- 1.5%Separated
- 10.4%Widowed
- 11.5%Divorced
Women who gave birth in the past 12 months
| Now married: | 31.0% (202) |
| Unmarried: | 69.0% (449) |
Women who did not give birth in the past 12 months
| Now married: | 44.0% (1,312) |
| Unmarried: | 56.0% (1,669) |
Marital status - Hispanic or Latino population 15 years and over
- Males
- 15.0%Never married
- 56.0%Now married
- 0.0%Separated
- 0.0%Widowed
- 29.0%Divorced
- Females
- 34.3%Never married
- 18.1%Now married
- 0.0%Separated
- 35.2%Widowed
- 12.4%Divorced
Women who did not give birth in the past 12 months
| Now married: | 34.5% (21) |
| Unmarried: | 65.5% (39) |
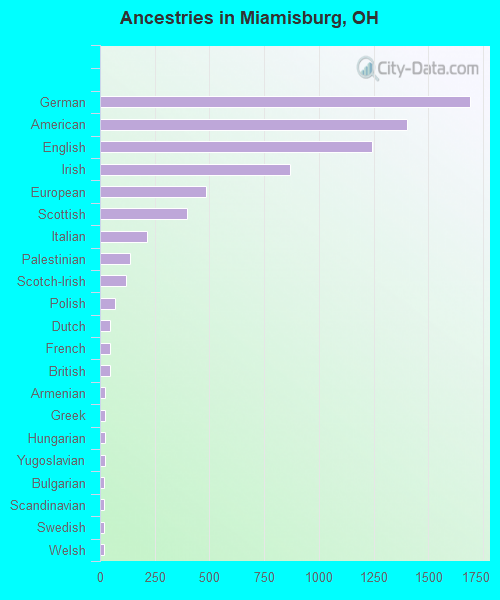
Ancestries in Miamisburg

- 1,69220.4%German
- 1,40216.9%American
- 1,24315.0%English
- 86810.4%Irish
- 4825.8%European
- 3974.8%Scottish
- 2142.6%Italian
- 1361.6%Palestinian
- 1191.4%Scotch-Irish
- 680.8%Polish
- 460.6%Dutch
- 460.6%French
- 440.5%British
- 250.3%Armenian
- 250.3%Greek
- 220.3%Hungarian
- 210.3%Yugoslavian
- 180.2%Bulgarian
- 180.2%Scandinavian
- 170.2%Swedish
- 170.2%Welsh
- 140.2%Ghanaian
- 130.2%Celtic
- 110.1%Croatian
- 110.1%Czechoslovakian
- 110.1%Eastern European
- 110.1%Lithuanian
- 90.1%Czech
- 90.1%Slovak
- 80.10%Australian
- 70.08%Jamaican
- 20.02%Austrian
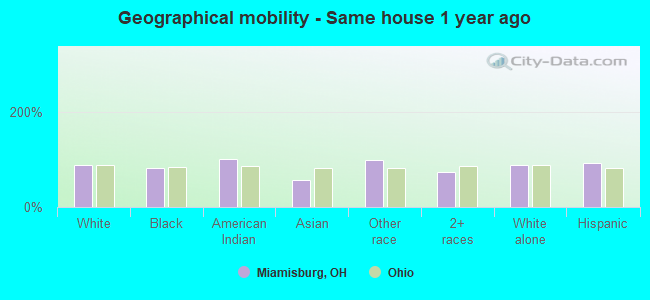
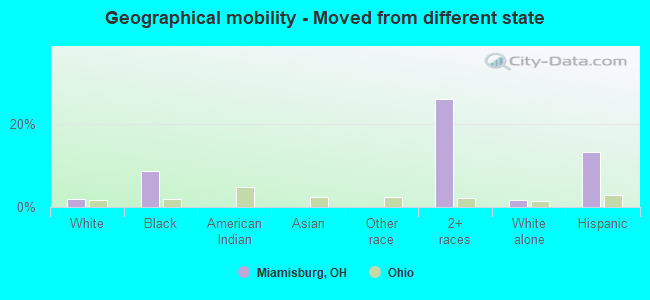
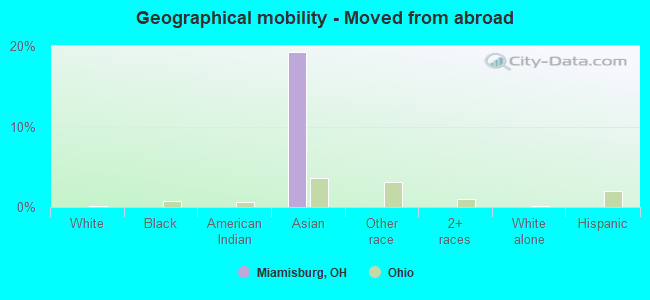
Geographical mobility in Miamisburg

- Same house 1 year ago
- 15,39288.1%White (Caucasian)
- 43082.0%Black or African American
- 75100.0%American Indian / Alaska Native
- 18157.1%Asian
- 9798.6%Other race
- 53172.8%Two or more races
- 15,39588.2%White alone, not Hispanic / Latino
- 24191.7%Hispanic or Latino
-
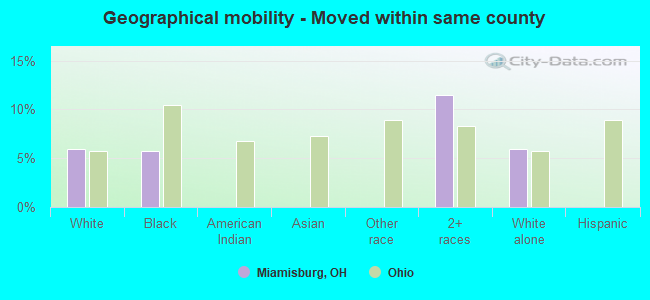
- Moved within same county
- 1,0305.9%White / Caucasian
- 305.7%Black or African American
- 8311.4%Two or more races
- 1,0305.9%White alone, not Hispanic / Latino
-
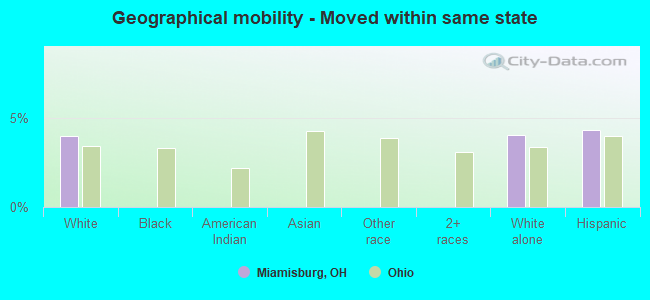
- Moved within same state
- 6974.0%White / Caucasian
- 7024.0%White alone, not Hispanic / Latino
- 114.3%Hispanic or Latino
-
- Moved from different state
- 3311.9%White / Caucasian
- 468.7%Black or African American
- 19026.1%Two or more races
- 3001.7%White alone, not Hispanic / Latino
- 3513.4%Hispanic or Latino
-
- Moved from abroad
- 6119.3%Asian
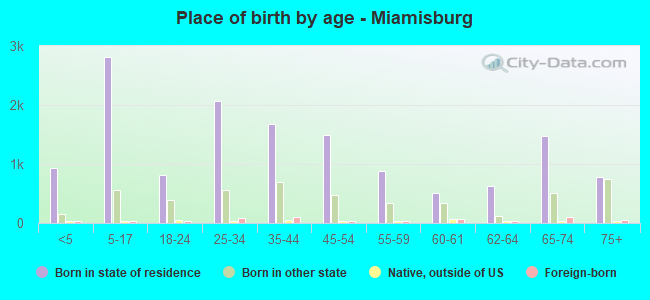
Children Nativity (place of birth) in Miamisburg
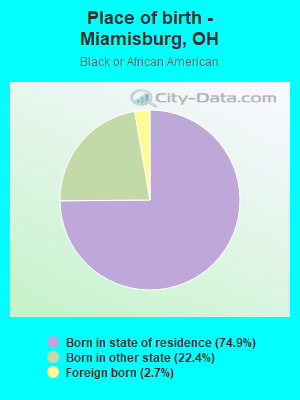
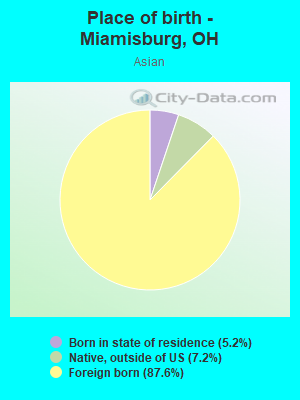
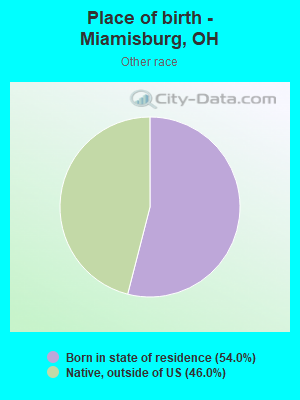
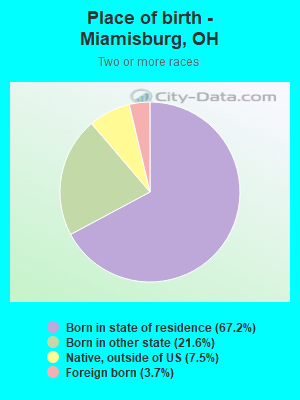
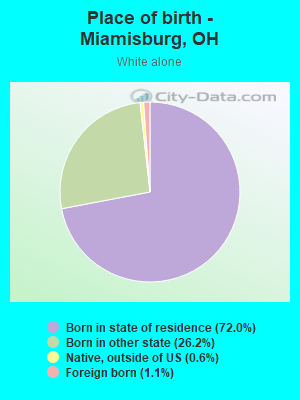
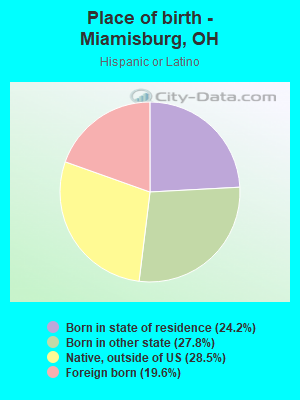
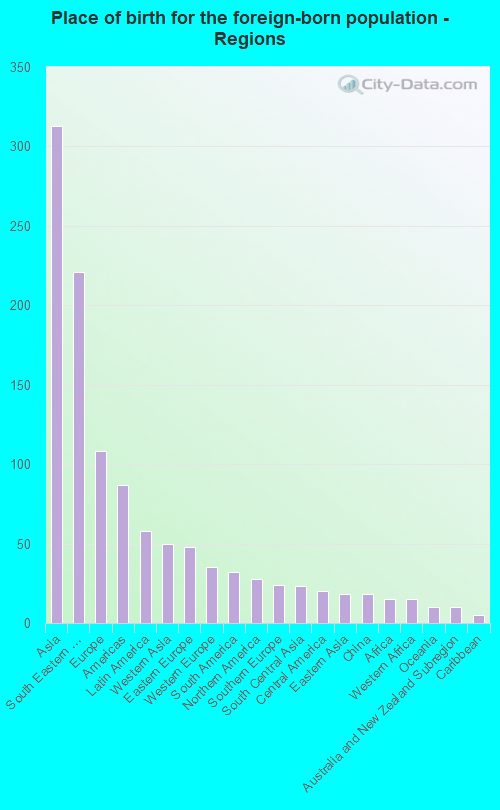
Place of birth for residents in Miamisburg
![Place of birth for the foreign-born population - Regions]()
- 313Asia
- 221South Eastern Asia
- 108Europe
- 87Americas
- 58Latin America
- 50Western Asia
- 48Eastern Europe
- 35Western Europe
- 32South America
- 28Northern America
- 24Southern Europe
- 23South Central Asia
- 20Central America
- 18Eastern Asia
- 18China
- 15Africa
- 15Western Africa
- 10Oceania
- 10Australia and New Zealand Subregion
- 5Caribbean
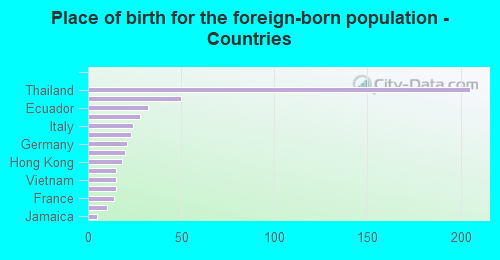
![Place of birth for the foreign-born population - Countries]()
- 205Thailand
- 50Jordan
- 32Ecuador
- 28Canada
- 24Italy
- 23India
- 21Germany
- 20Mexico
- 18Hong Kong
- 15Bulgaria
- 15Vietnam
- 15Ghana
- 14France
- 10Australia
- 5Jamaica
Grandparents responsible for own grandchildren in Miamisburg
Zip codes: 45449.