Races in Methuen, Massachusetts (MA) Detailed Stats
Latest news about races in Methuen, MA collected exclusively by city-data.com from local newspapers, TV, and radio stations
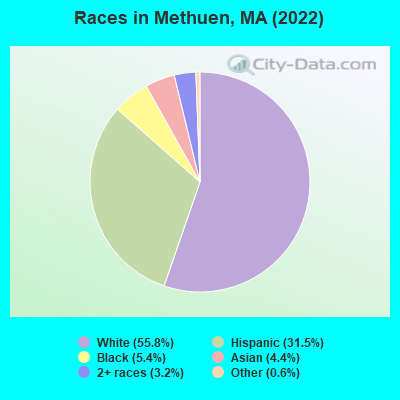
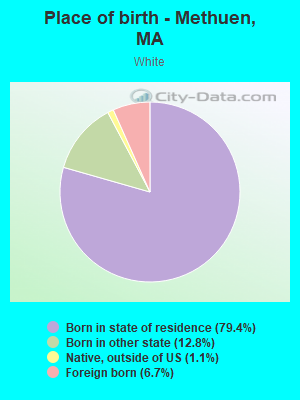
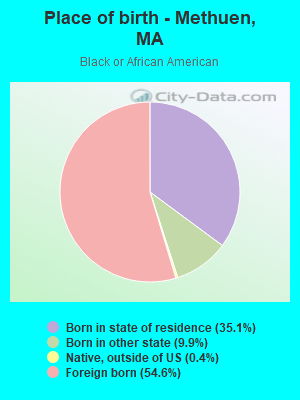
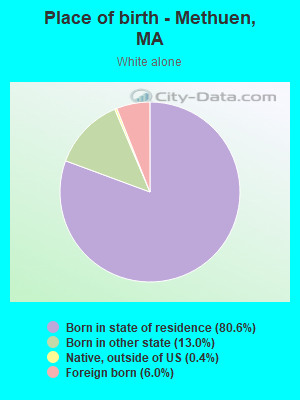
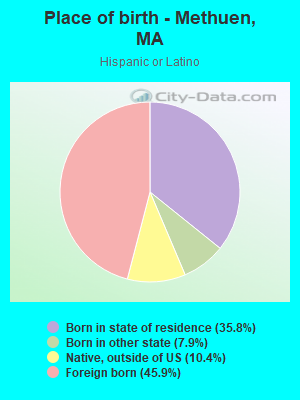
According to 2022 data, the most numerous races in Methuen, MA are White alone (29,473 residents), Hispanic (16,633 residents), and Asian alone (2,320 residents). 61.6% of Methuen residents speak English at home. 23.7% of Methuen, MA residents are foreign-born (15.7% born in Latin America, 4.1% born in Asia), which is 24.1% greater than the foreign-born rate of 18.0% across the entire state of Massachusetts.
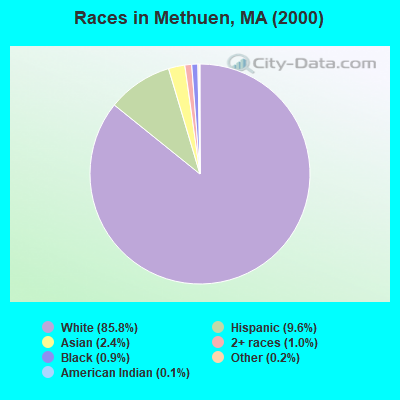
Race distribution in Methuen
2000 2022
5,198,359 81.9% White alone 428,729 6.8% Hispanic 318,329 5.0% Black alone 236,786 3.7% Asian alone 110,338 1.7% Two or more races 43,586 0.7% Other race alone 11,264 0.2% American Indian alone 1,706 0.03% Native Hawaiian and Other
4,676,627 67.0% White alone 911,038 13.0% Hispanic 501,463 7.2% Asian alone 459,740 6.6% Black alone 341,889 4.9% Two or more races 84,403 1.2% Other race alone 5,838 0.08% American Indian alone 976 0.01% Native Hawaiian and Other
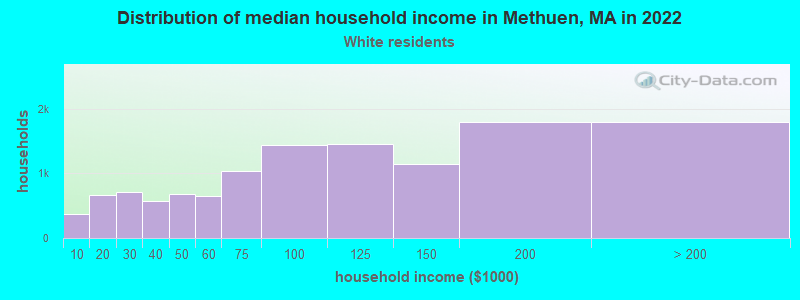
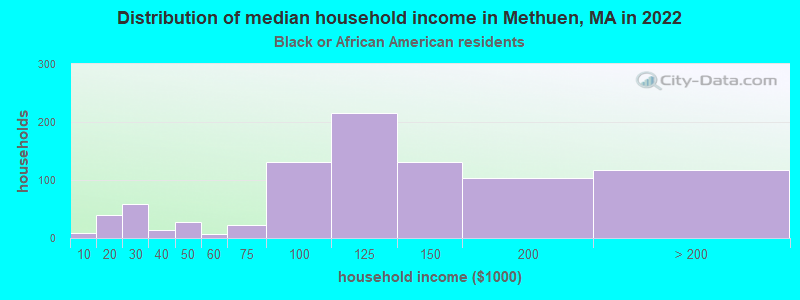
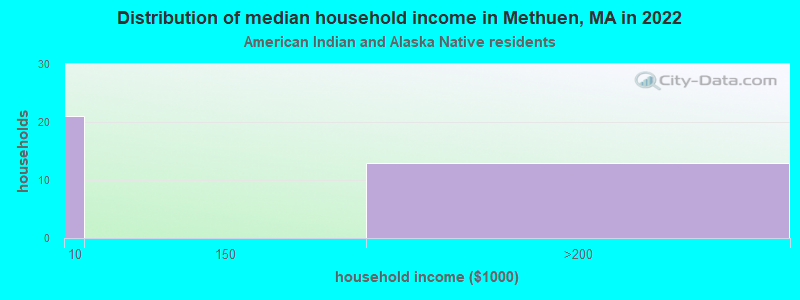
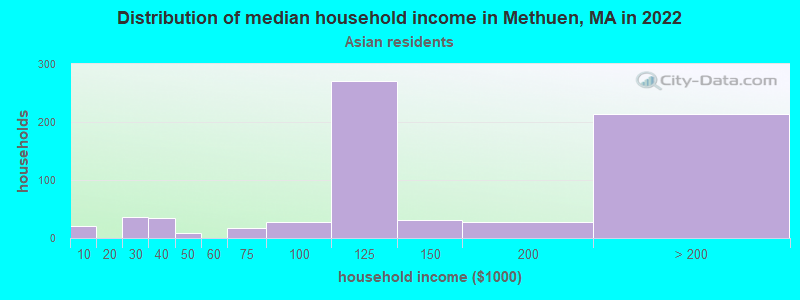
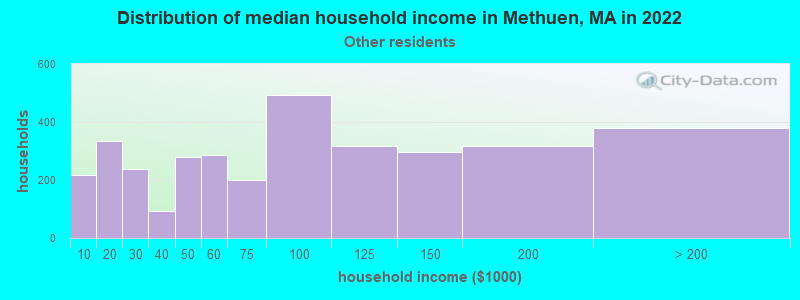
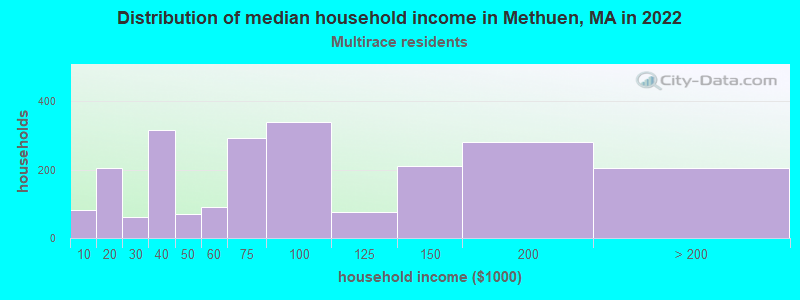
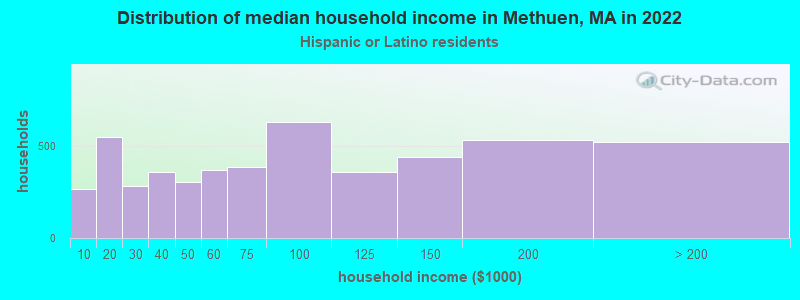
Income and house value in Methuen Median household income in 2022 $98,755 White non-Hispanic householders$133,085 Black householders$97,907 Asian householders$66,901 Some other race householders$79,716 Two or more races householders$64,862 Hispanic or Latino race householdersMedian 2022 house value $486,937 White Non-Hispanic householders$330,836 Black or African American householders $535,509 Asian householders$168,014 Native Hawaiian and other Pacific Islander householders$348,249 Some other race householders$477,468 Two or more races householders$412,705 Hispanic or Latino householders
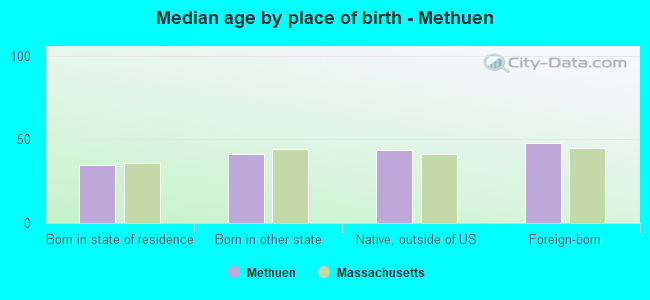
Median age by race in Methuen
47.2 Median age for White residents45.6 48.5 35.1 Median age for Black or African American residents29.6 38.8 33.0 Median age for American Indian / Alaska Native residents34.1 16.6 36.6 Median age for Asian residents41.6 34.5 -514,227,641.8 Median age for Native Hawaiian / Pacific Islander residents-666,666,666.0 -508,717,948.2 34.7 Median age for Other race residents34.1 37.2 30.2 Median age for Two or more races residents27.8 31.6 47.8 Median age for White alone residents46.4 49.6 33.4 Median age for Hispanic or Latino residents33.1 34.3
Owner/renter occupied households by race in Methuen
House owners and renters - White residents 10,453 83.4% Owner occupied2,078 16.6% Renter occupiedHouse owners and renters - Black or African American residents 656 72.5% Owner occupied249 27.5% Renter occupiedHouse owners and renters - American Indian / Alaska Native residents 33 100.0% Renter occupiedHouse owners and renters - Asian residents 644 91.7% Owner occupied58 8.3% Renter occupiedHouse owners and renters - Other race residents 1,760 48.8% Owner occupied1,845 51.2% Renter occupiedHouse owners and renters - Two or more races residents 1,120 51.6% Owner occupied1,051 48.4% Renter occupiedHouse owners and renters - White alone residents 10,229 83.6% Owner occupied2,003 16.4% Renter occupiedHouse owners and renters - Hispanic or Latino residents 2,517 49.9% Owner occupied2,525 50.1% Renter occupied
Language usage in Methuen
English speakers - Total 61.6% of residents of Methuen speak English at home.
26.2% of residents speak Spanish at home 8,021 60.4% Speak English very well5,259 39.6% Speak English less than very well12.2% of residents speak other language at home 4,029 65.3% Speak English very well2,144 34.7% Speak English less than very well
English speakers - Born in the United States 78.1% of residents of Methuen speak English at home.
17.5% of residents speak Spanish at home 905 96.6% Speak English very well32 3.4% Speak English less than very well2.9% of residents speak other language at home 137 89.0% Speak English very well17 11.0% Speak English less than very well
English speakers - Native, born elsewhere 18.8% of residents of Methuen speak English at home.
77.8% of residents speak Spanish at home 996 67.5% Speak English very well479 32.5% Speak English less than very well1.5% of residents speak other language at home 28 100.0% Speak English very well
English speakers - Foreign-born 10.9% of residents of Methuen speak English at home.
53.7% of residents speak Spanish at home 2,715 39.1% Speak English very well4,237 60.9% Speak English less than very well33.5% of residents speak other language at home 2,362 54.5% Speak English very well1,968 45.5% Speak English less than very well
White (Caucasian) - Speak only English Native:
95.3% (26,147)Foreign-born:
22.4% (454)
White (Caucasian) - Speak another language Native:
4.8% (1,310)Foreign-born:
77.2% (1,567)
Black or African American - Speak only English Native:
75.3% (901)Foreign-born:
31.6% (507)
Black or African American - Speak another language Native:
23.6% (282)Foreign-born:
69.4% (1,114)
American Indian / Alaska Native - Speak another language Native:
75.1% (18)Foreign-born:
100.0% (151)
Asian - Speak only English Native:
15.3% (121)Foreign-born:
2.1% (31)
Asian - Speak another language Native:
75.8% (595)Foreign-born:
100.0% (1,497)
Other race - Speak only English Native:
18.0% (976)Foreign-born:
7.7% (424)
Other race - Speak another language Native:
80.5% (4,371)Foreign-born:
92.4% (5,068)
Two or more races - Speak only English Native:
46.5% (1,801)Foreign-born:
6.5% (182)
Two or more races - Speak another language Native:
55.4% (2,147)Foreign-born:
92.7% (2,600)
White alone - Speak only English Native:
96.5% (25,906)Foreign-born:
23.3% (411)
White alone - Speak another language Native:
3.5% (949)Foreign-born:
77.1% (1,361)
Hispanic or Latino - Speak only English Native:
24.7% (1,959)Foreign-born:
7.7% (581)
Hispanic or Latino - Speak another language Native:
74.9% (5,930)Foreign-born:
92.5% (7,013)
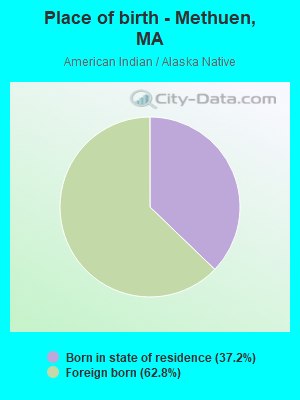
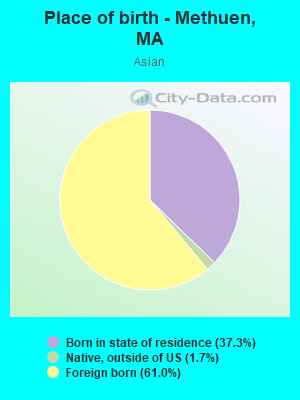
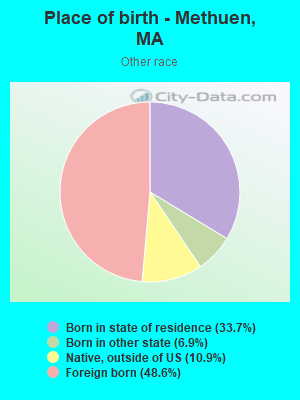
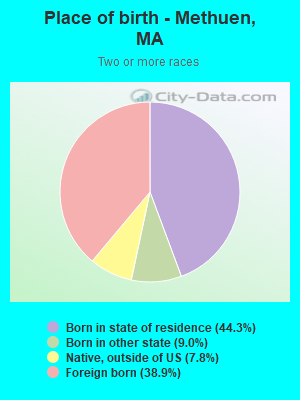
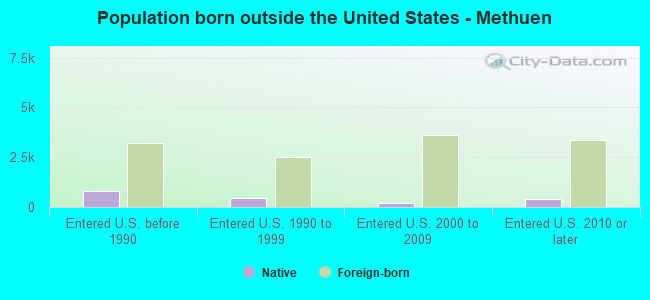
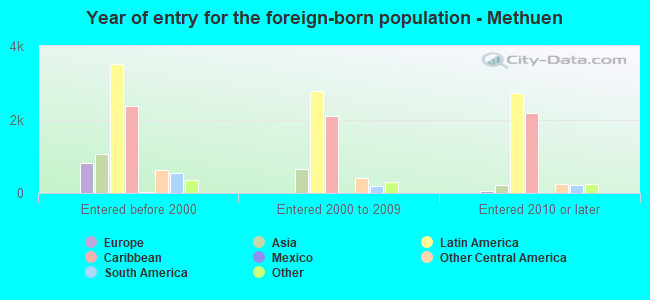
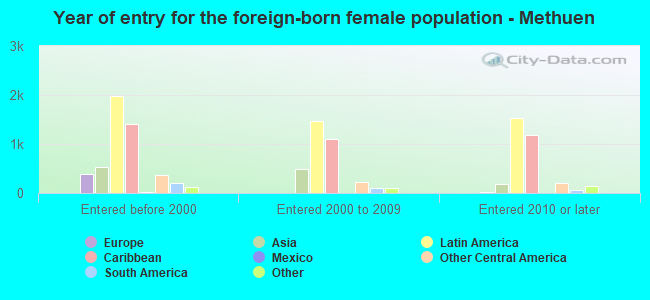
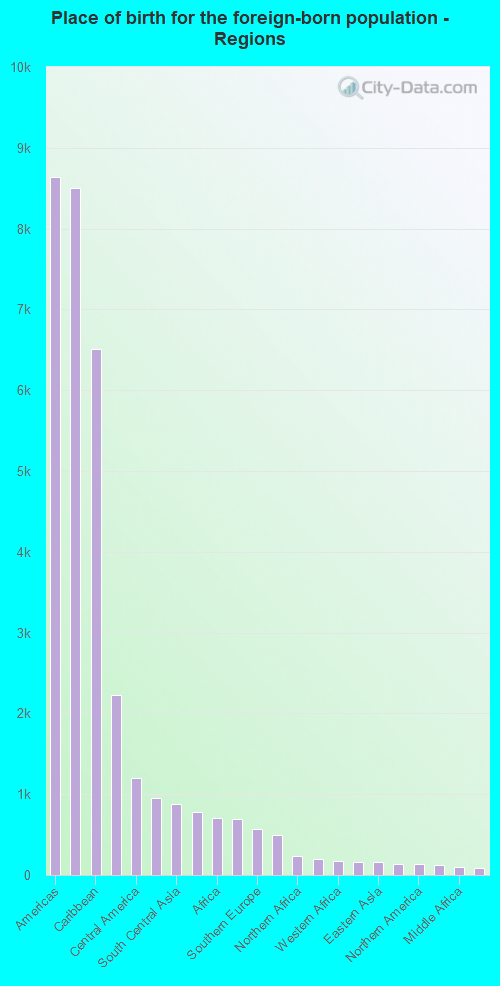
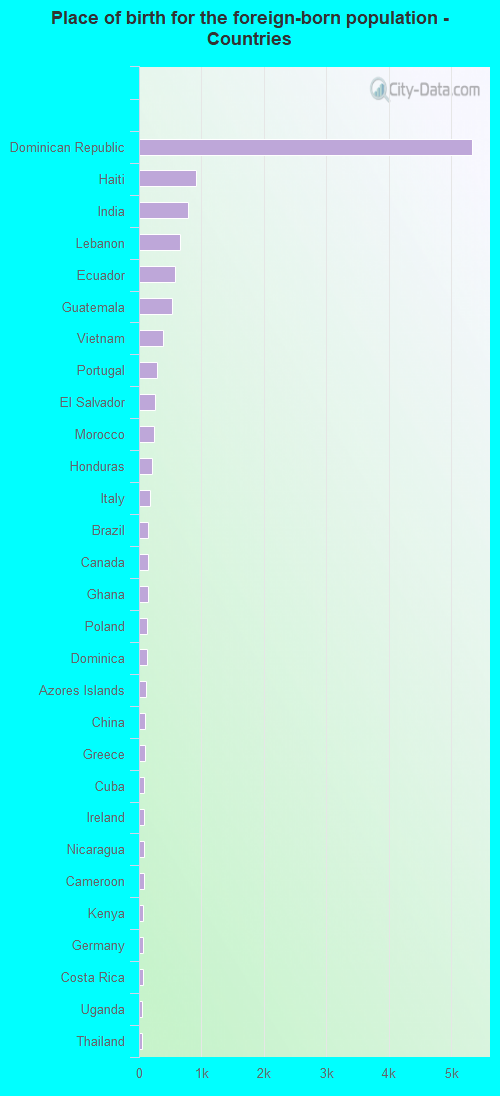
Foreign-born residents in Methuen 12,539 residents are foreign born (15.7% Latin America , 4.1% Asia ).
This city:
23.7%Massachusetts:
17.6%
Marital status for residents in Methuen Marital status - White (Caucasian) population 15 years and over
Males 34.9% Never married52.3% Now married1.6% Separated2.9% Widowed8.4% DivorcedFemales 30.2% Never married47.1% Now married1.4% Separated9.3% Widowed12.0% DivorcedWomen who gave birth in the past 12 months Now married:
87.7% (147)Unmarried:
12.3% (21)
Women who did not give birth in the past 12 months Now married:
41.0% (2,529)Unmarried:
59.0% (3,635)
Marital status - Black or African American population 15 years and over
Males 37.2% Never married58.9% Now married0.0% Separated0.8% Widowed3.1% DivorcedFemales 35.5% Never married41.1% Now married1.8% Separated1.8% Widowed19.8% DivorcedWomen who gave birth in the past 12 months Now married:
43.3% (12)Unmarried:
56.7% (16)
Women who did not give birth in the past 12 months Now married:
45.6% (399)Unmarried:
54.4% (476)
Marital status - American Indian / Alaska Native population 15 years and over
Males 65.5% Never married34.5% Now married0.0% Separated0.0% Widowed0.0% DivorcedFemales 100.0% Never married0.0% Now married0.0% Separated0.0% Widowed0.0% DivorcedWomen who gave birth in the past 12 months Now married:
0.0% (0)Unmarried:
100.0% (13)
Women who did not give birth in the past 12 months Now married:
0.0% (0)Unmarried:
100.0% (29)
Marital status - Asian population 15 years and over
Males 26.8% Never married73.2% Now married0.0% Separated0.0% Widowed0.0% DivorcedFemales 30.3% Never married53.0% Now married0.0% Separated14.1% Widowed2.6% DivorcedWomen who gave birth in the past 12 months Now married:
100.0% (21)Unmarried:
0.0% (0)
Women who did not give birth in the past 12 months Now married:
49.8% (346)Unmarried:
50.2% (348)
Marital status - Other race population 15 years and over
Males 43.9% Never married38.6% Now married4.4% Separated0.9% Widowed12.2% DivorcedFemales 42.2% Never married37.8% Now married3.9% Separated3.1% Widowed13.0% DivorcedWomen who gave birth in the past 12 months Now married:
65.3% (165)Unmarried:
34.7% (88)
Women who did not give birth in the past 12 months Now married:
35.7% (1,023)Unmarried:
64.3% (1,845)
Marital status - Two or more races population 15 years and over
Males 43.8% Never married49.1% Now married0.5% Separated0.5% Widowed6.1% DivorcedFemales 41.9% Never married40.0% Now married1.6% Separated1.1% Widowed15.5% DivorcedWomen who gave birth in the past 12 months Now married:
36.0% (53)Unmarried:
64.0% (95)
Women who did not give birth in the past 12 months Now married:
25.8% (520)Unmarried:
74.2% (1,495)
Marital status - White alone, not Hispanic / Latino population 15 years and over
Males 34.1% Never married52.6% Now married1.6% Separated3.1% Widowed8.6% DivorcedFemales 29.3% Never married47.8% Now married1.1% Separated9.7% Widowed12.1% DivorcedWomen who gave birth in the past 12 months Now married:
96.9% (149)Unmarried:
3.1% (5)
Women who did not give birth in the past 12 months Now married:
41.1% (2,428)Unmarried:
58.9% (3,478)
Marital status - Hispanic or Latino population 15 years and over
Males 43.6% Never married43.3% Now married2.9% Separated0.6% Widowed9.7% DivorcedFemales 41.9% Never married38.4% Now married3.3% Separated2.9% Widowed13.6% DivorcedWomen who gave birth in the past 12 months Now married:
49.0% (185)Unmarried:
51.0% (192)
Women who did not give birth in the past 12 months Now married:
35.5% (1,499)Unmarried:
64.5% (2,724)
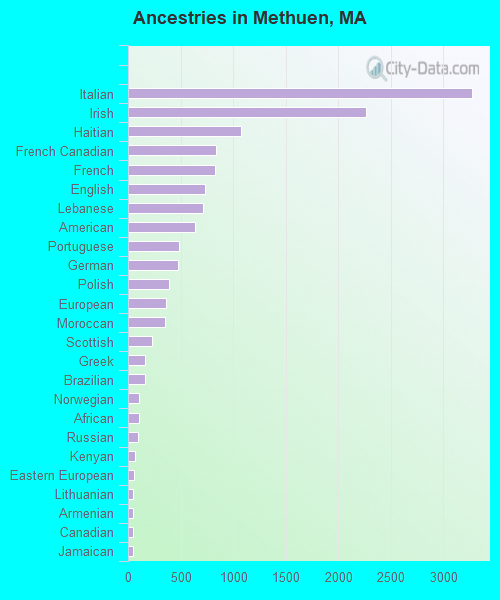
Ancestries in Methuen
3,272 11.3% Italian2,265 7.8% Irish1,078 3.7% Haitian839 2.9% French Canadian832 2.9% French736 2.5% English712 2.5% Lebanese635 2.2% American483 1.7% Portuguese476 1.6% German393 1.4% Polish362 1.2% European355 1.2% Moroccan226 0.8% Scottish164 0.6% Greek159 0.5% Brazilian108 0.4% Norwegian107 0.4% African92 0.3% Russian63 0.2% Kenyan56 0.2% Eastern European52 0.2% Lithuanian51 0.2% Armenian50 0.2% Canadian43 0.1% Jamaican28 0.10% Cape Verdean26 0.09% Ukrainian23 0.08% Scotch-Irish20 0.07% Scandinavian18 0.06% Iranian13 0.04% Syrian13 0.04% Swiss12 0.04% British9 0.03% Latvian7 0.02% Swedish6 0.02% Arab6 0.02% Croatian4 0.01% Hungarian
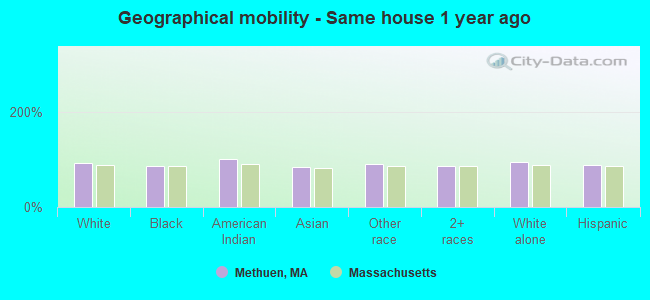
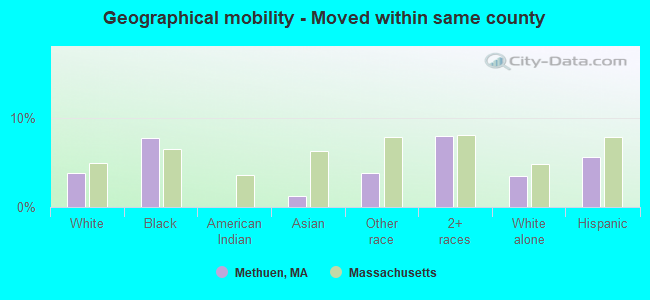
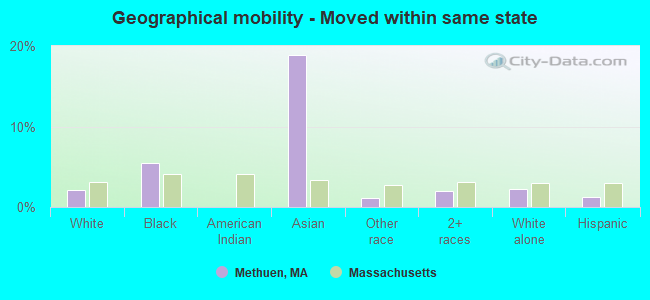
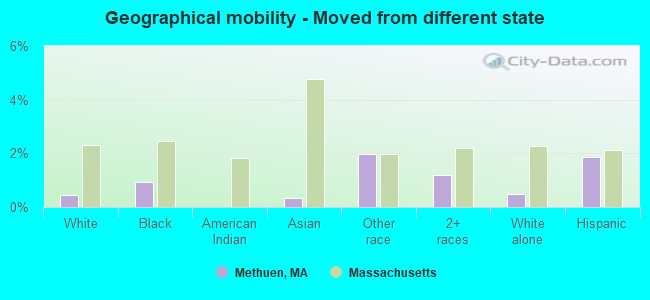
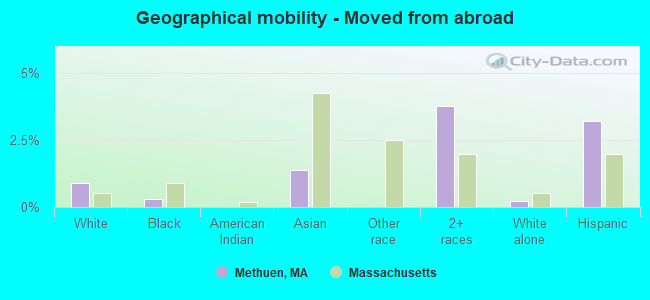
Geographical mobility in Methuen Same house 1 year ago 28,075 93.0% White (Caucasian)2,430 85.1% Black or African American141 100.0% American Indian / Alaska Native2,011 83.3% Asian10,249 90.6% Other race6,010 84.9% Two or more races27,432 93.6% White alone, not Hispanic / Latino14,507 88.1% Hispanic or LatinoMoved within same county 1,145 3.8% White / Caucasian219 7.7% Black or African American29 1.2% Asian425 3.8% Other race566 8.0% Two or more races1,006 3.4% White alone, not Hispanic / Latino925 5.6% Hispanic or LatinoMoved within same state 625 2.1% White / Caucasian157 5.5% Black or African American455 18.8% Asian128 1.1% Other race138 1.9% Two or more races649 2.2% White alone, not Hispanic / Latino212 1.3% Hispanic or LatinoMoved from different state 137 0.5% White / Caucasian27 0.9% Black or African American8 0.3% Asian225 2.0% Other race84 1.2% Two or more races138 0.5% White alone, not Hispanic / Latino305 1.9% Hispanic or LatinoMoved from abroad 272 0.9% White9 0.3% Black or African American34 1.4% Asian266 3.8% Two or more races62 0.2% White alone, not Hispanic / Latino525 3.2% Hispanic or Latino
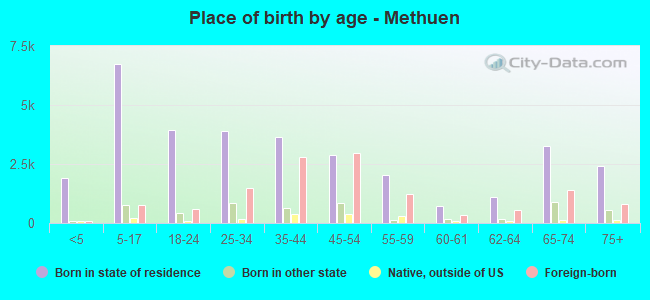
Children Nativity (place of birth) in Methuen
Children under 6 years - Living with two parents Both parents native 845 100.0% NativeBoth parents foreign-born 308 100.0% NativeOne native, one foreign-born parent 257 100.0% NativeChildren under 6 years - Living with one parent Native parent 688 100.0% NativeForeign-born parent 395 89.7% Native45 10.3% Foreign-bornChildren 6 to 17 years - Living with two parents Both parents native 1,885 100.0% NativeBoth parents foreign-born 1,941 87.9% Native268 12.1% Foreign-bornOne native, one foreign-born parent 532 80.8% Native127 19.2% Foreign-bornChildren 6 to 17 years - Living with one parent Native parent 1,593 100.0% NativeForeign-born parent 1,123 58.1% Native810 41.9% Foreign-born
Grandparents responsible for own grandchildren in Methuen
Grandparents (30 to 59 years) White / Caucasian 5 6.1% Responsible for grandchildren75 93.9% Not responsible for grandchildrenBlack or African American 51 100.0% Not responsible for grandchildrenAmerican Indian / Alaska Native 11 100.0% Not responsible for grandchildrenOther race 61 24.9% Responsible for grandchildren182 75.1% Not responsible for grandchildrenTwo or more races 177 100.0% Not responsible for grandchildrenWhite alone, not Hispanic / Latino 71 100.0% Not responsible for grandchildrenHispanic or Latino 59 12.7% Responsible for grandchildren406 87.3% Not responsible for grandchildrenGrandparents (60 years and over) White / Caucasian 187 41.6% Responsible for grandchildren263 58.4% Not responsible for grandchildrenBlack or African American 29 83.0% Responsible for grandchildren6 17.0% Not responsible for grandchildrenOther race 253 100.0% Not responsible for grandchildrenTwo or more races 23 40.1% Responsible for grandchildren34 59.9% Not responsible for grandchildrenWhite alone, not Hispanic / Latino 176 39.1% Responsible for grandchildren274 60.9% Not responsible for grandchildrenHispanic or Latino 60 18.9% Responsible for grandchildren256 81.1% Not responsible for grandchildren