Races in Menomonee Falls, Wisconsin (WI) Detailed Stats
Data:
Races - White alone (%)
Races - White alone (% change since 2000)
Races - Black alone (%)
Races - Black alone (% change since 2000)
Races - American Indian alone (%)
Races - American Indian alone (% change since 2000)
Races - Asian alone (%)
Races - Asian alone (% change since 2000)
Races - Hispanic (%)
Races - Hispanic (% change since 2000)
Races - Native Hawaiian and Other Pacific Islander alone (%)
Races - Native Hawaiian and Other Pacific Islander alone (% change since 2000)
Races - Two or more races(%)
Races - Two or more races(% change since 2000)
Races - Other race alone (%)
Races - Other race alone (% change since 2000)
Racial diversity
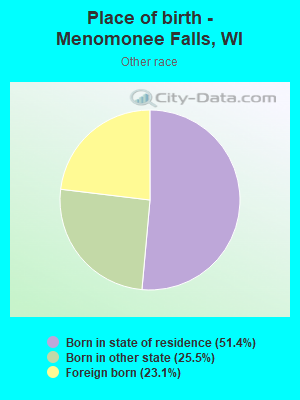
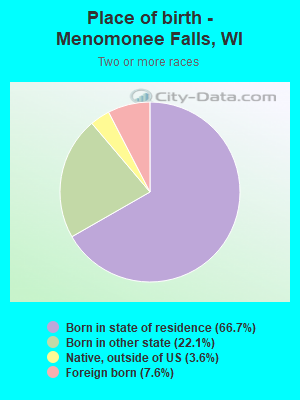
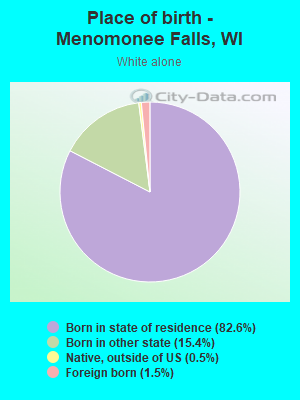
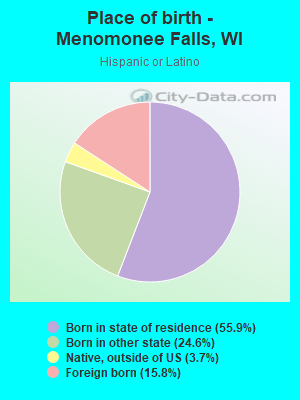
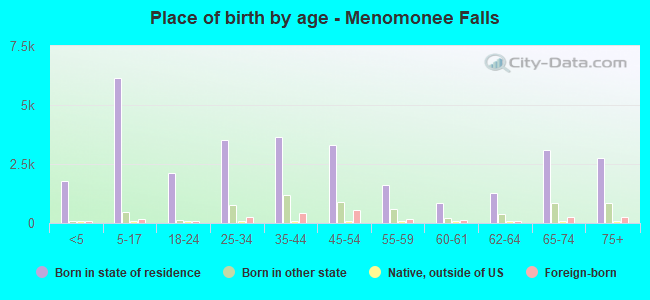
Place of birth - Born in state of residence (%)
Place of birth - Born in state of residence (%) - White
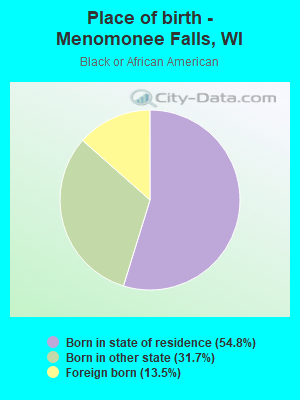
Place of birth - Born in state of residence (%) - Black or African American
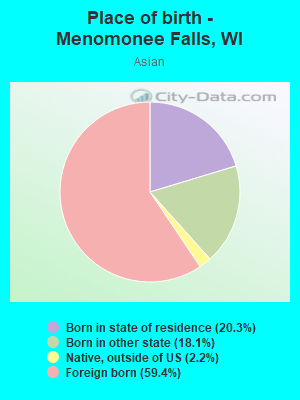
Place of birth - Born in state of residence (%) - Asian
Place of birth - Born in state of residence (%) - Hispanic or Latino
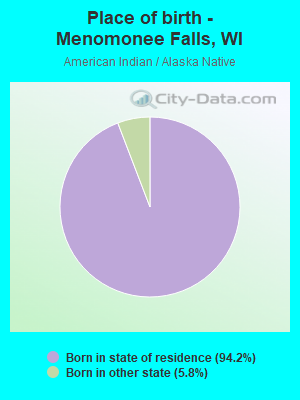
Place of birth - Born in state of residence (%) - American Indian and Alaska Native
Place of birth - Born in state of residence (%) - Multirace
Place of birth - Born in state of residence (%) - Other Race
Place of birth - Born in other state (%)
Place of birth - Born in other state (%) - White
Place of birth - Born in other state (%) - Black or African American
Place of birth - Born in other state (%) - Asian
Place of birth - Born in other state (%) - Hispanic or Latino
Place of birth - Born in other state (%) - American Indian and Alaska Native
Place of birth - Born in other state (%) - Multirace
Place of birth - Born in other state (%) - Other Race
Place of birth - Native, outside of US (%)
Place of birth - Native, outside of US (%) - White
Place of birth - Native, outside of US (%) - Black or African American
Place of birth - Native, outside of US (%) - Asian
Place of birth - Native, outside of US (%) - Hispanic or Latino
Place of birth - Native, outside of US (%) - American Indian and Alaska Native
Place of birth - Native, outside of US (%) - Multirace
Place of birth - Native, outside of US (%) - Other Race
Place of birth - Foreign born (%)
Place of birth - Foreign born (%) - White
Place of birth - Foreign born (%) - Black or African American
Place of birth - Foreign born (%) - Asian
Place of birth - Foreign born (%) - Hispanic or Latino
Place of birth - Foreign born (%) - American Indian and Alaska Native
Place of birth - Foreign born (%) - Multirace
Place of birth - Foreign born (%) - Other Race
Residents speaking English at home (%)
Residents speaking English at home - Born in the United States (%)
Residents speaking English at home - Native, born elsewhere (%)
Residents speaking English at home - Foreign born (%)
Residents speaking Spanish at home (%)
Residents speaking Spanish at home - Born in the United States (%)
Residents speaking Spanish at home - Native, born elsewhere (%)
Residents speaking Spanish at home - Foreign born (%)
Residents speaking other language at home (%)
Residents speaking other language at home - Born in the United States (%)
Residents speaking other language at home - Native, born elsewhere (%)
Residents speaking other language at home - Foreign born (%)
Marital status - Never married (%)
Marital status - Now married (%)
Marital status - Separated (%)
Marital status - Widowed (%)
Marital status - Divorced (%)
Ancestries Reported - Arab (%)
Ancestries Reported - Czech (%)
Ancestries Reported - Danish (%)
Ancestries Reported - Dutch (%)
Ancestries Reported - English (%)
Ancestries Reported - French (%)
Ancestries Reported - French Canadian (%)
Ancestries Reported - German (%)
Ancestries Reported - Greek (%)
Ancestries Reported - Hungarian (%)
Ancestries Reported - Irish (%)
Ancestries Reported - Italian (%)
Ancestries Reported - Lithuanian (%)
Ancestries Reported - Norwegian (%)
Ancestries Reported - Polish (%)
Ancestries Reported - Portuguese (%)
Ancestries Reported - Russian (%)
Ancestries Reported - Scotch-Irish (%)
Ancestries Reported - Scottish (%)
Ancestries Reported - Slovak (%)
Ancestries Reported - Subsaharan African (%)
Ancestries Reported - Swedish (%)
Ancestries Reported - Swiss (%)
Ancestries Reported - Ukrainian (%)
Ancestries Reported - United States (%)
Ancestries Reported - Welsh (%)
Ancestries Reported - West Indian (%)
Ancestries Reported - Other (%)
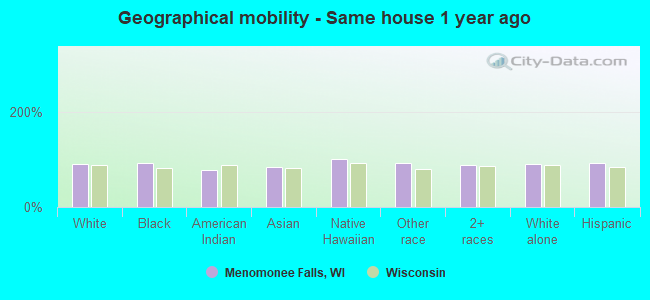
Geographical mobility - Same house 1 year ago (%)
Geographical mobility - Same house 1 year ago (%) - White
Geographical mobility - Same house 1 year ago (%) - Black or African American
Geographical mobility - Same house 1 year ago (%) - Asian
Geographical mobility - Same house 1 year ago (%) - Hispanic or Latino
Geographical mobility - Same house 1 year ago (%) - American Indian and Alaska Native
Geographical mobility - Same house 1 year ago (%) - Multirace
Geographical mobility - Same house 1 year ago (%) - Other Race
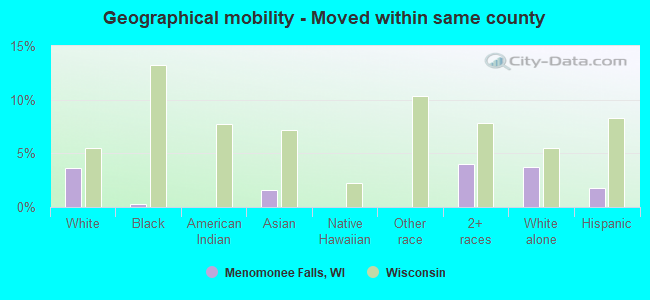
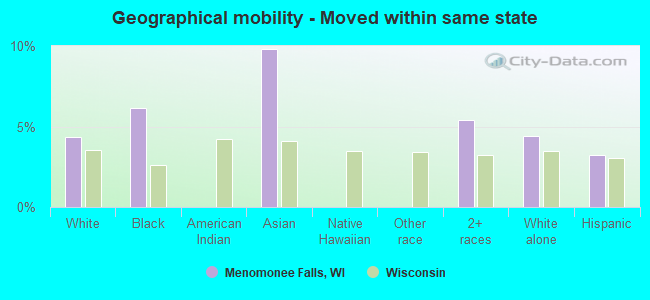
Geographical mobility - Moved within same county (%)
Geographical mobility - Moved within same county (%) - White
Geographical mobility - Moved within same county (%) - Black or African American
Geographical mobility - Moved within same county (%) - Asian
Geographical mobility - Moved within same county (%) - Hispanic or Latino
Geographical mobility - Moved within same county (%) - American Indian and Alaska Native
Geographical mobility - Moved within same county (%) - Multirace
Geographical mobility - Moved within same county (%) - Other Race
Geographical mobility - Moved from different county within same state (%)
Geographical mobility - Moved from different county within same state (%) - White
Geographical mobility - Moved from different county within same state (%) - Black or African American
Geographical mobility - Moved from different county within same state (%) - Asian
Geographical mobility - Moved from different county within same state (%) - Hispanic or Latino
Geographical mobility - Moved from different county within same state (%) - American Indian and Alaska Native
Geographical mobility - Moved from different county within same state (%) - Multirace
Geographical mobility - Moved from different county within same state (%) - Other Race
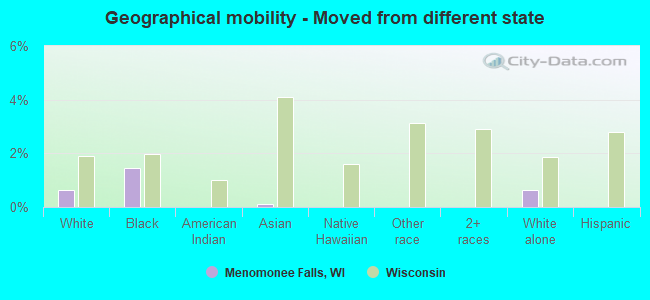
Geographical mobility - Moved from different state (%)
Geographical mobility - Moved from different state (%) - White
Geographical mobility - Moved from different state (%) - Black or African American
Geographical mobility - Moved from different state (%) - Asian
Geographical mobility - Moved from different state (%) - Hispanic or Latino
Geographical mobility - Moved from different state (%) - American Indian and Alaska Native
Geographical mobility - Moved from different state (%) - Multirace
Geographical mobility - Moved from different state (%) - Other Race
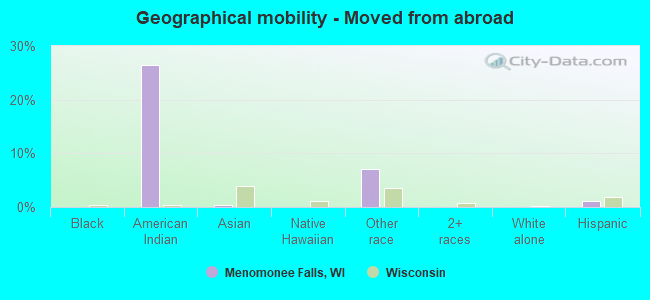
Geographical mobility - Moved from abroad (%)
Geographical mobility - Moved from abroad (%) - White
Geographical mobility - Moved from abroad (%) - Black or African American
Geographical mobility - Moved from abroad (%) - Asian
Geographical mobility - Moved from abroad (%) - Hispanic or Latino
Geographical mobility - Moved from abroad (%) - American Indian and Alaska Native
Geographical mobility - Moved from abroad (%) - Multirace
Geographical mobility - Moved from abroad (%) - Other Race
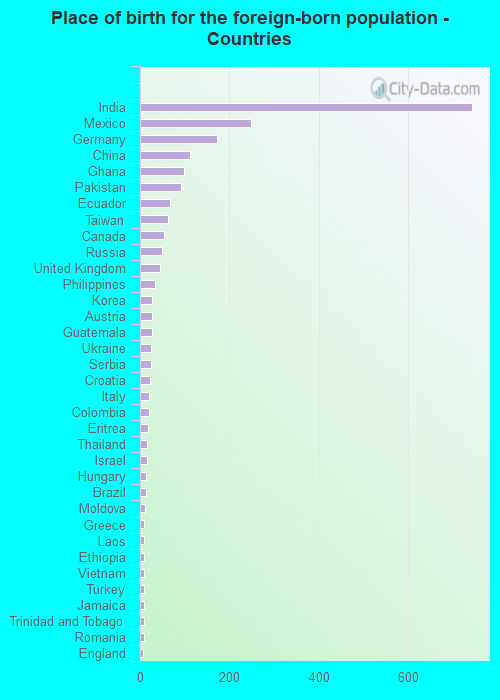
Place of birth for the foreign-born population - Ireland (%)
Place of birth for the foreign-born population - Denmark (%)
Place of birth for the foreign-born population - Norway (%)
Place of birth for the foreign-born population - Sweden (%)
Place of birth for the foreign-born population - United Kingdom (%)
Place of birth for the foreign-born population - England (%)
Place of birth for the foreign-born population - Scotland (%)
Place of birth for the foreign-born population - Other Northern Europe (%)
Place of birth for the foreign-born population - Austria (%)
Place of birth for the foreign-born population - Belgium (%)
Place of birth for the foreign-born population - France (%)
Place of birth for the foreign-born population - Germany (%)
Place of birth for the foreign-born population - Netherlands (%)
Place of birth for the foreign-born population - Switzerland (%)
Place of birth for the foreign-born population - Other Western Europe (%)
Place of birth for the foreign-born population - Greece (%)
Place of birth for the foreign-born population - Italy (%)
Place of birth for the foreign-born population - Portugal (%)
Place of birth for the foreign-born population - Spain (%)
Place of birth for the foreign-born population - Other Southern Europe (%)
Place of birth for the foreign-born population - Albania (%)
Place of birth for the foreign-born population - Belarus (%)
Place of birth for the foreign-born population - Bosnia and Herzegovina (%)
Place of birth for the foreign-born population - Bulgaria (%)
Place of birth for the foreign-born population - Croatia (%)
Place of birth for the foreign-born population - Czechoslovakia (%)
Place of birth for the foreign-born population - Hungary (%)
Place of birth for the foreign-born population - Latvia (%)
Place of birth for the foreign-born population - Lithuania (%)
Place of birth for the foreign-born population - North Macedonia (Macedonia) (%)
Place of birth for the foreign-born population - Moldova (%)
Place of birth for the foreign-born population - Poland (%)
Place of birth for the foreign-born population - Romania (%)
Place of birth for the foreign-born population - Russia (%)
Place of birth for the foreign-born population - Serbia (%)
Place of birth for the foreign-born population - Ukraine (%)
Place of birth for the foreign-born population - Other Eastern Europe (%)
Place of birth for the foreign-born population - China (%)
Place of birth for the foreign-born population - Hong Kong (%)
Place of birth for the foreign-born population - Taiwan (%)
Place of birth for the foreign-born population - Japan (%)
Place of birth for the foreign-born population - Korea (%)
Place of birth for the foreign-born population - Other Eastern Asia (%)
Place of birth for the foreign-born population - Afghanistan (%)
Place of birth for the foreign-born population - Bangladesh (%)
Place of birth for the foreign-born population - India (%)
Place of birth for the foreign-born population - Iran (%)
Place of birth for the foreign-born population - Kazakhstan (%)
Place of birth for the foreign-born population - Nepal (%)
Place of birth for the foreign-born population - Pakistan (%)
Place of birth for the foreign-born population - Sri Lanka (%)
Place of birth for the foreign-born population - Uzbekistan (%)
Place of birth for the foreign-born population - Other South Central Asia (%)
Place of birth for the foreign-born population - Burma (%)
Place of birth for the foreign-born population - Cambodia (%)
Place of birth for the foreign-born population - Indonesia (%)
Place of birth for the foreign-born population - Laos (%)
Place of birth for the foreign-born population - Malaysia (%)
Place of birth for the foreign-born population - Philippines (%)
Place of birth for the foreign-born population - Singapore (%)
Place of birth for the foreign-born population - Thailand (%)
Place of birth for the foreign-born population - Vietnam (%)
Place of birth for the foreign-born population - Other South Eastern Asia (%)
Place of birth for the foreign-born population - Armenia (%)
Place of birth for the foreign-born population - Iraq (%)
Place of birth for the foreign-born population - Israel (%)
Place of birth for the foreign-born population - Jordan (%)
Place of birth for the foreign-born population - Kuwait (%)
Place of birth for the foreign-born population - Lebanon (%)
Place of birth for the foreign-born population - Saudi Arabia (%)
Place of birth for the foreign-born population - Syria (%)
Place of birth for the foreign-born population - Turkey (%)
Place of birth for the foreign-born population - Yemen (%)
Place of birth for the foreign-born population - Other Western Asia (%)
Place of birth for the foreign-born population - Eritrea (%)
Place of birth for the foreign-born population - Ethiopia (%)
Place of birth for the foreign-born population - Kenya (%)
Place of birth for the foreign-born population - Somalia (%)
Place of birth for the foreign-born population - Uganda (%)
Place of birth for the foreign-born population - Zimbabwe (%)
Place of birth for the foreign-born population - Other Eastern Africa (%)
Place of birth for the foreign-born population - Cameroon (%)
Place of birth for the foreign-born population - Congo (%)
Place of birth for the foreign-born population - Democratic Republic of Congo (Zaire) (%)
Place of birth for the foreign-born population - Other Middle Africa (%)
Place of birth for the foreign-born population - Egypt (%)
Place of birth for the foreign-born population - Morocco (%)
Place of birth for the foreign-born population - Sudan (%)
Place of birth for the foreign-born population - Other Northern Africa (%)
Place of birth for the foreign-born population - South Africa (%)
Place of birth for the foreign-born population - Other Southern Africa (%)
Place of birth for the foreign-born population - Cabo Verde (%)
Place of birth for the foreign-born population - Ghana (%)
Place of birth for the foreign-born population - Liberia (%)
Place of birth for the foreign-born population - Nigeria (%)
Place of birth for the foreign-born population - Senegal (%)
Place of birth for the foreign-born population - Sierra Leone (%)
Place of birth for the foreign-born population - Other Western Africa (%)
Place of birth for the foreign-born population - Australia (%)
Place of birth for the foreign-born population - New Zealand (%)
Place of birth for the foreign-born population - Fiji (%)
Place of birth for the foreign-born population - Micronesia (%)
Place of birth for the foreign-born population - Bahamas (%)
Place of birth for the foreign-born population - Barbados (%)
Place of birth for the foreign-born population - Cuba (%)
Place of birth for the foreign-born population - Dominica (%)
Place of birth for the foreign-born population - Dominican Republic (%)
Place of birth for the foreign-born population - Grenada (%)
Place of birth for the foreign-born population - Haiti (%)
Place of birth for the foreign-born population - Jamaica (%)
Place of birth for the foreign-born population - St. Vincent and the Grenadines (%)
Place of birth for the foreign-born population - Trinidad and Tobago (%)
Place of birth for the foreign-born population - West Indies (%)
Place of birth for the foreign-born population - Other Caribbean (%)
Place of birth for the foreign-born population - Belize (%)
Place of birth for the foreign-born population - Costa Rica (%)
Place of birth for the foreign-born population - El Salvador (%)
Place of birth for the foreign-born population - Guatemala (%)
Place of birth for the foreign-born population - Honduras (%)
Place of birth for the foreign-born population - Mexico (%)
Place of birth for the foreign-born population - Nicaragua (%)
Place of birth for the foreign-born population - Panama (%)
Place of birth for the foreign-born population - Other Central America (%)
Place of birth for the foreign-born population - Argentina (%)
Place of birth for the foreign-born population - Bolivia (%)
Place of birth for the foreign-born population - Brazil (%)
Place of birth for the foreign-born population - Chile (%)
Place of birth for the foreign-born population - Colombia (%)
Place of birth for the foreign-born population - Ecuador (%)
Place of birth for the foreign-born population - Guyana (%)
Place of birth for the foreign-born population - Peru (%)
Place of birth for the foreign-born population - Uruguay (%)
Place of birth for the foreign-born population - Venezuela (%)
Place of birth for the foreign-born population - Other South America (%)
Place of birth for the foreign-born population - Canada (%)
Place of birth for the foreign-born population - Other Northern America (%)
Place of birth for the foreign-born population - Other (%)
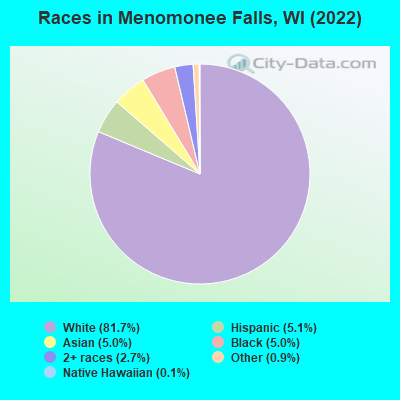
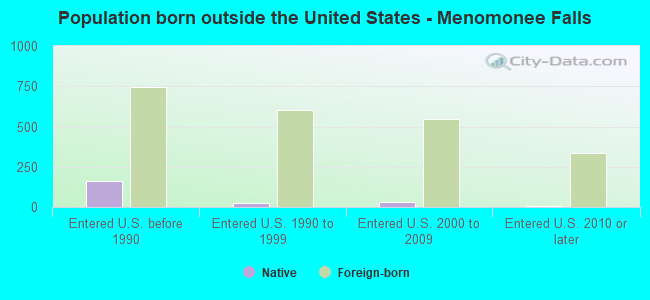
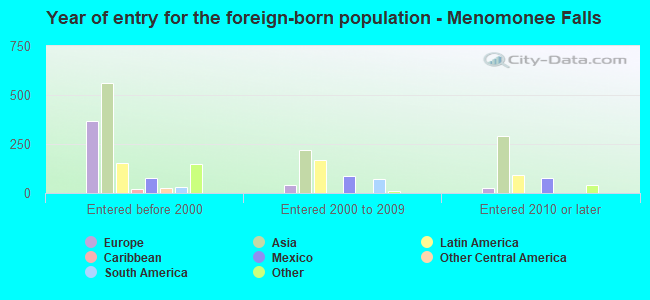
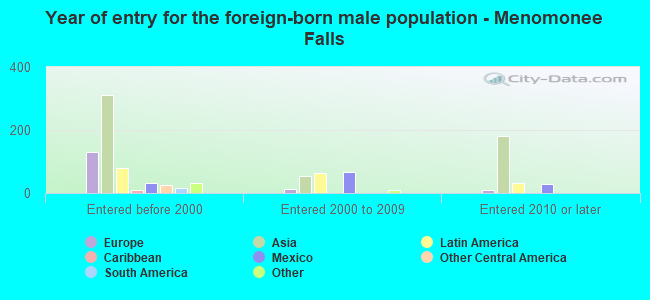
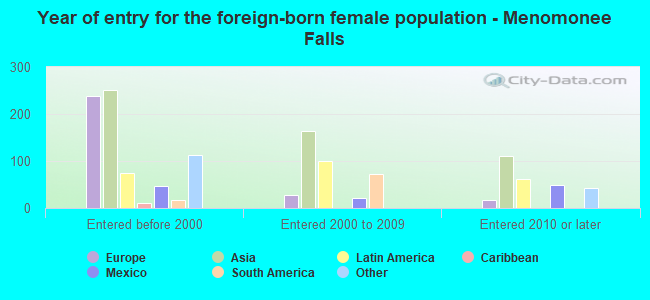
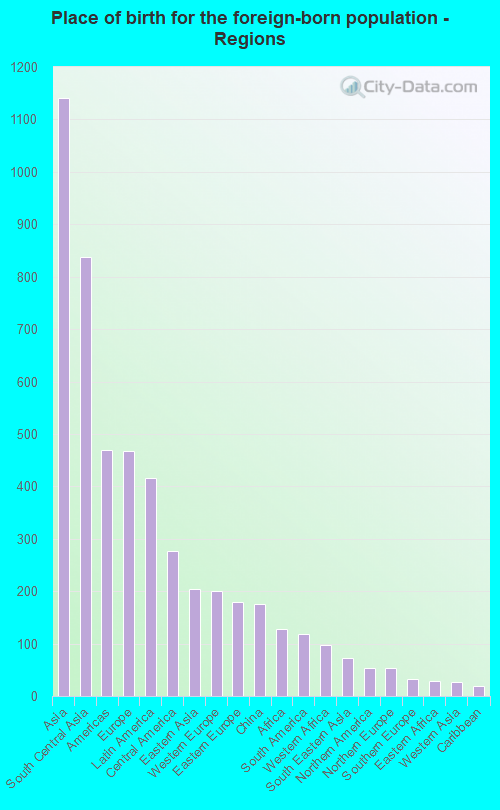
According to 2022 data, the most numerous races in Menomonee Falls, WI are White alone (31,800 residents), Hispanic (1,990 residents), and Black alone (1,943 residents). 92.2% of Menomonee Falls residents speak English at home. 5.7% of Menomonee Falls, WI residents are foreign-born (3.0% born in Asia, 1.2% born in Europe, 1.1% born in Latin America), which is 11.8% greater than the foreign-born rate of 5.0% across the entire state of Wisconsin.
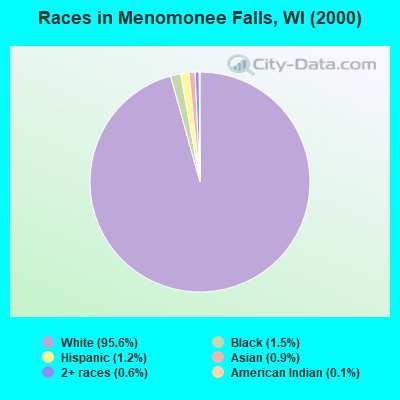
Race distribution in Menomonee Falls
2000 2022
4,681,630 87.3% White alone 300,245 5.6% Black alone 192,921 3.6% Hispanic 87,995 1.6% Asian alone 51,921 1.0% Two or more races 43,980 0.8% American Indian alone 3,637 0.07% Other race alone 1,346 0.03% Native Hawaiian and Other
4,654,031 79.0% White alone 447,022 7.6% Hispanic 345,678 5.9% Black alone 217,532 3.7% Two or more races 172,242 2.9% Asian alone 33,762 0.6% American Indian alone 19,680 0.3% Other race alone 2,592 0.04% Native Hawaiian and Other
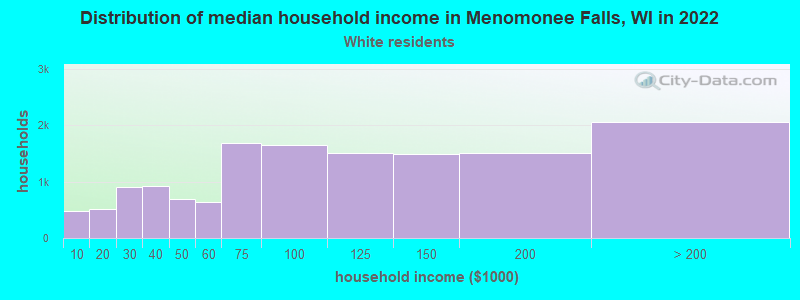
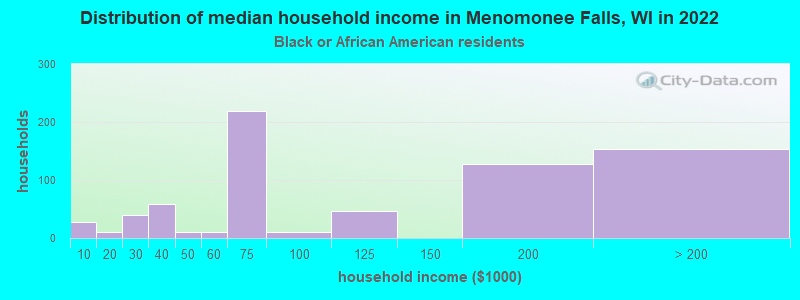
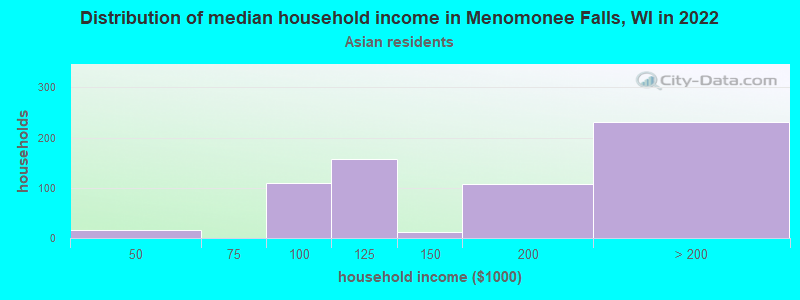
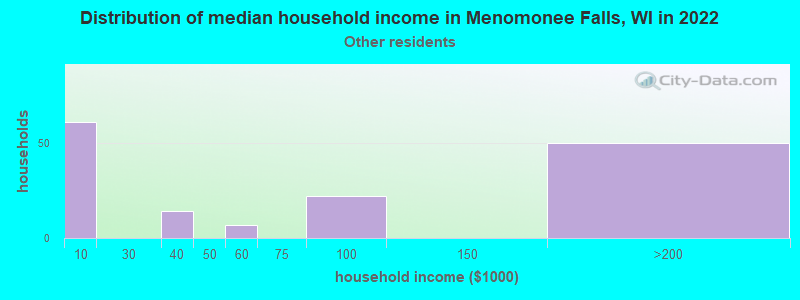
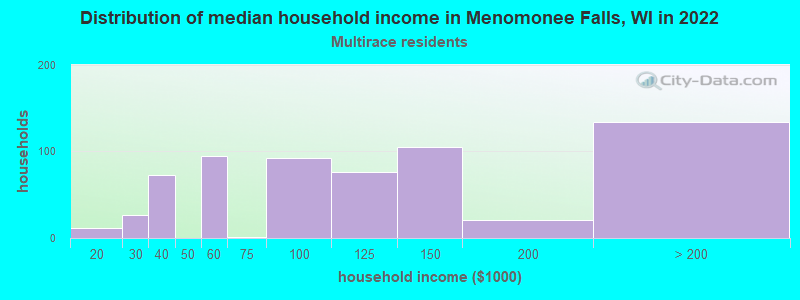
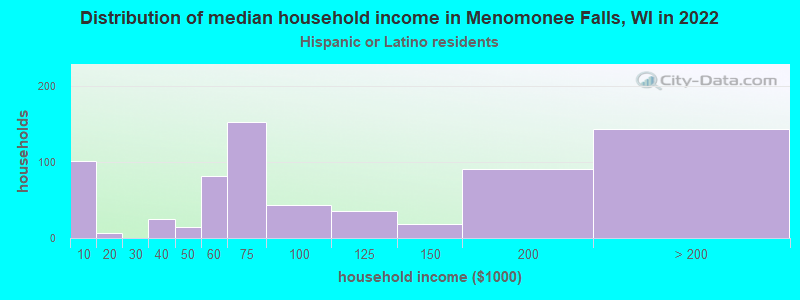
Income and house value in Menomonee Falls Median household income in 2022 $91,411 White non-Hispanic householders$59,201 Black householders$178,179 Asian householders$101,405 Two or more races householders$57,519 Hispanic or Latino race householdersMedian 2022 house value $336,410 White Non-Hispanic householders$586,824 Black or African American householders$266,454 American Indian or Alaska Native householders $473,425 Asian householders$220,114 Some other race householders$348,218 Two or more races householders$372,056 Hispanic or Latino householders
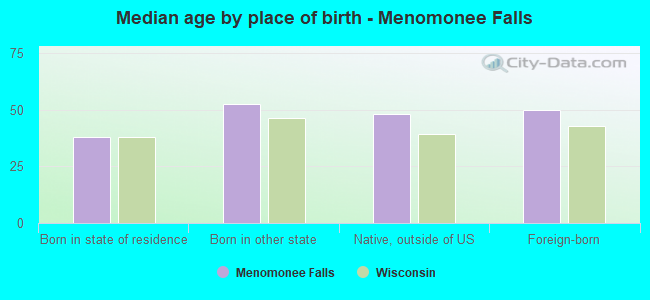
Median age by race in Menomonee Falls
44.0 Median age for White residents43.3 45.2 39.9 Median age for Black or African American residents39.3 39.7 50.6 Median age for American Indian / Alaska Native residents105.0 14.4 36.7 Median age for Asian residents35.0 39.9 -825,688,072.6 Median age for Native Hawaiian / Pacific Islander residents-862,745,097.2 -666,666,666.0 17.6 Median age for Other race residents19.0 14.9 30.9 Median age for Two or more races residents22.1 41.5 44.2 Median age for White alone residents43.3 45.9 35.5 Median age for Hispanic or Latino residents31.0 43.1
Owner/renter occupied households by race in Menomonee Falls
House owners and renters - White residents 10,907 77.6% Owner occupied3,156 22.4% Renter occupiedHouse owners and renters - Black or African American residents 422 50.1% Owner occupied420 49.9% Renter occupiedHouse owners and renters - American Indian / Alaska Native residents 9 100.0% Owner occupiedHouse owners and renters - Asian residents 513 86.6% Owner occupied79 13.4% Renter occupiedHouse owners and renters - Native Hawaiian / Pacific Islander residents 71 100.0% Renter occupiedHouse owners and renters - Other race residents 121 42.0% Owner occupied167 58.0% Renter occupiedHouse owners and renters - Two or more races residents 401 52.1% Owner occupied369 47.9% Renter occupiedHouse owners and renters - White alone residents 10,675 77.2% Owner occupied3,161 22.8% Renter occupiedHouse owners and renters - Hispanic or Latino residents 427 59.9% Owner occupied286 40.1% Renter occupied
Language usage in Menomonee Falls
English speakers - Total 92.2% of residents of Menomonee Falls speak English at home.
2.1% of residents speak Spanish at home 584 74.8% Speak English very well197 25.2% Speak English less than very well5.7% of residents speak other language at home 1,765 83.6% Speak English very well346 16.4% Speak English less than very well
English speakers - Born in the United States 93.9% of residents of Menomonee Falls speak English at home.
3.6% of residents speak Spanish at home 221 96.5% Speak English very well8 3.5% Speak English less than very well3.5% of residents speak other language at home 136 62.4% Speak English very well82 37.6% Speak English less than very well
English speakers - Native, born elsewhere 77.1% of residents of Menomonee Falls speak English at home.
28.9% of residents speak Spanish at home 30 51.7% Speak English very well28 48.3% Speak English less than very well
English speakers - Foreign-born 27.2% of residents of Menomonee Falls speak English at home.
9.7% of residents speak Spanish at home 87 40.8% Speak English very well126 59.2% Speak English less than very well63.9% of residents speak other language at home 1,166 83.0% Speak English very well239 17.0% Speak English less than very well
White (Caucasian) - Speak only English Native:
98.2% (29,800)Foreign-born:
40.4% (207)
White (Caucasian) - Speak another language Native:
1.8% (538)Foreign-born:
58.8% (301)
Black or African American - Speak only English Native:
100.0% (1,356)Foreign-born:
22.8% (41)
Asian - Speak only English Native:
40.1% (283)Foreign-born:
18.7% (222)
Asian - Speak another language Native:
56.4% (398)Foreign-born:
81.1% (963)
Other race - Speak another language Native:
28.3% (185)Foreign-born:
97.7% (253)
Two or more races - Speak only English Native:
88.5% (1,446)Foreign-born:
86.4% (121)
Two or more races - Speak another language Native:
11.1% (182)Foreign-born:
40.8% (57)
White alone - Speak only English Native:
98.7% (29,355)Foreign-born:
35.5% (174)
White alone - Speak another language Native:
1.1% (337)Foreign-born:
64.2% (315)
Hispanic or Latino - Speak only English Native:
64.8% (1,010)Foreign-born:
33.6% (109)
Hispanic or Latino - Speak another language Native:
32.0% (499)Foreign-born:
66.2% (215)
Foreign-born residents in Menomonee Falls 2,206 residents are foreign born (3.0% Asia , 1.2% Europe , 1.1% Latin America ).
This city:
5.7%Wisconsin:
5.0%
Marital status for residents in Menomonee Falls Marital status - White (Caucasian) population 15 years and over
Males 25.4% Never married62.6% Now married0.4% Separated3.9% Widowed7.7% DivorcedFemales 23.1% Never married54.1% Now married0.6% Separated13.7% Widowed8.6% DivorcedWomen who gave birth in the past 12 months Now married:
100.0% (265)Unmarried:
0.0% (0)
Women who did not give birth in the past 12 months Now married:
52.0% (3,314)Unmarried:
48.0% (3,059)
Marital status - Black or African American population 15 years and over
Males 28.5% Never married64.1% Now married0.0% Separated0.0% Widowed7.4% DivorcedFemales 28.8% Never married40.2% Now married2.1% Separated12.7% Widowed16.1% DivorcedWomen who did not give birth in the past 12 months Now married:
40.3% (150)Unmarried:
59.7% (223)
Marital status - American Indian / Alaska Native population 15 years and over
Males 70.0% Never married30.0% Now married0.0% Separated0.0% Widowed0.0% DivorcedFemales 0.0% Never married0.0% Now married0.0% Separated63.2% Widowed36.8% DivorcedWomen who did not give birth in the past 12 months Now married:
0.0% (0)Unmarried:
100.0% (7)
Marital status - Asian population 15 years and over
Males 30.6% Never married67.5% Now married0.0% Separated0.0% Widowed1.9% DivorcedFemales 24.6% Never married73.7% Now married0.0% Separated1.8% Widowed0.0% DivorcedWomen who gave birth in the past 12 months Now married:
100.0% (19)Unmarried:
0.0% (0)
Women who did not give birth in the past 12 months Now married:
61.3% (310)Unmarried:
38.7% (196)
Marital status - Other race population 15 years and over
Males 51.3% Never married42.2% Now married0.0% Separated0.0% Widowed6.5% DivorcedFemales 31.3% Never married36.5% Now married0.0% Separated32.2% Widowed0.0% DivorcedWomen who did not give birth in the past 12 months Now married:
53.8% (70)Unmarried:
46.2% (60)
Marital status - Two or more races population 15 years and over
Males 45.5% Never married44.6% Now married7.3% Separated0.0% Widowed2.7% DivorcedFemales 18.2% Never married50.2% Now married3.5% Separated0.8% Widowed27.2% DivorcedWomen who gave birth in the past 12 months Now married:
100.0% (63)Unmarried:
0.0% (0)
Women who did not give birth in the past 12 months Now married:
33.9% (158)Unmarried:
66.1% (308)
Marital status - White alone, not Hispanic / Latino population 15 years and over
Males 25.6% Never married62.6% Now married0.4% Separated3.8% Widowed7.6% DivorcedFemales 22.8% Never married54.4% Now married0.5% Separated13.7% Widowed8.5% DivorcedWomen who gave birth in the past 12 months Now married:
100.0% (270)Unmarried:
0.0% (0)
Women who did not give birth in the past 12 months Now married:
52.3% (3,300)Unmarried:
47.7% (3,008)
Marital status - Hispanic or Latino population 15 years and over
Males 25.6% Never married62.2% Now married0.0% Separated3.9% Widowed8.3% DivorcedFemales 25.7% Never married53.4% Now married4.1% Separated12.9% Widowed3.9% DivorcedWomen who gave birth in the past 12 months Now married:
100.0% (48)Unmarried:
0.0% (0)
Women who did not give birth in the past 12 months Now married:
51.5% (218)Unmarried:
48.5% (206)
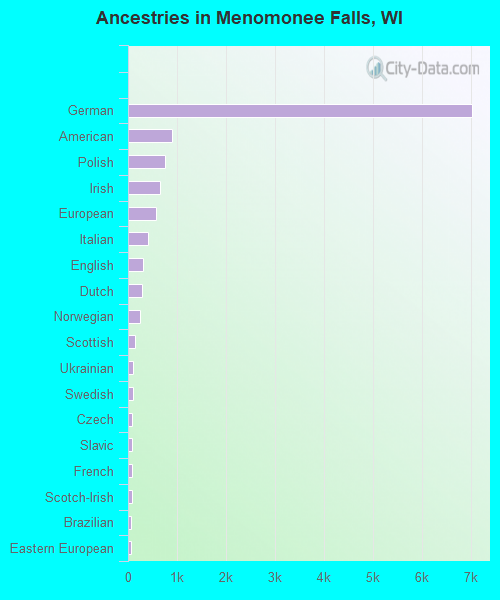
Ancestries in Menomonee Falls
7,021 40.8% German893 5.2% American763 4.4% Polish663 3.9% Irish582 3.4% European415 2.4% Italian306 1.8% English277 1.6% Dutch249 1.4% Norwegian153 0.9% Scottish101 0.6% Ukrainian97 0.6% Swedish88 0.5% Czech80 0.5% Slavic80 0.5% French79 0.5% Scotch-Irish66 0.4% Brazilian64 0.4% Eastern European61 0.4% French Canadian57 0.3% Finnish56 0.3% Scandinavian53 0.3% Croatian44 0.3% Russian40 0.2% Ethiopian39 0.2% Greek30 0.2% Danish27 0.2% Austrian18 0.1% Swiss17 0.10% Slovak17 0.10% Palestinian16 0.09% Northern European15 0.09% Turkish13 0.08% Slovene12 0.07% Luxembourger12 0.07% Serbian12 0.07% Yugoslavian11 0.06% Jamaican10 0.06% Trinidadian and Tobagonian9 0.05% Hungarian9 0.05% Romanian9 0.05% British9 0.05% African9 0.05% Armenian8 0.05% Ghanaian4 0.02% Czechoslovakian
Geographical mobility in Menomonee Falls Same house 1 year ago 29,081 90.3% White (Caucasian)1,420 91.9% Black or African American41 78.0% American Indian / Alaska Native1,612 83.1% Asian47 100.0% Native Hawaiian / Pacific Islander581 92.7% Other race1,582 88.8% Two or more races28,461 90.2% White alone, not Hispanic / Latino1,803 91.5% Hispanic or LatinoMoved within same county 1,162 3.6% White / Caucasian4 0.3% Black or African American31 1.6% Asian71 4.0% Two or more races1,165 3.7% White alone, not Hispanic / Latino35 1.8% Hispanic or LatinoMoved within same state 1,402 4.4% White / Caucasian95 6.1% Black or African American190 9.8% Asian96 5.4% Two or more races1,393 4.4% White alone, not Hispanic / Latino64 3.2% Hispanic or LatinoMoved from different state 199 0.6% White / Caucasian22 1.4% Black or African American2 0.1% Asian201 0.6% White alone, not Hispanic / LatinoMoved from abroad 20 0.1% White14 26.4% American Indian / Alaska Native5 0.3% Asian44 7.0% Other race16 0.0% White alone, not Hispanic / Latino22 1.1% Hispanic or Latino
Children Nativity (place of birth) in Menomonee Falls
Children under 6 years - Living with two parents Both parents native 1,989 100.0% NativeBoth parents foreign-born 102 100.0% NativeOne native, one foreign-born parent 85 100.0% NativeChildren under 6 years - Living with one parent Native parent 157 100.0% NativeForeign-born parent 14 100.0% NativeChildren 6 to 17 years - Living with two parents Both parents native 4,271 99.8% Native8 0.2% Foreign-bornBoth parents foreign-born 251 62.2% Native153 37.8% Foreign-bornOne native, one foreign-born parent 160 100.0% NativeChildren 6 to 17 years - Living with one parent Native parent 1,316 100.0% NativeForeign-born parent 34 50.5% Native33 49.5% Foreign-born
Grandparents responsible for own grandchildren in Menomonee Falls
Grandparents (30 to 59 years) White / Caucasian 27 31.0% Responsible for grandchildren61 69.0% Not responsible for grandchildrenAsian 10 100.0% Not responsible for grandchildrenWhite alone, not Hispanic / Latino 29 31.6% Responsible for grandchildren62 68.4% Not responsible for grandchildren
Grandparents (60 years and over) White / Caucasian 1 0.3% Responsible for grandchildren233 99.7% Not responsible for grandchildrenAsian 16 100.0% Not responsible for grandchildrenWhite alone, not Hispanic / Latino 1 0.3% Responsible for grandchildren239 99.7% Not responsible for grandchildren