Races in Memphis, Tennessee (TN) Detailed Stats
Data:
Races - White alone (%)
Races - White alone (% change since 2000)
Races - Black alone (%)
Races - Black alone (% change since 2000)
Races - American Indian alone (%)
Races - American Indian alone (% change since 2000)
Races - Asian alone (%)
Races - Asian alone (% change since 2000)
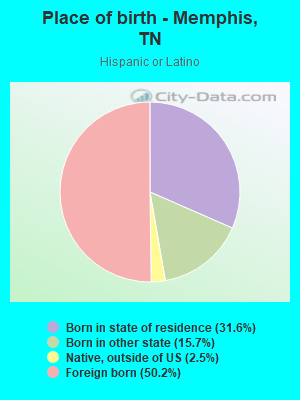
Races - Hispanic (%)
Races - Hispanic (% change since 2000)
Races - Native Hawaiian and Other Pacific Islander alone (%)
Races - Native Hawaiian and Other Pacific Islander alone (% change since 2000)
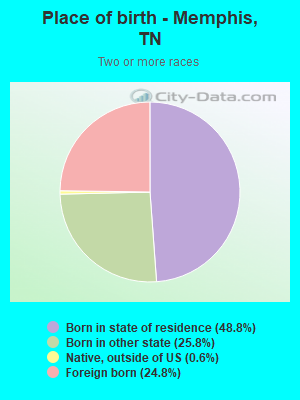
Races - Two or more races(%)
Races - Two or more races(% change since 2000)
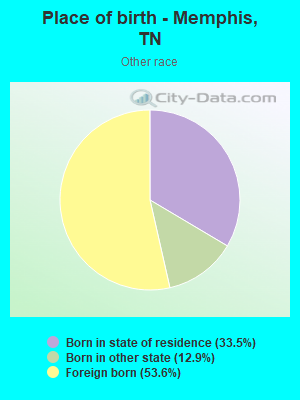
Races - Other race alone (%)
Races - Other race alone (% change since 2000)
Racial diversity
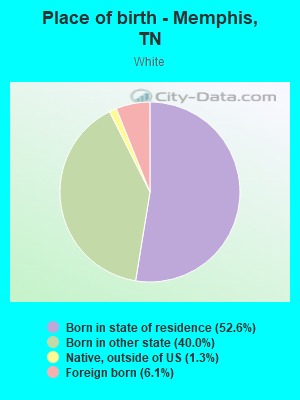
Place of birth - Born in state of residence (%)
Place of birth - Born in state of residence (%) - White
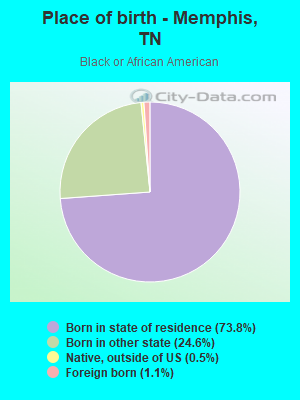
Place of birth - Born in state of residence (%) - Black or African American
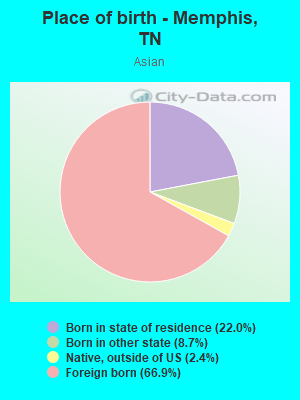
Place of birth - Born in state of residence (%) - Asian
Place of birth - Born in state of residence (%) - Hispanic or Latino
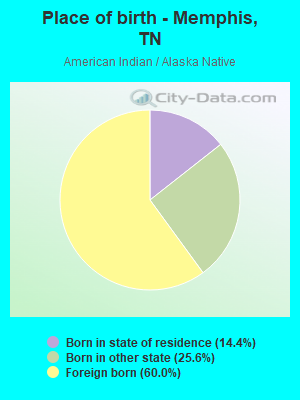
Place of birth - Born in state of residence (%) - American Indian and Alaska Native
Place of birth - Born in state of residence (%) - Multirace
Place of birth - Born in state of residence (%) - Other Race
Place of birth - Born in other state (%)
Place of birth - Born in other state (%) - White
Place of birth - Born in other state (%) - Black or African American
Place of birth - Born in other state (%) - Asian
Place of birth - Born in other state (%) - Hispanic or Latino
Place of birth - Born in other state (%) - American Indian and Alaska Native
Place of birth - Born in other state (%) - Multirace
Place of birth - Born in other state (%) - Other Race
Place of birth - Native, outside of US (%)
Place of birth - Native, outside of US (%) - White
Place of birth - Native, outside of US (%) - Black or African American
Place of birth - Native, outside of US (%) - Asian
Place of birth - Native, outside of US (%) - Hispanic or Latino
Place of birth - Native, outside of US (%) - American Indian and Alaska Native
Place of birth - Native, outside of US (%) - Multirace
Place of birth - Native, outside of US (%) - Other Race
Place of birth - Foreign born (%)
Place of birth - Foreign born (%) - White
Place of birth - Foreign born (%) - Black or African American
Place of birth - Foreign born (%) - Asian
Place of birth - Foreign born (%) - Hispanic or Latino
Place of birth - Foreign born (%) - American Indian and Alaska Native
Place of birth - Foreign born (%) - Multirace
Place of birth - Foreign born (%) - Other Race
Residents speaking English at home (%)
Residents speaking English at home - Born in the United States (%)
Residents speaking English at home - Native, born elsewhere (%)
Residents speaking English at home - Foreign born (%)
Residents speaking Spanish at home (%)
Residents speaking Spanish at home - Born in the United States (%)
Residents speaking Spanish at home - Native, born elsewhere (%)
Residents speaking Spanish at home - Foreign born (%)
Residents speaking other language at home (%)
Residents speaking other language at home - Born in the United States (%)
Residents speaking other language at home - Native, born elsewhere (%)
Residents speaking other language at home - Foreign born (%)
Marital status - Never married (%)
Marital status - Now married (%)
Marital status - Separated (%)
Marital status - Widowed (%)
Marital status - Divorced (%)
Ancestries Reported - Arab (%)
Ancestries Reported - Czech (%)
Ancestries Reported - Danish (%)
Ancestries Reported - Dutch (%)
Ancestries Reported - English (%)
Ancestries Reported - French (%)
Ancestries Reported - French Canadian (%)
Ancestries Reported - German (%)
Ancestries Reported - Greek (%)
Ancestries Reported - Hungarian (%)
Ancestries Reported - Irish (%)
Ancestries Reported - Italian (%)
Ancestries Reported - Lithuanian (%)
Ancestries Reported - Norwegian (%)
Ancestries Reported - Polish (%)
Ancestries Reported - Portuguese (%)
Ancestries Reported - Russian (%)
Ancestries Reported - Scotch-Irish (%)
Ancestries Reported - Scottish (%)
Ancestries Reported - Slovak (%)
Ancestries Reported - Subsaharan African (%)
Ancestries Reported - Swedish (%)
Ancestries Reported - Swiss (%)
Ancestries Reported - Ukrainian (%)
Ancestries Reported - United States (%)
Ancestries Reported - Welsh (%)
Ancestries Reported - West Indian (%)
Ancestries Reported - Other (%)
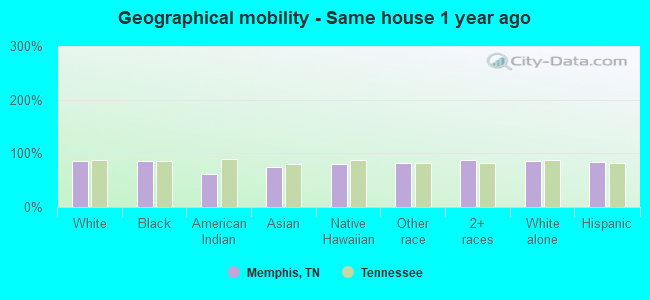
Geographical mobility - Same house 1 year ago (%)
Geographical mobility - Same house 1 year ago (%) - White
Geographical mobility - Same house 1 year ago (%) - Black or African American
Geographical mobility - Same house 1 year ago (%) - Asian
Geographical mobility - Same house 1 year ago (%) - Hispanic or Latino
Geographical mobility - Same house 1 year ago (%) - American Indian and Alaska Native
Geographical mobility - Same house 1 year ago (%) - Multirace
Geographical mobility - Same house 1 year ago (%) - Other Race
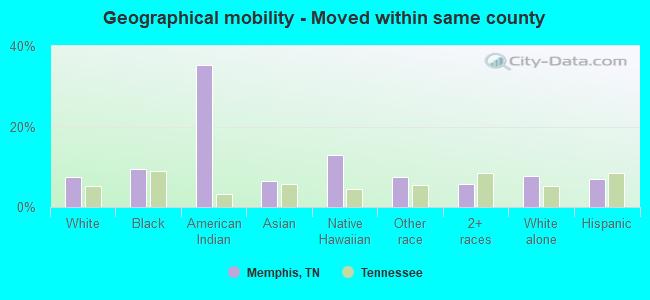
Geographical mobility - Moved within same county (%)
Geographical mobility - Moved within same county (%) - White
Geographical mobility - Moved within same county (%) - Black or African American
Geographical mobility - Moved within same county (%) - Asian
Geographical mobility - Moved within same county (%) - Hispanic or Latino
Geographical mobility - Moved within same county (%) - American Indian and Alaska Native
Geographical mobility - Moved within same county (%) - Multirace
Geographical mobility - Moved within same county (%) - Other Race
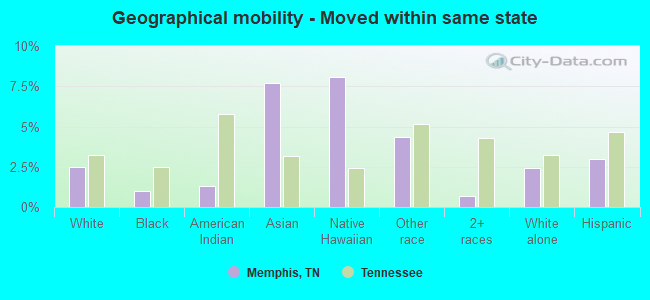
Geographical mobility - Moved from different county within same state (%)
Geographical mobility - Moved from different county within same state (%) - White
Geographical mobility - Moved from different county within same state (%) - Black or African American
Geographical mobility - Moved from different county within same state (%) - Asian
Geographical mobility - Moved from different county within same state (%) - Hispanic or Latino
Geographical mobility - Moved from different county within same state (%) - American Indian and Alaska Native
Geographical mobility - Moved from different county within same state (%) - Multirace
Geographical mobility - Moved from different county within same state (%) - Other Race
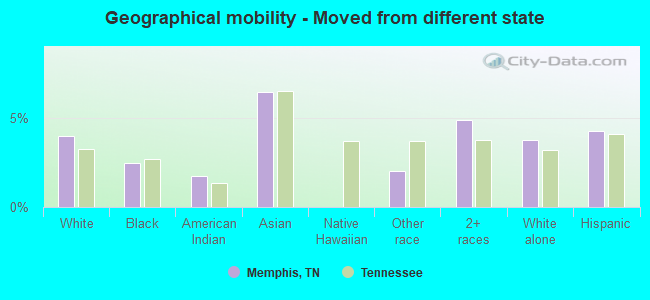
Geographical mobility - Moved from different state (%)
Geographical mobility - Moved from different state (%) - White
Geographical mobility - Moved from different state (%) - Black or African American
Geographical mobility - Moved from different state (%) - Asian
Geographical mobility - Moved from different state (%) - Hispanic or Latino
Geographical mobility - Moved from different state (%) - American Indian and Alaska Native
Geographical mobility - Moved from different state (%) - Multirace
Geographical mobility - Moved from different state (%) - Other Race
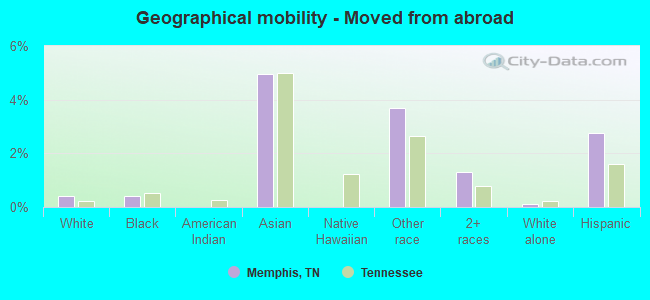
Geographical mobility - Moved from abroad (%)
Geographical mobility - Moved from abroad (%) - White
Geographical mobility - Moved from abroad (%) - Black or African American
Geographical mobility - Moved from abroad (%) - Asian
Geographical mobility - Moved from abroad (%) - Hispanic or Latino
Geographical mobility - Moved from abroad (%) - American Indian and Alaska Native
Geographical mobility - Moved from abroad (%) - Multirace
Geographical mobility - Moved from abroad (%) - Other Race
Place of birth for the foreign-born population - Ireland (%)
Place of birth for the foreign-born population - Denmark (%)
Place of birth for the foreign-born population - Norway (%)
Place of birth for the foreign-born population - Sweden (%)
Place of birth for the foreign-born population - United Kingdom (%)
Place of birth for the foreign-born population - England (%)
Place of birth for the foreign-born population - Scotland (%)
Place of birth for the foreign-born population - Other Northern Europe (%)
Place of birth for the foreign-born population - Austria (%)
Place of birth for the foreign-born population - Belgium (%)
Place of birth for the foreign-born population - France (%)
Place of birth for the foreign-born population - Germany (%)
Place of birth for the foreign-born population - Netherlands (%)
Place of birth for the foreign-born population - Switzerland (%)
Place of birth for the foreign-born population - Other Western Europe (%)
Place of birth for the foreign-born population - Greece (%)
Place of birth for the foreign-born population - Italy (%)
Place of birth for the foreign-born population - Portugal (%)
Place of birth for the foreign-born population - Spain (%)
Place of birth for the foreign-born population - Other Southern Europe (%)
Place of birth for the foreign-born population - Albania (%)
Place of birth for the foreign-born population - Belarus (%)
Place of birth for the foreign-born population - Bosnia and Herzegovina (%)
Place of birth for the foreign-born population - Bulgaria (%)
Place of birth for the foreign-born population - Croatia (%)
Place of birth for the foreign-born population - Czechoslovakia (%)
Place of birth for the foreign-born population - Hungary (%)
Place of birth for the foreign-born population - Latvia (%)
Place of birth for the foreign-born population - Lithuania (%)
Place of birth for the foreign-born population - North Macedonia (Macedonia) (%)
Place of birth for the foreign-born population - Moldova (%)
Place of birth for the foreign-born population - Poland (%)
Place of birth for the foreign-born population - Romania (%)
Place of birth for the foreign-born population - Russia (%)
Place of birth for the foreign-born population - Serbia (%)
Place of birth for the foreign-born population - Ukraine (%)
Place of birth for the foreign-born population - Other Eastern Europe (%)
Place of birth for the foreign-born population - China (%)
Place of birth for the foreign-born population - Hong Kong (%)
Place of birth for the foreign-born population - Taiwan (%)
Place of birth for the foreign-born population - Japan (%)
Place of birth for the foreign-born population - Korea (%)
Place of birth for the foreign-born population - Other Eastern Asia (%)
Place of birth for the foreign-born population - Afghanistan (%)
Place of birth for the foreign-born population - Bangladesh (%)
Place of birth for the foreign-born population - India (%)
Place of birth for the foreign-born population - Iran (%)
Place of birth for the foreign-born population - Kazakhstan (%)
Place of birth for the foreign-born population - Nepal (%)
Place of birth for the foreign-born population - Pakistan (%)
Place of birth for the foreign-born population - Sri Lanka (%)
Place of birth for the foreign-born population - Uzbekistan (%)
Place of birth for the foreign-born population - Other South Central Asia (%)
Place of birth for the foreign-born population - Burma (%)
Place of birth for the foreign-born population - Cambodia (%)
Place of birth for the foreign-born population - Indonesia (%)
Place of birth for the foreign-born population - Laos (%)
Place of birth for the foreign-born population - Malaysia (%)
Place of birth for the foreign-born population - Philippines (%)
Place of birth for the foreign-born population - Singapore (%)
Place of birth for the foreign-born population - Thailand (%)
Place of birth for the foreign-born population - Vietnam (%)
Place of birth for the foreign-born population - Other South Eastern Asia (%)
Place of birth for the foreign-born population - Armenia (%)
Place of birth for the foreign-born population - Iraq (%)
Place of birth for the foreign-born population - Israel (%)
Place of birth for the foreign-born population - Jordan (%)
Place of birth for the foreign-born population - Kuwait (%)
Place of birth for the foreign-born population - Lebanon (%)
Place of birth for the foreign-born population - Saudi Arabia (%)
Place of birth for the foreign-born population - Syria (%)
Place of birth for the foreign-born population - Turkey (%)
Place of birth for the foreign-born population - Yemen (%)
Place of birth for the foreign-born population - Other Western Asia (%)
Place of birth for the foreign-born population - Eritrea (%)
Place of birth for the foreign-born population - Ethiopia (%)
Place of birth for the foreign-born population - Kenya (%)
Place of birth for the foreign-born population - Somalia (%)
Place of birth for the foreign-born population - Uganda (%)
Place of birth for the foreign-born population - Zimbabwe (%)
Place of birth for the foreign-born population - Other Eastern Africa (%)
Place of birth for the foreign-born population - Cameroon (%)
Place of birth for the foreign-born population - Congo (%)
Place of birth for the foreign-born population - Democratic Republic of Congo (Zaire) (%)
Place of birth for the foreign-born population - Other Middle Africa (%)
Place of birth for the foreign-born population - Egypt (%)
Place of birth for the foreign-born population - Morocco (%)
Place of birth for the foreign-born population - Sudan (%)
Place of birth for the foreign-born population - Other Northern Africa (%)
Place of birth for the foreign-born population - South Africa (%)
Place of birth for the foreign-born population - Other Southern Africa (%)
Place of birth for the foreign-born population - Cabo Verde (%)
Place of birth for the foreign-born population - Ghana (%)
Place of birth for the foreign-born population - Liberia (%)
Place of birth for the foreign-born population - Nigeria (%)
Place of birth for the foreign-born population - Senegal (%)
Place of birth for the foreign-born population - Sierra Leone (%)
Place of birth for the foreign-born population - Other Western Africa (%)
Place of birth for the foreign-born population - Australia (%)
Place of birth for the foreign-born population - New Zealand (%)
Place of birth for the foreign-born population - Fiji (%)
Place of birth for the foreign-born population - Micronesia (%)
Place of birth for the foreign-born population - Bahamas (%)
Place of birth for the foreign-born population - Barbados (%)
Place of birth for the foreign-born population - Cuba (%)
Place of birth for the foreign-born population - Dominica (%)
Place of birth for the foreign-born population - Dominican Republic (%)
Place of birth for the foreign-born population - Grenada (%)
Place of birth for the foreign-born population - Haiti (%)
Place of birth for the foreign-born population - Jamaica (%)
Place of birth for the foreign-born population - St. Vincent and the Grenadines (%)
Place of birth for the foreign-born population - Trinidad and Tobago (%)
Place of birth for the foreign-born population - West Indies (%)
Place of birth for the foreign-born population - Other Caribbean (%)
Place of birth for the foreign-born population - Belize (%)
Place of birth for the foreign-born population - Costa Rica (%)
Place of birth for the foreign-born population - El Salvador (%)
Place of birth for the foreign-born population - Guatemala (%)
Place of birth for the foreign-born population - Honduras (%)
Place of birth for the foreign-born population - Mexico (%)
Place of birth for the foreign-born population - Nicaragua (%)
Place of birth for the foreign-born population - Panama (%)
Place of birth for the foreign-born population - Other Central America (%)
Place of birth for the foreign-born population - Argentina (%)
Place of birth for the foreign-born population - Bolivia (%)
Place of birth for the foreign-born population - Brazil (%)
Place of birth for the foreign-born population - Chile (%)
Place of birth for the foreign-born population - Colombia (%)
Place of birth for the foreign-born population - Ecuador (%)
Place of birth for the foreign-born population - Guyana (%)
Place of birth for the foreign-born population - Peru (%)
Place of birth for the foreign-born population - Uruguay (%)
Place of birth for the foreign-born population - Venezuela (%)
Place of birth for the foreign-born population - Other South America (%)
Place of birth for the foreign-born population - Canada (%)
Place of birth for the foreign-born population - Other Northern America (%)
Place of birth for the foreign-born population - Other (%)
Latest news about races in Memphis, TN collected exclusively by city-data.com from local newspapers, TV, and radio stations
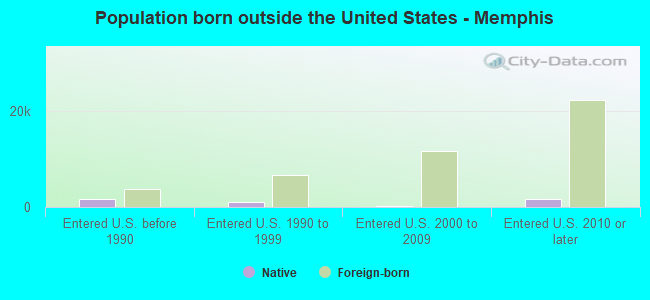
According to 2022 data, the most numerous races in Memphis, TN are White alone (150,287 residents), Black alone (389,252 residents), and Hispanic (55,333 residents). 90.1% of Memphis residents speak English at home. 6.7% of Memphis, TN residents are foreign-born (3.9% born in Latin America, 1.3% born in Asia, 0.8% born in Africa), which is 25.1% greater than the foreign-born rate of 5.0% across the entire state of Tennessee.
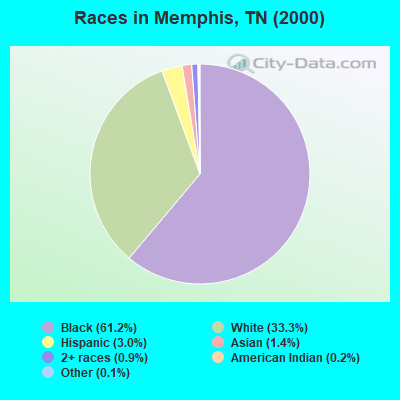
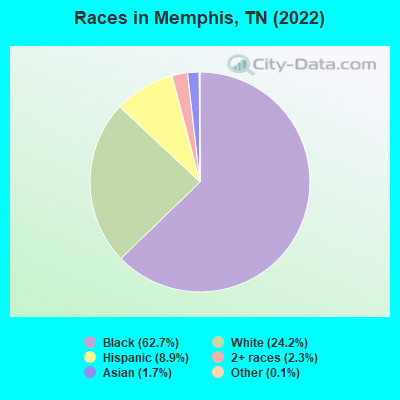
Race distribution in Memphis
2000 2022
397,732 61.2% Black alone 216,174 33.3% White alone 19,317 3.0% Hispanic 9,373 1.4% Asian alone 5,636 0.9% Two or more races 1,009 0.2% American Indian alone 697 0.1% Other race alone 162 0.02% Native Hawaiian and Other
389,252 62.7% Black alone 150,287 24.2% White alone 55,333 8.9% Hispanic 14,500 2.3% Two or more races 10,283 1.7% Asian alone 748 0.1% Other race alone 391 0.06% Native Hawaiian and Other 256 0.04% American Indian alone
2000 2022
4,505,930 79.2% White alone 928,204 16.3% Black alone 123,838 2.2% Hispanic 54,824 1.0% Two or more races 56,077 1.0% Asian alone 13,820 0.2% American Indian alone 4,780 0.08% Other race alone 1,810 0.03% Native Hawaiian and Other
5,070,026 71.9% White alone 1,089,738 15.5% Black alone 442,629 6.3% Hispanic 279,381 4.0% Two or more races 131,817 1.9% Asian alone 26,972 0.4% Other race alone 6,387 0.09% American Indian alone 4,389 0.06% Native Hawaiian and Other
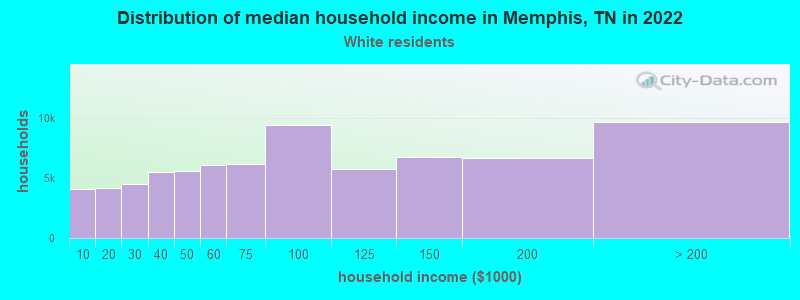
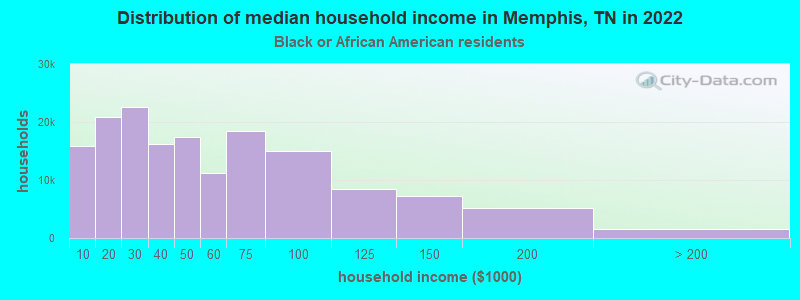
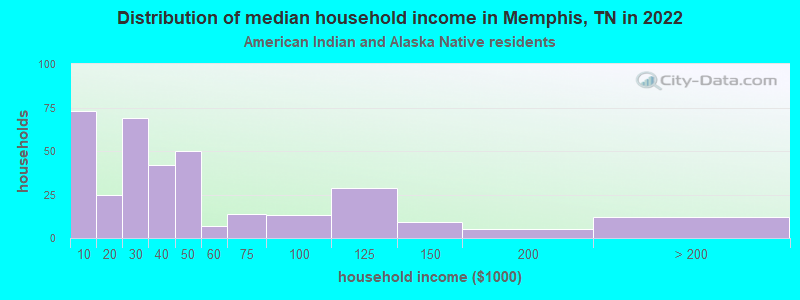
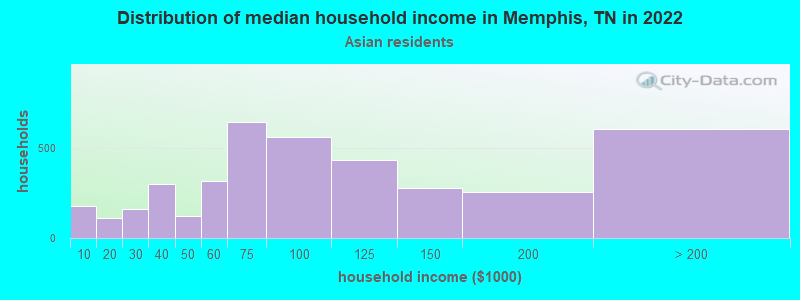
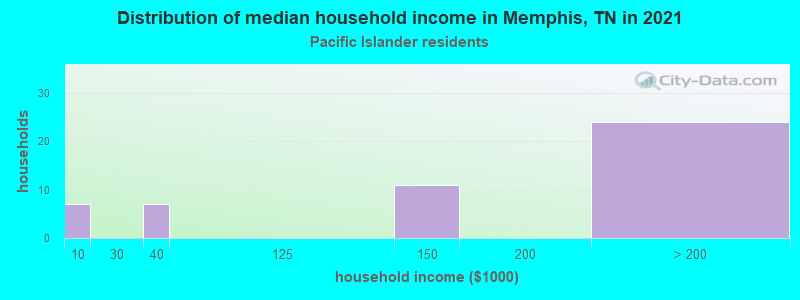
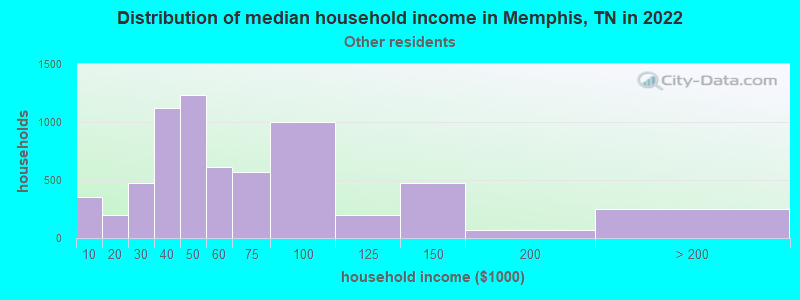
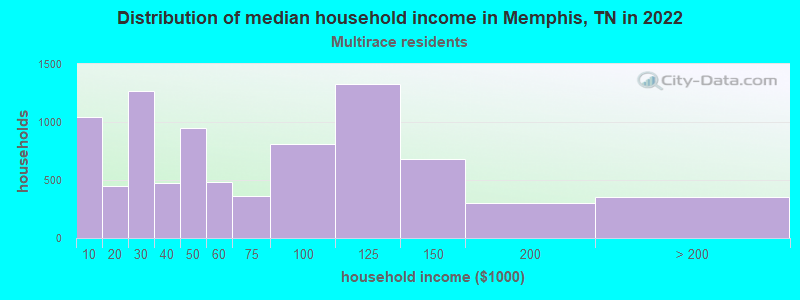
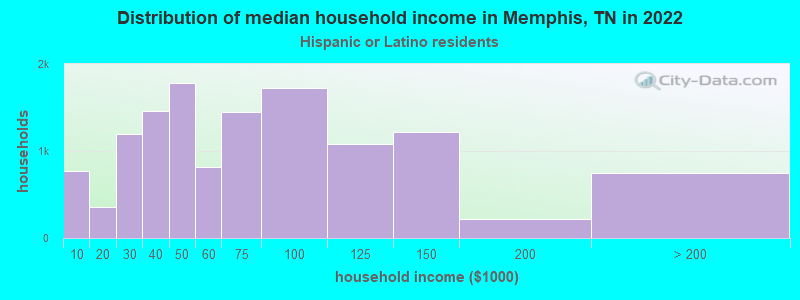
Income and house value in Memphis Median household income in 2022 $76,861 White non-Hispanic householders$41,974 Black householders$30,202 American Indian and Alaska Native householders$92,253 Asian householders$59,226 Some other race householders$50,466 Two or more races householders$60,376 Hispanic or Latino race householdersMedian 2022 house value $224,004 White Non-Hispanic householders$144,140 Black or African American householders$165,725 American Indian or Alaska Native householders $219,687 Asian householders$181,314 Native Hawaiian and other Pacific Islander householders$190,668 Some other race householders$201,460 Two or more races householders$194,265 Hispanic or Latino householders
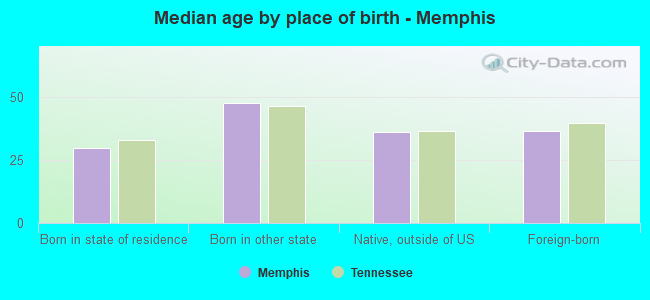
Median age by race in Memphis
41.6 Median age for White residents40.3 43.5 34.0 Median age for Black or African American residents32.1 35.8 35.9 Median age for American Indian / Alaska Native residents35.1 56.4 34.7 Median age for Asian residents34.5 36.7 40.6 Median age for Native Hawaiian / Pacific Islander residents-666,666,666.0 75.6 22.7 Median age for Other race residents20.6 24.3 26.2 Median age for Two or more races residents31.8 22.7 43.4 Median age for White alone residents41.7 45.0 22.8 Median age for Hispanic or Latino residents23.1 22.6
Owner/renter occupied households by race in Memphis
House owners and renters - White residents 47,367 63.8% Owner occupied26,916 36.2% Renter occupiedHouse owners and renters - Black or African American residents 61,121 38.2% Owner occupied98,869 61.8% Renter occupiedHouse owners and renters - American Indian / Alaska Native residents 165 49.5% Owner occupied168 50.5% Renter occupiedHouse owners and renters - Asian residents 2,342 54.6% Owner occupied1,945 45.4% Renter occupiedHouse owners and renters - Native Hawaiian / Pacific Islander residents 2 2.7% Owner occupied63 97.3% Renter occupiedHouse owners and renters - Other race residents 2,374 36.8% Owner occupied4,076 63.2% Renter occupiedHouse owners and renters - Two or more races residents 3,571 42.0% Owner occupied4,929 58.0% Renter occupiedHouse owners and renters - White alone residents 46,526 64.1% Owner occupied26,072 35.9% Renter occupiedHouse owners and renters - Hispanic or Latino residents 4,901 38.2% Owner occupied7,920 61.8% Renter occupied
Language usage in Memphis
English speakers - Total 90.1% of residents of Memphis speak English at home.
7.2% of residents speak Spanish at home 23,148 55.2% Speak English very well18,779 44.8% Speak English less than very well2.7% of residents speak other language at home 10,438 68.0% Speak English very well4,917 32.0% Speak English less than very well
English speakers - Born in the United States 96.7% of residents of Memphis speak English at home.
2.9% of residents speak Spanish at home 4,228 86.2% Speak English very well678 13.8% Speak English less than very well0.4% of residents speak other language at home 674 92.6% Speak English very well54 7.4% Speak English less than very well
English speakers - Native, born elsewhere 72.5% of residents of Memphis speak English at home.
20.3% of residents speak Spanish at home 702 81.2% Speak English very well162 18.8% Speak English less than very well7.2% of residents speak other language at home 249 80.8% Speak English very well59 19.2% Speak English less than very well
English speakers - Foreign-born 17.7% of residents of Memphis speak English at home.
55.6% of residents speak Spanish at home 7,809 32.2% Speak English very well16,417 67.8% Speak English less than very well26.7% of residents speak other language at home 7,483 64.2% Speak English very well4,176 35.8% Speak English less than very well
White (Caucasian) - Speak only English Native:
97.4% (138,703)Foreign-born:
23.1% (2,229)
White (Caucasian) - Speak another language Native:
2.6% (3,708)Foreign-born:
76.9% (7,423)
Black or African American - Speak only English Native:
98.5% (355,442)Foreign-born:
50.5% (2,129)
Black or African American - Speak another language Native:
1.5% (5,395)Foreign-born:
49.5% (2,088)
American Indian / Alaska Native - Speak only English Native:
54.2% (369)Foreign-born:
0.8% (4)
American Indian / Alaska Native - Speak another language Native:
64.7% (440)Foreign-born:
100.0% (537)
Asian - Speak only English Native:
67.9% (2,101)Foreign-born:
26.8% (1,850)
Asian - Speak another language Native:
32.1% (992)Foreign-born:
73.2% (5,051)
Native Hawaiian / Pacific Islander - Speak only English Native:
88.1% (152)Foreign-born:
24.7% (60)
Native Hawaiian / Pacific Islander - Speak another language Native:
10.7% (18)Foreign-born:
77.9% (189)
Other race - Speak only English Native:
23.5% (2,571)Foreign-born:
3.7% (579)
Other race - Speak another language Native:
76.5% (8,354)Foreign-born:
96.3% (14,888)
Two or more races - Speak only English Native:
85.3% (14,459)Foreign-born:
13.3% (793)
Two or more races - Speak another language Native:
14.7% (2,482)Foreign-born:
86.7% (5,160)
White alone - Speak only English Native:
98.9% (137,798)Foreign-born:
33.4% (1,678)
White alone - Speak another language Native:
1.1% (1,598)Foreign-born:
66.6% (3,342)
Hispanic or Latino - Speak only English Native:
35.6% (7,645)Foreign-born:
7.2% (1,921)
Hispanic or Latino - Speak another language Native:
64.4% (13,823)Foreign-born:
92.8% (24,861)
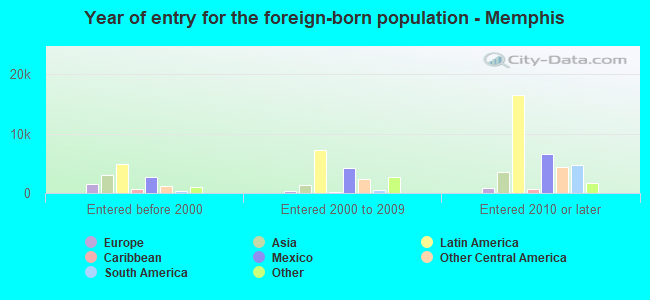
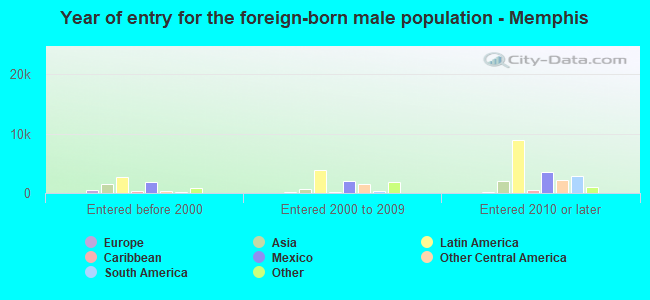
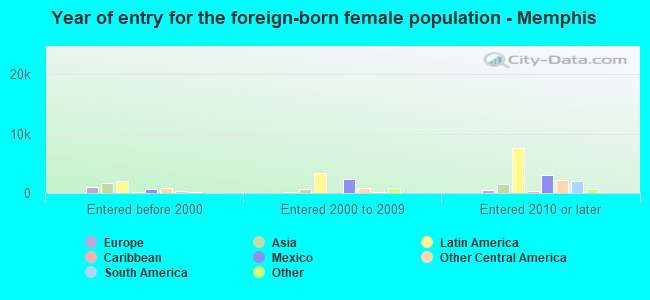
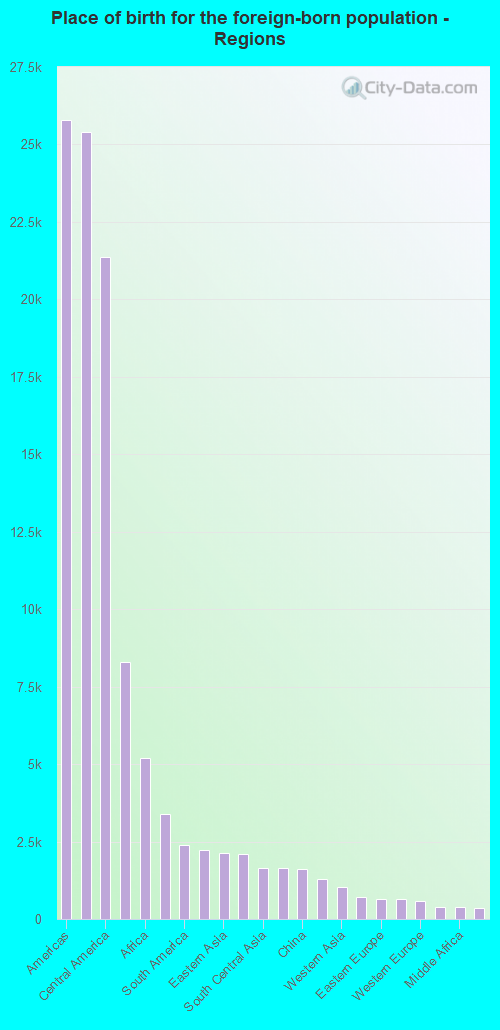
Foreign-born residents in Memphis 41,583 residents are foreign born (3.9% Latin America , 1.3% Asia , 0.8% Africa ).
This city:
6.7%Tennessee:
5.4%
Marital status for residents in Memphis Marital status - White (Caucasian) population 15 years and over
Males 38.7% Never married45.9% Now married1.6% Separated2.3% Widowed11.5% DivorcedFemales 30.4% Never married43.9% Now married1.7% Separated9.8% Widowed14.2% DivorcedWomen who gave birth in the past 12 months Now married:
86.0% (1,267)Unmarried:
14.0% (206)
Women who did not give birth in the past 12 months Now married:
39.2% (13,710)Unmarried:
60.8% (21,245)
Marital status - Black or African American population 15 years and over
Males 58.5% Never married24.0% Now married3.0% Separated3.6% Widowed10.9% DivorcedFemales 54.6% Never married20.0% Now married4.9% Separated8.4% Widowed12.2% DivorcedWomen who gave birth in the past 12 months Now married:
13.0% (554)Unmarried:
87.0% (3,713)
Women who did not give birth in the past 12 months Now married:
19.4% (18,655)Unmarried:
80.6% (77,353)
Marital status - American Indian / Alaska Native population 15 years and over
Males 36.2% Never married33.7% Now married1.9% Separated1.9% Widowed26.3% DivorcedFemales 44.7% Never married24.9% Now married8.0% Separated3.3% Widowed19.1% DivorcedWomen who gave birth in the past 12 months Now married:
20.0% (2)Unmarried:
80.0% (9)
Women who did not give birth in the past 12 months Now married:
39.7% (146)Unmarried:
60.3% (222)
Marital status - Asian population 15 years and over
Males 45.7% Never married43.9% Now married0.0% Separated0.0% Widowed10.4% DivorcedFemales 17.3% Never married77.0% Now married0.0% Separated1.9% Widowed3.9% DivorcedWomen who gave birth in the past 12 months Now married:
100.0% (375)Unmarried:
0.0% (0)
Women who did not give birth in the past 12 months Now married:
77.6% (1,932)Unmarried:
22.4% (558)
Marital status - Native Hawaiian / Pacific Islander population 15 years and over
Males 34.2% Never married7.9% Now married0.0% Separated53.9% Widowed3.9% DivorcedFemales 71.1% Never married23.9% Now married0.0% Separated0.0% Widowed5.0% DivorcedMarital status - Other race population 15 years and over
Males 46.5% Never married46.6% Now married3.3% Separated0.8% Widowed2.8% DivorcedFemales 41.6% Never married48.8% Now married1.8% Separated2.4% Widowed5.4% DivorcedWomen who gave birth in the past 12 months Now married:
38.5% (214)Unmarried:
61.5% (342)
Women who did not give birth in the past 12 months Now married:
51.2% (3,799)Unmarried:
48.8% (3,622)
Marital status - Two or more races population 15 years and over
Males 40.0% Never married38.2% Now married5.5% Separated1.1% Widowed15.3% DivorcedFemales 36.5% Never married41.5% Now married3.4% Separated5.4% Widowed13.2% DivorcedWomen who gave birth in the past 12 months Now married:
46.9% (238)Unmarried:
53.1% (269)
Women who did not give birth in the past 12 months Now married:
38.4% (1,857)Unmarried:
61.6% (2,974)
Marital status - White alone, not Hispanic / Latino population 15 years and over
Males 38.3% Never married46.1% Now married1.2% Separated2.4% Widowed12.0% DivorcedFemales 30.1% Never married43.7% Now married1.5% Separated10.1% Widowed14.5% DivorcedWomen who gave birth in the past 12 months Now married:
86.0% (1,267)Unmarried:
14.0% (206)
Women who did not give birth in the past 12 months Now married:
38.6% (12,777)Unmarried:
61.4% (20,354)
Marital status - Hispanic or Latino population 15 years and over
Males 45.6% Never married44.4% Now married4.0% Separated1.7% Widowed4.4% DivorcedFemales 42.2% Never married46.4% Now married1.8% Separated3.8% Widowed5.8% DivorcedWomen who gave birth in the past 12 months Now married:
51.1% (452)Unmarried:
48.9% (433)
Women who did not give birth in the past 12 months Now married:
46.6% (5,889)Unmarried:
53.4% (6,742)
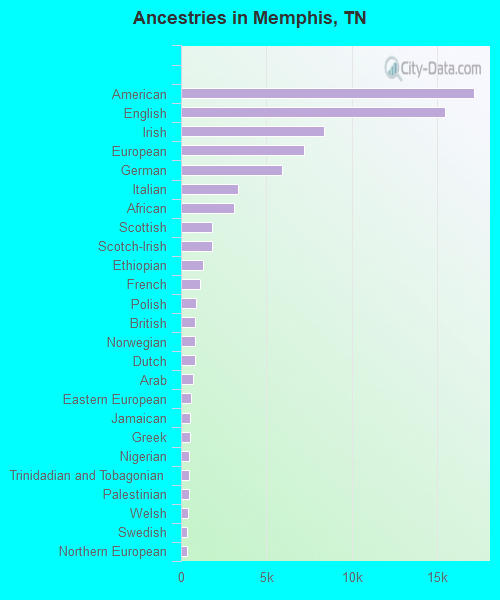
Ancestries in Memphis
17,193 3.7% American15,471 3.4% English8,381 1.8% Irish7,201 1.6% European5,932 1.3% German3,327 0.7% Italian3,078 0.7% African1,846 0.4% Scottish1,798 0.4% Scotch-Irish1,315 0.3% Ethiopian1,097 0.2% French876 0.2% Polish811 0.2% British807 0.2% Norwegian806 0.2% Dutch721 0.2% Arab569 0.1% Eastern European539 0.1% Jamaican517 0.1% Greek495 0.1% Nigerian481 0.1% Trinidadian and Tobagonian460 0.10% Palestinian383 0.08% Welsh370 0.08% Swedish323 0.07% Northern European288 0.06% Scandinavian287 0.06% Russian277 0.06% Portuguese253 0.05% Czech220 0.05% Sudanese219 0.05% Egyptian217 0.05% Lebanese211 0.05% French Canadian156 0.03% Lithuanian144 0.03% Iranian142 0.03% Syrian134 0.03% Brazilian132 0.03% Turkish120 0.03% Danish108 0.02% Canadian104 0.02% Romanian94 0.02% Austrian94 0.02% Slavic85 0.02% Kenyan81 0.02% Hungarian80 0.02% Ukrainian79 0.02% Yugoslavian60 0.01% Swiss56 0.01% Ghanaian53 0.01% Cape Verdean53 0.01% Israeli45 0.01% Senegalese42 0.01% British West Indian41 0.01% Czechoslovakian34 0.01% Somali32 0.01% West Indian31 0.01% Iraqi27 0.01% Haitian25 0.01% Serbian25 0.01% Australian24 0.01% Bulgarian
Geographical mobility in Memphis Same house 1 year ago 135,105 85.6% White (Caucasian)334,961 86.7% Black or African American999 61.2% American Indian / Alaska Native7,648 74.5% Asian251 79.4% Native Hawaiian / Pacific Islander23,163 82.6% Other race23,192 87.6% Two or more races128,560 86.1% White alone, not Hispanic / Latino44,169 83.0% Hispanic or LatinoMoved within same county 11,954 7.6% White / Caucasian36,472 9.4% Black or African American576 35.3% American Indian / Alaska Native658 6.4% Asian41 13.0% Native Hawaiian / Pacific Islander2,054 7.3% Other race1,484 5.6% Two or more races11,444 7.7% White alone, not Hispanic / Latino3,723 7.0% Hispanic or LatinoMoved within same state 3,877 2.5% White / Caucasian3,888 1.0% Black or African American22 1.3% American Indian / Alaska Native793 7.7% Asian26 8.1% Native Hawaiian / Pacific Islander1,222 4.4% Other race182 0.7% Two or more races3,573 2.4% White alone, not Hispanic / Latino1,581 3.0% Hispanic or LatinoMoved from different state 6,239 4.0% White / Caucasian9,552 2.5% Black or African American28 1.7% American Indian / Alaska Native657 6.4% Asian565 2.0% Other race1,285 4.9% Two or more races5,608 3.8% White alone, not Hispanic / Latino2,247 4.2% Hispanic or LatinoMoved from abroad 639 0.4% White1,524 0.4% Black or African American508 4.9% Asian1,032 3.7% Other race346 1.3% Two or more races179 0.1% White alone, not Hispanic / Latino1,466 2.8% Hispanic or Latino
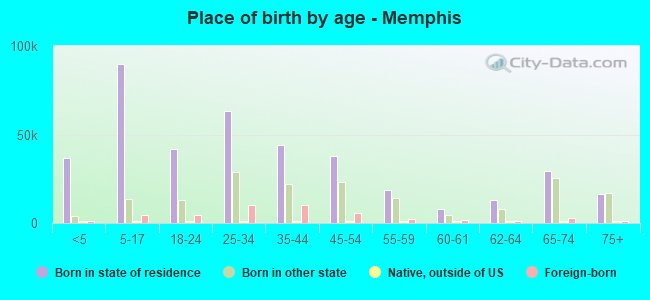
Children Nativity (place of birth) in Memphis
Children under 6 years - Living with two parents Both parents native 10,053 100.0% NativeBoth parents foreign-born 2,654 71.3% Native1,066 28.7% Foreign-bornOne native, one foreign-born parent 2,163 100.0% NativeChildren under 6 years - Living with one parent Native parent 27,563 100.0% NativeForeign-born parent 1,693 93.3% Native121 6.7% Foreign-bornChildren 6 to 17 years - Living with two parents Both parents native 18,841 100.0% NativeBoth parents foreign-born 5,707 63.9% Native3,229 36.1% Foreign-bornOne native, one foreign-born parent 2,632 93.1% Native195 6.9% Foreign-bornChildren 6 to 17 years - Living with one parent Native parent 55,189 100.0% NativeForeign-born parent 4,955 55.2% Native4,028 44.8% Foreign-born
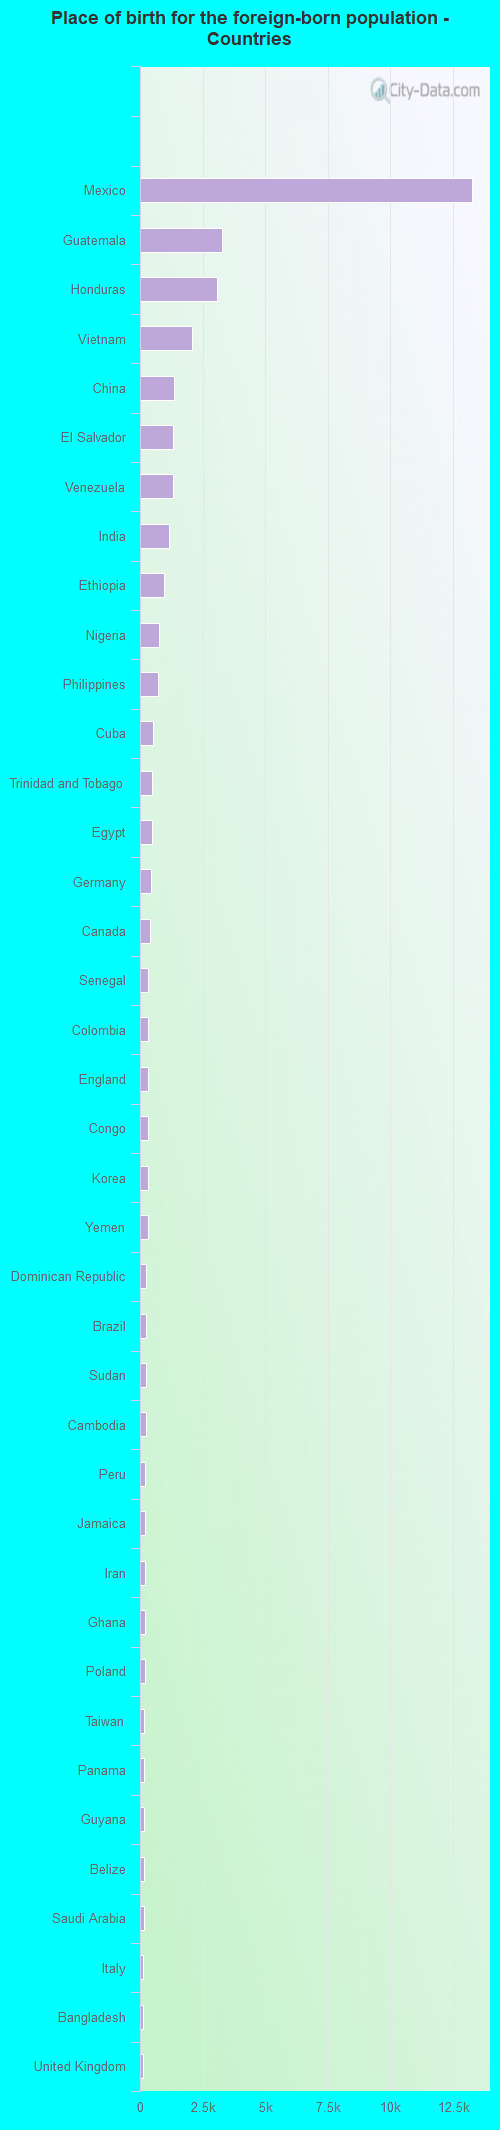
Place of birth for residents in Memphis 25,779 Americas25,390 Latin America21,355 Central America8,311 Asia5,183 Africa3,386 South Eastern Asia2,403 South America2,235 Europe2,127 Eastern Asia2,093 Western Africa1,655 South Central Asia1,631 Caribbean1,622 China1,287 Eastern Africa1,038 Western Asia714 Northern Africa647 Eastern Europe636 Northern Europe594 Western Europe388 Northern America372 Middle Africa357 Southern Europe101 Southern Africa74 Oceania71 Australia and New Zealand Subregion13,270 Mexico3,266 Guatemala3,057 Honduras2,068 Vietnam1,365 China1,307 El Salvador1,303 Venezuela1,143 India970 Ethiopia771 Nigeria705 Philippines528 Cuba490 Trinidad and Tobago466 Egypt453 Germany381 Canada339 Senegal338 Colombia333 England329 Congo317 Korea311 Yemen254 Dominican Republic251 Brazil243 Sudan225 Cambodia205 Peru203 Jamaica196 Iran191 Ghana190 Poland172 Taiwan165 Panama165 Guyana144 Belize141 Saudi Arabia135 Italy128 Bangladesh124 United Kingdom109 Lebanon108 Jordan105 Japan104 Turkey103 Pakistan101 South Africa100 Ireland100 Nicaragua100 Ukraine98 Greece97 Spain97 Thailand85 Romania85 Laos84 Hong Kong81 Iraq77 Russia74 Netherlands71 Australia71 Indonesia68 Malaysia67 Israel61 Argentina52 Sweden48 Kuwait45 Togo44 Kenya44 Bahamas43 Democratic Republic of Congo (Zaire)42 France38 Ecuador38 Eritrea35 Bulgaria35 Singapore35 West Indies34 Belarus32 Uzbekistan29 Burma (Myanmar)28 Syria26 Kazakhstan26 Portugal25 Haiti25 Nepal24 Somalia24 Costa Rica15 Belgium15 Tanzania15 Dominica14 Chile14 Uganda13 Czechoslovakia12 Scotland12 Lithuania11 Liberia11 Uruguay10 Bosnia and Herzegovina10 Armenia8 Switzerland6 Barbados6 Bolivia1 Morocco
Grandparents responsible for own grandchildren in Memphis
Grandparents (30 to 59 years) White / Caucasian 726 84.1% Responsible for grandchildren137 15.9% Not responsible for grandchildrenBlack or African American 2,018 41.1% Responsible for grandchildren2,894 58.9% Not responsible for grandchildrenAmerican Indian / Alaska Native 4 100.0% Not responsible for grandchildrenAsian 12 23.9% Responsible for grandchildren38 76.1% Not responsible for grandchildrenOther race 69 25.8% Responsible for grandchildren198 74.2% Not responsible for grandchildrenTwo or more races 313 79.6% Responsible for grandchildren80 20.4% Not responsible for grandchildrenWhite alone, not Hispanic / Latino 594 86.6% Responsible for grandchildren92 13.4% Not responsible for grandchildrenHispanic or Latino 447 60.9% Responsible for grandchildren287 39.1% Not responsible for grandchildrenGrandparents (60 years and over) White / Caucasian 342 48.8% Responsible for grandchildren359 51.2% Not responsible for grandchildrenBlack or African American 2,083 43.3% Responsible for grandchildren2,729 56.7% Not responsible for grandchildrenAmerican Indian / Alaska Native 4 100.0% Not responsible for grandchildrenAsian 8 5.9% Responsible for grandchildren126 94.1% Not responsible for grandchildrenOther race 131 41.3% Responsible for grandchildren187 58.7% Not responsible for grandchildrenTwo or more races 67 46.4% Responsible for grandchildren77 53.6% Not responsible for grandchildrenWhite alone, not Hispanic / Latino 316 47.0% Responsible for grandchildren357 53.0% Not responsible for grandchildrenHispanic or Latino 184 36.0% Responsible for grandchildren327 64.0% Not responsible for grandchildren
Zip codes: 38018 , 38103 , 38104 , 38105 , 38106 , 38107 , 38108 , 38109 , 38111 , 38112 , 38114 , 38115 , 38116 , 38117 , 38118 , 38119 , 38122 , 38126 , 38127 , 38128 , 38131, 38132, 38141 , 38152 .