Races in Melvindale, Michigan (MI) Detailed Stats
Data:
Races - White alone (%)
Races - White alone (% change since 2000)
Races - Black alone (%)
Races - Black alone (% change since 2000)
Races - American Indian alone (%)
Races - American Indian alone (% change since 2000)
Races - Asian alone (%)
Races - Asian alone (% change since 2000)
Races - Hispanic (%)
Races - Hispanic (% change since 2000)
Races - Native Hawaiian and Other Pacific Islander alone (%)
Races - Native Hawaiian and Other Pacific Islander alone (% change since 2000)
Races - Two or more races(%)
Races - Two or more races(% change since 2000)
Races - Other race alone (%)
Races - Other race alone (% change since 2000)
Racial diversity
Place of birth - Born in state of residence (%)
Place of birth - Born in state of residence (%) - White
Place of birth - Born in state of residence (%) - Black or African American
Place of birth - Born in state of residence (%) - Asian
Place of birth - Born in state of residence (%) - Hispanic or Latino
Place of birth - Born in state of residence (%) - American Indian and Alaska Native
Place of birth - Born in state of residence (%) - Multirace
Place of birth - Born in state of residence (%) - Other Race
Place of birth - Born in other state (%)
Place of birth - Born in other state (%) - White
Place of birth - Born in other state (%) - Black or African American
Place of birth - Born in other state (%) - Asian
Place of birth - Born in other state (%) - Hispanic or Latino
Place of birth - Born in other state (%) - American Indian and Alaska Native
Place of birth - Born in other state (%) - Multirace
Place of birth - Born in other state (%) - Other Race
Place of birth - Native, outside of US (%)
Place of birth - Native, outside of US (%) - White
Place of birth - Native, outside of US (%) - Black or African American
Place of birth - Native, outside of US (%) - Asian
Place of birth - Native, outside of US (%) - Hispanic or Latino
Place of birth - Native, outside of US (%) - American Indian and Alaska Native
Place of birth - Native, outside of US (%) - Multirace
Place of birth - Native, outside of US (%) - Other Race
Place of birth - Foreign born (%)
Place of birth - Foreign born (%) - White
Place of birth - Foreign born (%) - Black or African American
Place of birth - Foreign born (%) - Asian
Place of birth - Foreign born (%) - Hispanic or Latino
Place of birth - Foreign born (%) - American Indian and Alaska Native
Place of birth - Foreign born (%) - Multirace
Place of birth - Foreign born (%) - Other Race
Residents speaking English at home (%)
Residents speaking English at home - Born in the United States (%)
Residents speaking English at home - Native, born elsewhere (%)
Residents speaking English at home - Foreign born (%)
Residents speaking Spanish at home (%)
Residents speaking Spanish at home - Born in the United States (%)
Residents speaking Spanish at home - Native, born elsewhere (%)
Residents speaking Spanish at home - Foreign born (%)
Residents speaking other language at home (%)
Residents speaking other language at home - Born in the United States (%)
Residents speaking other language at home - Native, born elsewhere (%)
Residents speaking other language at home - Foreign born (%)
Marital status - Never married (%)
Marital status - Now married (%)
Marital status - Separated (%)
Marital status - Widowed (%)
Marital status - Divorced (%)
Ancestries Reported - Arab (%)
Ancestries Reported - Czech (%)
Ancestries Reported - Danish (%)
Ancestries Reported - Dutch (%)
Ancestries Reported - English (%)
Ancestries Reported - French (%)
Ancestries Reported - French Canadian (%)
Ancestries Reported - German (%)
Ancestries Reported - Greek (%)
Ancestries Reported - Hungarian (%)
Ancestries Reported - Irish (%)
Ancestries Reported - Italian (%)
Ancestries Reported - Lithuanian (%)
Ancestries Reported - Norwegian (%)
Ancestries Reported - Polish (%)
Ancestries Reported - Portuguese (%)
Ancestries Reported - Russian (%)
Ancestries Reported - Scotch-Irish (%)
Ancestries Reported - Scottish (%)
Ancestries Reported - Slovak (%)
Ancestries Reported - Subsaharan African (%)
Ancestries Reported - Swedish (%)
Ancestries Reported - Swiss (%)
Ancestries Reported - Ukrainian (%)
Ancestries Reported - United States (%)
Ancestries Reported - Welsh (%)
Ancestries Reported - West Indian (%)
Ancestries Reported - Other (%)
Geographical mobility - Same house 1 year ago (%)
Geographical mobility - Same house 1 year ago (%) - White
Geographical mobility - Same house 1 year ago (%) - Black or African American
Geographical mobility - Same house 1 year ago (%) - Asian
Geographical mobility - Same house 1 year ago (%) - Hispanic or Latino
Geographical mobility - Same house 1 year ago (%) - American Indian and Alaska Native
Geographical mobility - Same house 1 year ago (%) - Multirace
Geographical mobility - Same house 1 year ago (%) - Other Race
Geographical mobility - Moved within same county (%)
Geographical mobility - Moved within same county (%) - White
Geographical mobility - Moved within same county (%) - Black or African American
Geographical mobility - Moved within same county (%) - Asian
Geographical mobility - Moved within same county (%) - Hispanic or Latino
Geographical mobility - Moved within same county (%) - American Indian and Alaska Native
Geographical mobility - Moved within same county (%) - Multirace
Geographical mobility - Moved within same county (%) - Other Race
Geographical mobility - Moved from different county within same state (%)
Geographical mobility - Moved from different county within same state (%) - White
Geographical mobility - Moved from different county within same state (%) - Black or African American
Geographical mobility - Moved from different county within same state (%) - Asian
Geographical mobility - Moved from different county within same state (%) - Hispanic or Latino
Geographical mobility - Moved from different county within same state (%) - American Indian and Alaska Native
Geographical mobility - Moved from different county within same state (%) - Multirace
Geographical mobility - Moved from different county within same state (%) - Other Race
Geographical mobility - Moved from different state (%)
Geographical mobility - Moved from different state (%) - White
Geographical mobility - Moved from different state (%) - Black or African American
Geographical mobility - Moved from different state (%) - Asian
Geographical mobility - Moved from different state (%) - Hispanic or Latino
Geographical mobility - Moved from different state (%) - American Indian and Alaska Native
Geographical mobility - Moved from different state (%) - Multirace
Geographical mobility - Moved from different state (%) - Other Race
Geographical mobility - Moved from abroad (%)
Geographical mobility - Moved from abroad (%) - White
Geographical mobility - Moved from abroad (%) - Black or African American
Geographical mobility - Moved from abroad (%) - Asian
Geographical mobility - Moved from abroad (%) - Hispanic or Latino
Geographical mobility - Moved from abroad (%) - American Indian and Alaska Native
Geographical mobility - Moved from abroad (%) - Multirace
Geographical mobility - Moved from abroad (%) - Other Race
Place of birth for the foreign-born population - Ireland (%)
Place of birth for the foreign-born population - Denmark (%)
Place of birth for the foreign-born population - Norway (%)
Place of birth for the foreign-born population - Sweden (%)
Place of birth for the foreign-born population - United Kingdom (%)
Place of birth for the foreign-born population - England (%)
Place of birth for the foreign-born population - Scotland (%)
Place of birth for the foreign-born population - Other Northern Europe (%)
Place of birth for the foreign-born population - Austria (%)
Place of birth for the foreign-born population - Belgium (%)
Place of birth for the foreign-born population - France (%)
Place of birth for the foreign-born population - Germany (%)
Place of birth for the foreign-born population - Netherlands (%)
Place of birth for the foreign-born population - Switzerland (%)
Place of birth for the foreign-born population - Other Western Europe (%)
Place of birth for the foreign-born population - Greece (%)
Place of birth for the foreign-born population - Italy (%)
Place of birth for the foreign-born population - Portugal (%)
Place of birth for the foreign-born population - Spain (%)
Place of birth for the foreign-born population - Other Southern Europe (%)
Place of birth for the foreign-born population - Albania (%)
Place of birth for the foreign-born population - Belarus (%)
Place of birth for the foreign-born population - Bosnia and Herzegovina (%)
Place of birth for the foreign-born population - Bulgaria (%)
Place of birth for the foreign-born population - Croatia (%)
Place of birth for the foreign-born population - Czechoslovakia (%)
Place of birth for the foreign-born population - Hungary (%)
Place of birth for the foreign-born population - Latvia (%)
Place of birth for the foreign-born population - Lithuania (%)
Place of birth for the foreign-born population - North Macedonia (Macedonia) (%)
Place of birth for the foreign-born population - Moldova (%)
Place of birth for the foreign-born population - Poland (%)
Place of birth for the foreign-born population - Romania (%)
Place of birth for the foreign-born population - Russia (%)
Place of birth for the foreign-born population - Serbia (%)
Place of birth for the foreign-born population - Ukraine (%)
Place of birth for the foreign-born population - Other Eastern Europe (%)
Place of birth for the foreign-born population - China (%)
Place of birth for the foreign-born population - Hong Kong (%)
Place of birth for the foreign-born population - Taiwan (%)
Place of birth for the foreign-born population - Japan (%)
Place of birth for the foreign-born population - Korea (%)
Place of birth for the foreign-born population - Other Eastern Asia (%)
Place of birth for the foreign-born population - Afghanistan (%)
Place of birth for the foreign-born population - Bangladesh (%)
Place of birth for the foreign-born population - India (%)
Place of birth for the foreign-born population - Iran (%)
Place of birth for the foreign-born population - Kazakhstan (%)
Place of birth for the foreign-born population - Nepal (%)
Place of birth for the foreign-born population - Pakistan (%)
Place of birth for the foreign-born population - Sri Lanka (%)
Place of birth for the foreign-born population - Uzbekistan (%)
Place of birth for the foreign-born population - Other South Central Asia (%)
Place of birth for the foreign-born population - Burma (%)
Place of birth for the foreign-born population - Cambodia (%)
Place of birth for the foreign-born population - Indonesia (%)
Place of birth for the foreign-born population - Laos (%)
Place of birth for the foreign-born population - Malaysia (%)
Place of birth for the foreign-born population - Philippines (%)
Place of birth for the foreign-born population - Singapore (%)
Place of birth for the foreign-born population - Thailand (%)
Place of birth for the foreign-born population - Vietnam (%)
Place of birth for the foreign-born population - Other South Eastern Asia (%)
Place of birth for the foreign-born population - Armenia (%)
Place of birth for the foreign-born population - Iraq (%)
Place of birth for the foreign-born population - Israel (%)
Place of birth for the foreign-born population - Jordan (%)
Place of birth for the foreign-born population - Kuwait (%)
Place of birth for the foreign-born population - Lebanon (%)
Place of birth for the foreign-born population - Saudi Arabia (%)
Place of birth for the foreign-born population - Syria (%)
Place of birth for the foreign-born population - Turkey (%)
Place of birth for the foreign-born population - Yemen (%)
Place of birth for the foreign-born population - Other Western Asia (%)
Place of birth for the foreign-born population - Eritrea (%)
Place of birth for the foreign-born population - Ethiopia (%)
Place of birth for the foreign-born population - Kenya (%)
Place of birth for the foreign-born population - Somalia (%)
Place of birth for the foreign-born population - Uganda (%)
Place of birth for the foreign-born population - Zimbabwe (%)
Place of birth for the foreign-born population - Other Eastern Africa (%)
Place of birth for the foreign-born population - Cameroon (%)
Place of birth for the foreign-born population - Congo (%)
Place of birth for the foreign-born population - Democratic Republic of Congo (Zaire) (%)
Place of birth for the foreign-born population - Other Middle Africa (%)
Place of birth for the foreign-born population - Egypt (%)
Place of birth for the foreign-born population - Morocco (%)
Place of birth for the foreign-born population - Sudan (%)
Place of birth for the foreign-born population - Other Northern Africa (%)
Place of birth for the foreign-born population - South Africa (%)
Place of birth for the foreign-born population - Other Southern Africa (%)
Place of birth for the foreign-born population - Cabo Verde (%)
Place of birth for the foreign-born population - Ghana (%)
Place of birth for the foreign-born population - Liberia (%)
Place of birth for the foreign-born population - Nigeria (%)
Place of birth for the foreign-born population - Senegal (%)
Place of birth for the foreign-born population - Sierra Leone (%)
Place of birth for the foreign-born population - Other Western Africa (%)
Place of birth for the foreign-born population - Australia (%)
Place of birth for the foreign-born population - New Zealand (%)
Place of birth for the foreign-born population - Fiji (%)
Place of birth for the foreign-born population - Micronesia (%)
Place of birth for the foreign-born population - Bahamas (%)
Place of birth for the foreign-born population - Barbados (%)
Place of birth for the foreign-born population - Cuba (%)
Place of birth for the foreign-born population - Dominica (%)
Place of birth for the foreign-born population - Dominican Republic (%)
Place of birth for the foreign-born population - Grenada (%)
Place of birth for the foreign-born population - Haiti (%)
Place of birth for the foreign-born population - Jamaica (%)
Place of birth for the foreign-born population - St. Vincent and the Grenadines (%)
Place of birth for the foreign-born population - Trinidad and Tobago (%)
Place of birth for the foreign-born population - West Indies (%)
Place of birth for the foreign-born population - Other Caribbean (%)
Place of birth for the foreign-born population - Belize (%)
Place of birth for the foreign-born population - Costa Rica (%)
Place of birth for the foreign-born population - El Salvador (%)
Place of birth for the foreign-born population - Guatemala (%)
Place of birth for the foreign-born population - Honduras (%)
Place of birth for the foreign-born population - Mexico (%)
Place of birth for the foreign-born population - Nicaragua (%)
Place of birth for the foreign-born population - Panama (%)
Place of birth for the foreign-born population - Other Central America (%)
Place of birth for the foreign-born population - Argentina (%)
Place of birth for the foreign-born population - Bolivia (%)
Place of birth for the foreign-born population - Brazil (%)
Place of birth for the foreign-born population - Chile (%)
Place of birth for the foreign-born population - Colombia (%)
Place of birth for the foreign-born population - Ecuador (%)
Place of birth for the foreign-born population - Guyana (%)
Place of birth for the foreign-born population - Peru (%)
Place of birth for the foreign-born population - Uruguay (%)
Place of birth for the foreign-born population - Venezuela (%)
Place of birth for the foreign-born population - Other South America (%)
Place of birth for the foreign-born population - Canada (%)
Place of birth for the foreign-born population - Other Northern America (%)
Place of birth for the foreign-born population - Other (%)
Latest news about races in Melvindale, MI collected exclusively by city-data.com from local newspapers, TV, and radio stations
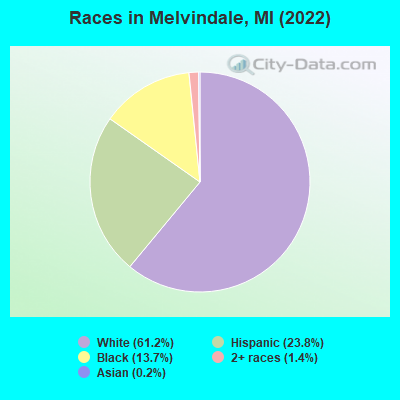
According to 2022 data, the most numerous races in Melvindale, MI are White alone (7,622 residents), Black alone (1,711 residents), and Hispanic (2,967 residents). 58.2% of Melvindale residents speak English at home. 19.4% of Melvindale, MI residents are foreign-born (8.9% born in Asia, 8.9% born in Latin America), which is 69.1% greater than the foreign-born rate of 6.0% across the entire state of Michigan.
Race distribution in Melvindale
2000 2022
7,806,691 78.6% White alone 1,402,047 14.1% Black alone 323,877 3.3% Hispanic 175,311 1.8% Asian alone 163,487 1.6% Two or more races 53,421 0.5% American Indian alone 11,465 0.1% Other race alone 2,145 0.02% Native Hawaiian and Other
7,289,051 72.6% White alone 1,310,464 13.1% Black alone 572,405 5.7% Hispanic 450,031 4.5% Two or more races 335,732 3.3% Asian alone 45,217 0.5% Other race alone 29,011 0.3% American Indian alone 2,207 0.02% Native Hawaiian and Other
Income and house value in Melvindale Median household income in 2022 $36,323 White non-Hispanic householders$52,353 Black householders$32,404 Some other race householders$56,645 Two or more races householders$80,677 Hispanic or Latino race householdersMedian 2022 house value $105,578 White Non-Hispanic householders$86,978 Black or African American householders$137,158 American Indian or Alaska Native householders $602,159 Asian householders$116,417 Some other race householders$88,985 Two or more races householders$105,177 Hispanic or Latino householders
Median age by race in Melvindale
35.1 Median age for White residents35.4 34.9 37.3 Median age for Black or African American residents37.8 35.9 -738,693,466.6 Median age for American Indian / Alaska Native residents-795,074,757.3 -684,380,031.5 -668,478,260.2 Median age for Asian residents-655,555,554.9 -693,333,332.6 -934,108,526.2 Median age for Native Hawaiian / Pacific Islander residents-674,772,035.8 -699,588,476.7 26.1 Median age for Other race residents22.2 37.5 25.9 Median age for Two or more races residents30.0 24.0 36.0 Median age for White alone residents34.3 37.1 27.4 Median age for Hispanic or Latino residents26.5 29.5
Owner/renter occupied households by race in Melvindale
House owners and renters - White residents 2,264 69.8% Owner occupied979 30.2% Renter occupiedHouse owners and renters - Black or African American residents 142 22.5% Owner occupied488 77.5% Renter occupiedHouse owners and renters - Other race residents 141 49.3% Owner occupied145 50.7% Renter occupiedHouse owners and renters - Two or more races residents 165 58.5% Owner occupied117 41.5% Renter occupiedHouse owners and renters - White alone residents 1,912 69.0% Owner occupied860 31.0% Renter occupiedHouse owners and renters - Hispanic or Latino residents 651 68.5% Owner occupied299 31.5% Renter occupied
Language usage in Melvindale
English speakers - Total 58.2% of residents of Melvindale speak English at home.
18.9% of residents speak Spanish at home 1,347 62.6% Speak English very well804 37.4% Speak English less than very well23.4% of residents speak other language at home 1,262 47.4% Speak English very well1,400 52.6% Speak English less than very well
English speakers - Born in the United States 83.2% of residents of Melvindale speak English at home.
8.6% of residents speak Spanish at home 84 100.0% Speak English very well8.1% of residents speak other language at home 49 61.2% Speak English very well31 38.8% Speak English less than very well
English speakers - Native, born elsewhere 22.8% of residents of Melvindale speak English at home.
13.6% of residents speak Spanish at home 100 83.3% Speak English very well20 16.7% Speak English less than very well47.5% of residents speak other language at home 257 61.3% Speak English very well162 38.7% Speak English less than very well
English speakers - Foreign-born 8.4% of residents of Melvindale speak English at home.
42.5% of residents speak Spanish at home 657 62.4% Speak English very well396 37.6% Speak English less than very well48.6% of residents speak other language at home 285 23.7% Speak English very well918 76.3% Speak English less than very well
White (Caucasian) - Speak only English Native:
72.9% (4,485)Foreign-born:
11.0% (214)
White (Caucasian) - Speak another language Native:
24.3% (1,493)Foreign-born:
88.9% (1,723)
Black or African American - Speak another language Native:
10.8% (166)Foreign-born:
96.9% (84)
Other race - Speak another language Native:
70.9% (314)Foreign-born:
100.0% (214)
Two or more races - Speak another language Native:
42.6% (378)Foreign-born:
100.0% (230)
White alone - Speak only English Native:
74.8% (4,214)Foreign-born:
15.9% (195)
White alone - Speak another language Native:
23.6% (1,327)Foreign-born:
84.1% (1,035)
Hispanic or Latino - Speak only English Native:
48.7% (825)Foreign-born:
1.6% (16)
Hispanic or Latino - Speak another language Native:
51.5% (874)Foreign-born:
99.5% (1,046)
Foreign-born residents in Melvindale 2,417 residents are foreign born (8.9% Asia , 8.9% Latin America ).
This city:
19.4%Michigan:
6.9%
Marital status for residents in Melvindale Marital status - White (Caucasian) population 15 years and over
Males 54.4% Never married36.5% Now married0.5% Separated2.1% Widowed6.5% DivorcedFemales 27.0% Never married48.7% Now married1.6% Separated11.0% Widowed11.7% DivorcedWomen who gave birth in the past 12 months Now married:
60.4% (259)Unmarried:
39.6% (170)
Women who did not give birth in the past 12 months Now married:
50.4% (582)Unmarried:
49.6% (573)
Marital status - Black or African American population 15 years and over
Males 73.7% Never married19.0% Now married0.0% Separated0.0% Widowed7.3% DivorcedFemales 53.8% Never married20.9% Now married2.6% Separated2.6% Widowed20.0% DivorcedWomen who gave birth in the past 12 months Now married:
100.0% (42)Unmarried:
0.0% (0)
Women who did not give birth in the past 12 months Now married:
4.4% (20)Unmarried:
95.6% (435)
Marital status - Other race population 15 years and over
Males 3.0% Never married53.6% Now married21.7% Separated0.0% Widowed21.7% DivorcedFemales 47.0% Never married53.0% Now married0.0% Separated0.0% Widowed0.0% DivorcedWomen who did not give birth in the past 12 months Now married:
36.1% (61)Unmarried:
63.9% (109)
Marital status - Two or more races population 15 years and over
Males 71.0% Never married23.6% Now married0.0% Separated4.1% Widowed1.4% DivorcedFemales 61.0% Never married34.9% Now married0.0% Separated0.0% Widowed4.1% DivorcedWomen who did not give birth in the past 12 months Now married:
14.1% (43)Unmarried:
85.9% (264)
Marital status - White alone, not Hispanic / Latino population 15 years and over
Males 48.7% Never married40.1% Now married0.6% Separated2.6% Widowed8.0% DivorcedFemales 26.8% Never married50.1% Now married1.8% Separated12.2% Widowed9.1% DivorcedWomen who gave birth in the past 12 months Now married:
79.3% (265)Unmarried:
20.7% (69)
Women who did not give birth in the past 12 months Now married:
50.3% (508)Unmarried:
49.7% (503)
Marital status - Hispanic or Latino population 15 years and over
Males 62.8% Never married26.8% Now married4.6% Separated1.2% Widowed4.6% DivorcedFemales 45.0% Never married40.1% Now married0.0% Separated0.0% Widowed14.9% DivorcedWomen who gave birth in the past 12 months Now married:
0.0% (0)Unmarried:
100.0% (112)
Women who did not give birth in the past 12 months Now married:
32.1% (184)Unmarried:
67.9% (389)
Ancestries in Melvindale
306 4.0% Irish203 2.7% American156 2.1% Polish155 2.0% Lebanese106 1.4% German69 0.9% Arab53 0.7% European51 0.7% English48 0.6% French46 0.6% Eastern European41 0.5% Italian24 0.3% Jordanian21 0.3% Scandinavian21 0.3% Scottish15 0.2% Ethiopian14 0.2% French Canadian11 0.1% Slovak9 0.1% Ukrainian7 0.09% Maltese4 0.05% African
Geographical mobility in Melvindale Same house 1 year ago 7,471 87.4% White (Caucasian)1,425 83.9% Black or African American632 91.7% Other race1,015 89.9% Two or more races6,820 93.6% White alone, not Hispanic / Latino2,152 73.4% Hispanic or LatinoMoved within same county 883 10.3% White / Caucasian149 8.8% Black or African American18 82.5% Asian44 6.4% Other race44 3.9% Two or more races343 4.7% White alone, not Hispanic / Latino750 25.6% Hispanic or LatinoMoved within same state 22 0.3% White / Caucasian79 4.7% Black or African American23 0.3% White alone, not Hispanic / LatinoMoved from different state 20 0.2% White / Caucasian34 3.0% Two or more races20 0.3% White alone, not Hispanic / LatinoMoved from abroad 61 0.7% White12 0.7% Black or African American63 0.9% White alone, not Hispanic / Latino
Children Nativity (place of birth) in Melvindale
Children under 6 years - Living with two parents Both parents native 117 100.0% NativeBoth parents foreign-born 509 100.0% NativeOne native, one foreign-born parent 323 100.0% NativeChildren under 6 years - Living with one parent Native parent 187 100.0% NativeForeign-born parent 62 100.0% NativeChildren 6 to 17 years - Living with two parents Both parents native 499 100.0% NativeBoth parents foreign-born 378 97.3% Native11 2.7% Foreign-bornOne native, one foreign-born parent 601 74.6% Native205 25.4% Foreign-bornChildren 6 to 17 years - Living with one parent Native parent 528 73.9% Native186 26.1% Foreign-bornForeign-born parent 127 100.0% Native
Grandparents responsible for own grandchildren in Melvindale
Grandparents (30 to 59 years) White / Caucasian 169 74.5% Responsible for grandchildren58 25.5% Not responsible for grandchildrenWhite alone, not Hispanic / Latino 169 73.3% Responsible for grandchildren61 26.7% Not responsible for grandchildrenGrandparents (60 years and over) White / Caucasian 18 78.6% Responsible for grandchildren5 21.4% Not responsible for grandchildrenWhite alone, not Hispanic / Latino 17 76.7% Responsible for grandchildren5 23.3% Not responsible for grandchildren