Races in Medulla, Florida (FL) Detailed Stats
Data:
Races - White alone (%)
Races - White alone (% change since 2000)
Races - Black alone (%)
Races - Black alone (% change since 2000)
Races - American Indian alone (%)
Races - American Indian alone (% change since 2000)
Races - Asian alone (%)
Races - Asian alone (% change since 2000)
Races - Hispanic (%)
Races - Hispanic (% change since 2000)
Races - Native Hawaiian and Other Pacific Islander alone (%)
Races - Native Hawaiian and Other Pacific Islander alone (% change since 2000)
Races - Two or more races(%)
Races - Two or more races(% change since 2000)
Races - Other race alone (%)
Races - Other race alone (% change since 2000)
Racial diversity
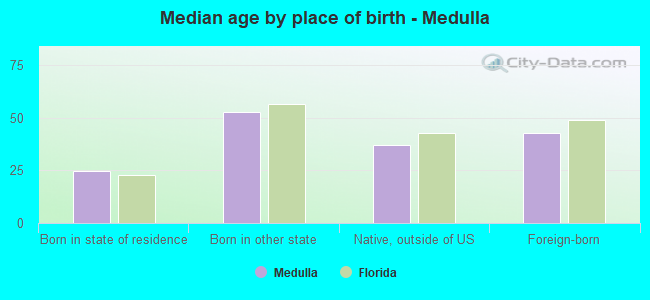
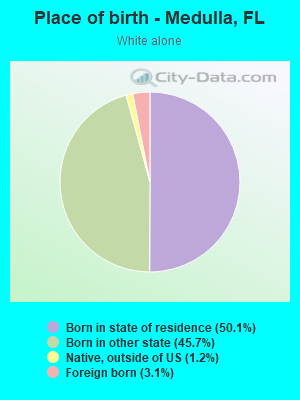
Place of birth - Born in state of residence (%)
Place of birth - Born in state of residence (%) - White
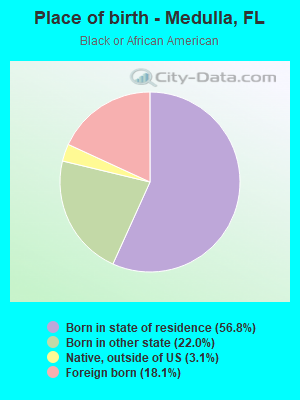
Place of birth - Born in state of residence (%) - Black or African American
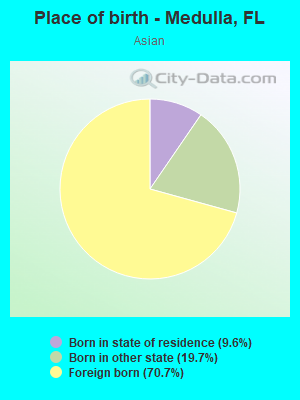
Place of birth - Born in state of residence (%) - Asian
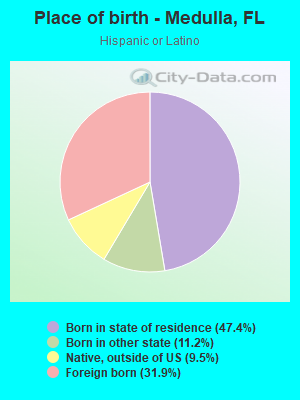
Place of birth - Born in state of residence (%) - Hispanic or Latino
Place of birth - Born in state of residence (%) - American Indian and Alaska Native
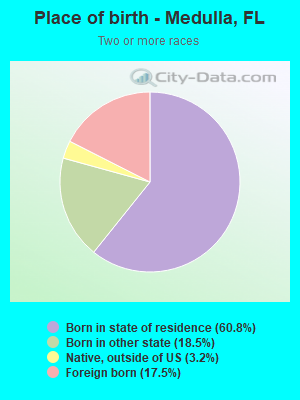
Place of birth - Born in state of residence (%) - Multirace
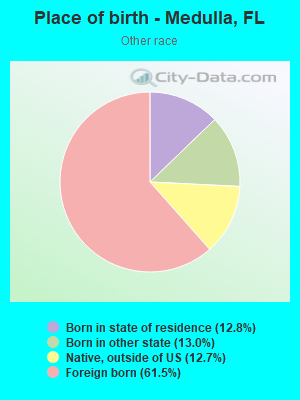
Place of birth - Born in state of residence (%) - Other Race
Place of birth - Born in other state (%)
Place of birth - Born in other state (%) - White
Place of birth - Born in other state (%) - Black or African American
Place of birth - Born in other state (%) - Asian
Place of birth - Born in other state (%) - Hispanic or Latino
Place of birth - Born in other state (%) - American Indian and Alaska Native
Place of birth - Born in other state (%) - Multirace
Place of birth - Born in other state (%) - Other Race
Place of birth - Native, outside of US (%)
Place of birth - Native, outside of US (%) - White
Place of birth - Native, outside of US (%) - Black or African American
Place of birth - Native, outside of US (%) - Asian
Place of birth - Native, outside of US (%) - Hispanic or Latino
Place of birth - Native, outside of US (%) - American Indian and Alaska Native
Place of birth - Native, outside of US (%) - Multirace
Place of birth - Native, outside of US (%) - Other Race
Place of birth - Foreign born (%)
Place of birth - Foreign born (%) - White
Place of birth - Foreign born (%) - Black or African American
Place of birth - Foreign born (%) - Asian
Place of birth - Foreign born (%) - Hispanic or Latino
Place of birth - Foreign born (%) - American Indian and Alaska Native
Place of birth - Foreign born (%) - Multirace
Place of birth - Foreign born (%) - Other Race
Residents speaking English at home (%)
Residents speaking English at home - Born in the United States (%)
Residents speaking English at home - Native, born elsewhere (%)
Residents speaking English at home - Foreign born (%)
Residents speaking Spanish at home (%)
Residents speaking Spanish at home - Born in the United States (%)
Residents speaking Spanish at home - Native, born elsewhere (%)
Residents speaking Spanish at home - Foreign born (%)
Residents speaking other language at home (%)
Residents speaking other language at home - Born in the United States (%)
Residents speaking other language at home - Native, born elsewhere (%)
Residents speaking other language at home - Foreign born (%)
Marital status - Never married (%)
Marital status - Now married (%)
Marital status - Separated (%)
Marital status - Widowed (%)
Marital status - Divorced (%)
Ancestries Reported - Arab (%)
Ancestries Reported - Czech (%)
Ancestries Reported - Danish (%)
Ancestries Reported - Dutch (%)
Ancestries Reported - English (%)
Ancestries Reported - French (%)
Ancestries Reported - French Canadian (%)
Ancestries Reported - German (%)
Ancestries Reported - Greek (%)
Ancestries Reported - Hungarian (%)
Ancestries Reported - Irish (%)
Ancestries Reported - Italian (%)
Ancestries Reported - Lithuanian (%)
Ancestries Reported - Norwegian (%)
Ancestries Reported - Polish (%)
Ancestries Reported - Portuguese (%)
Ancestries Reported - Russian (%)
Ancestries Reported - Scotch-Irish (%)
Ancestries Reported - Scottish (%)
Ancestries Reported - Slovak (%)
Ancestries Reported - Subsaharan African (%)
Ancestries Reported - Swedish (%)
Ancestries Reported - Swiss (%)
Ancestries Reported - Ukrainian (%)
Ancestries Reported - United States (%)
Ancestries Reported - Welsh (%)
Ancestries Reported - West Indian (%)
Ancestries Reported - Other (%)
Geographical mobility - Same house 1 year ago (%)
Geographical mobility - Same house 1 year ago (%) - White
Geographical mobility - Same house 1 year ago (%) - Black or African American
Geographical mobility - Same house 1 year ago (%) - Asian
Geographical mobility - Same house 1 year ago (%) - Hispanic or Latino
Geographical mobility - Same house 1 year ago (%) - American Indian and Alaska Native
Geographical mobility - Same house 1 year ago (%) - Multirace
Geographical mobility - Same house 1 year ago (%) - Other Race
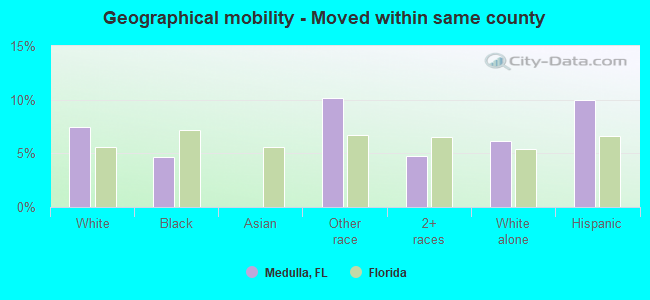
Geographical mobility - Moved within same county (%)
Geographical mobility - Moved within same county (%) - White
Geographical mobility - Moved within same county (%) - Black or African American
Geographical mobility - Moved within same county (%) - Asian
Geographical mobility - Moved within same county (%) - Hispanic or Latino
Geographical mobility - Moved within same county (%) - American Indian and Alaska Native
Geographical mobility - Moved within same county (%) - Multirace
Geographical mobility - Moved within same county (%) - Other Race
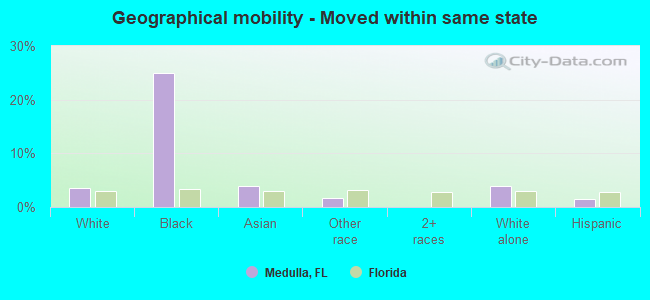
Geographical mobility - Moved from different county within same state (%)
Geographical mobility - Moved from different county within same state (%) - White
Geographical mobility - Moved from different county within same state (%) - Black or African American
Geographical mobility - Moved from different county within same state (%) - Asian
Geographical mobility - Moved from different county within same state (%) - Hispanic or Latino
Geographical mobility - Moved from different county within same state (%) - American Indian and Alaska Native
Geographical mobility - Moved from different county within same state (%) - Multirace
Geographical mobility - Moved from different county within same state (%) - Other Race
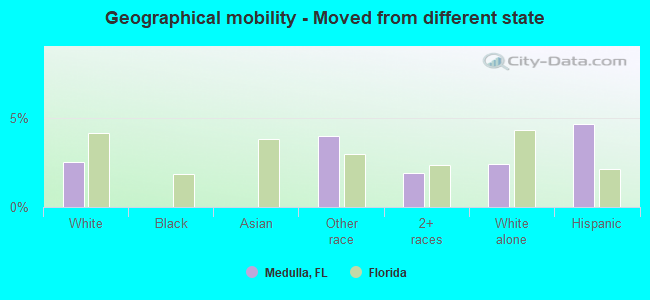
Geographical mobility - Moved from different state (%)
Geographical mobility - Moved from different state (%) - White
Geographical mobility - Moved from different state (%) - Black or African American
Geographical mobility - Moved from different state (%) - Asian
Geographical mobility - Moved from different state (%) - Hispanic or Latino
Geographical mobility - Moved from different state (%) - American Indian and Alaska Native
Geographical mobility - Moved from different state (%) - Multirace
Geographical mobility - Moved from different state (%) - Other Race
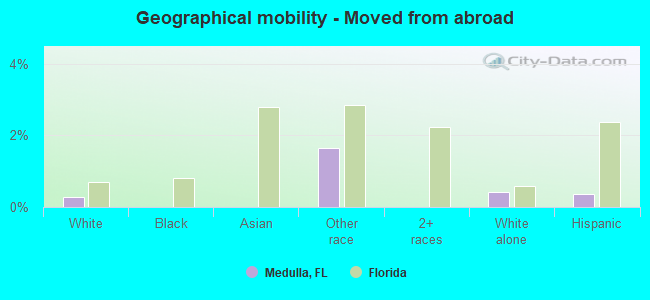
Geographical mobility - Moved from abroad (%)
Geographical mobility - Moved from abroad (%) - White
Geographical mobility - Moved from abroad (%) - Black or African American
Geographical mobility - Moved from abroad (%) - Asian
Geographical mobility - Moved from abroad (%) - Hispanic or Latino
Geographical mobility - Moved from abroad (%) - American Indian and Alaska Native
Geographical mobility - Moved from abroad (%) - Multirace
Geographical mobility - Moved from abroad (%) - Other Race
Place of birth for the foreign-born population - Ireland (%)
Place of birth for the foreign-born population - Denmark (%)
Place of birth for the foreign-born population - Norway (%)
Place of birth for the foreign-born population - Sweden (%)
Place of birth for the foreign-born population - United Kingdom (%)
Place of birth for the foreign-born population - England (%)
Place of birth for the foreign-born population - Scotland (%)
Place of birth for the foreign-born population - Other Northern Europe (%)
Place of birth for the foreign-born population - Austria (%)
Place of birth for the foreign-born population - Belgium (%)
Place of birth for the foreign-born population - France (%)
Place of birth for the foreign-born population - Germany (%)
Place of birth for the foreign-born population - Netherlands (%)
Place of birth for the foreign-born population - Switzerland (%)
Place of birth for the foreign-born population - Other Western Europe (%)
Place of birth for the foreign-born population - Greece (%)
Place of birth for the foreign-born population - Italy (%)
Place of birth for the foreign-born population - Portugal (%)
Place of birth for the foreign-born population - Spain (%)
Place of birth for the foreign-born population - Other Southern Europe (%)
Place of birth for the foreign-born population - Albania (%)
Place of birth for the foreign-born population - Belarus (%)
Place of birth for the foreign-born population - Bosnia and Herzegovina (%)
Place of birth for the foreign-born population - Bulgaria (%)
Place of birth for the foreign-born population - Croatia (%)
Place of birth for the foreign-born population - Czechoslovakia (%)
Place of birth for the foreign-born population - Hungary (%)
Place of birth for the foreign-born population - Latvia (%)
Place of birth for the foreign-born population - Lithuania (%)
Place of birth for the foreign-born population - North Macedonia (Macedonia) (%)
Place of birth for the foreign-born population - Moldova (%)
Place of birth for the foreign-born population - Poland (%)
Place of birth for the foreign-born population - Romania (%)
Place of birth for the foreign-born population - Russia (%)
Place of birth for the foreign-born population - Serbia (%)
Place of birth for the foreign-born population - Ukraine (%)
Place of birth for the foreign-born population - Other Eastern Europe (%)
Place of birth for the foreign-born population - China (%)
Place of birth for the foreign-born population - Hong Kong (%)
Place of birth for the foreign-born population - Taiwan (%)
Place of birth for the foreign-born population - Japan (%)
Place of birth for the foreign-born population - Korea (%)
Place of birth for the foreign-born population - Other Eastern Asia (%)
Place of birth for the foreign-born population - Afghanistan (%)
Place of birth for the foreign-born population - Bangladesh (%)
Place of birth for the foreign-born population - India (%)
Place of birth for the foreign-born population - Iran (%)
Place of birth for the foreign-born population - Kazakhstan (%)
Place of birth for the foreign-born population - Nepal (%)
Place of birth for the foreign-born population - Pakistan (%)
Place of birth for the foreign-born population - Sri Lanka (%)
Place of birth for the foreign-born population - Uzbekistan (%)
Place of birth for the foreign-born population - Other South Central Asia (%)
Place of birth for the foreign-born population - Burma (%)
Place of birth for the foreign-born population - Cambodia (%)
Place of birth for the foreign-born population - Indonesia (%)
Place of birth for the foreign-born population - Laos (%)
Place of birth for the foreign-born population - Malaysia (%)
Place of birth for the foreign-born population - Philippines (%)
Place of birth for the foreign-born population - Singapore (%)
Place of birth for the foreign-born population - Thailand (%)
Place of birth for the foreign-born population - Vietnam (%)
Place of birth for the foreign-born population - Other South Eastern Asia (%)
Place of birth for the foreign-born population - Armenia (%)
Place of birth for the foreign-born population - Iraq (%)
Place of birth for the foreign-born population - Israel (%)
Place of birth for the foreign-born population - Jordan (%)
Place of birth for the foreign-born population - Kuwait (%)
Place of birth for the foreign-born population - Lebanon (%)
Place of birth for the foreign-born population - Saudi Arabia (%)
Place of birth for the foreign-born population - Syria (%)
Place of birth for the foreign-born population - Turkey (%)
Place of birth for the foreign-born population - Yemen (%)
Place of birth for the foreign-born population - Other Western Asia (%)
Place of birth for the foreign-born population - Eritrea (%)
Place of birth for the foreign-born population - Ethiopia (%)
Place of birth for the foreign-born population - Kenya (%)
Place of birth for the foreign-born population - Somalia (%)
Place of birth for the foreign-born population - Uganda (%)
Place of birth for the foreign-born population - Zimbabwe (%)
Place of birth for the foreign-born population - Other Eastern Africa (%)
Place of birth for the foreign-born population - Cameroon (%)
Place of birth for the foreign-born population - Congo (%)
Place of birth for the foreign-born population - Democratic Republic of Congo (Zaire) (%)
Place of birth for the foreign-born population - Other Middle Africa (%)
Place of birth for the foreign-born population - Egypt (%)
Place of birth for the foreign-born population - Morocco (%)
Place of birth for the foreign-born population - Sudan (%)
Place of birth for the foreign-born population - Other Northern Africa (%)
Place of birth for the foreign-born population - South Africa (%)
Place of birth for the foreign-born population - Other Southern Africa (%)
Place of birth for the foreign-born population - Cabo Verde (%)
Place of birth for the foreign-born population - Ghana (%)
Place of birth for the foreign-born population - Liberia (%)
Place of birth for the foreign-born population - Nigeria (%)
Place of birth for the foreign-born population - Senegal (%)
Place of birth for the foreign-born population - Sierra Leone (%)
Place of birth for the foreign-born population - Other Western Africa (%)
Place of birth for the foreign-born population - Australia (%)
Place of birth for the foreign-born population - New Zealand (%)
Place of birth for the foreign-born population - Fiji (%)
Place of birth for the foreign-born population - Micronesia (%)
Place of birth for the foreign-born population - Bahamas (%)
Place of birth for the foreign-born population - Barbados (%)
Place of birth for the foreign-born population - Cuba (%)
Place of birth for the foreign-born population - Dominica (%)
Place of birth for the foreign-born population - Dominican Republic (%)
Place of birth for the foreign-born population - Grenada (%)
Place of birth for the foreign-born population - Haiti (%)
Place of birth for the foreign-born population - Jamaica (%)
Place of birth for the foreign-born population - St. Vincent and the Grenadines (%)
Place of birth for the foreign-born population - Trinidad and Tobago (%)
Place of birth for the foreign-born population - West Indies (%)
Place of birth for the foreign-born population - Other Caribbean (%)
Place of birth for the foreign-born population - Belize (%)
Place of birth for the foreign-born population - Costa Rica (%)
Place of birth for the foreign-born population - El Salvador (%)
Place of birth for the foreign-born population - Guatemala (%)
Place of birth for the foreign-born population - Honduras (%)
Place of birth for the foreign-born population - Mexico (%)
Place of birth for the foreign-born population - Nicaragua (%)
Place of birth for the foreign-born population - Panama (%)
Place of birth for the foreign-born population - Other Central America (%)
Place of birth for the foreign-born population - Argentina (%)
Place of birth for the foreign-born population - Bolivia (%)
Place of birth for the foreign-born population - Brazil (%)
Place of birth for the foreign-born population - Chile (%)
Place of birth for the foreign-born population - Colombia (%)
Place of birth for the foreign-born population - Ecuador (%)
Place of birth for the foreign-born population - Guyana (%)
Place of birth for the foreign-born population - Peru (%)
Place of birth for the foreign-born population - Uruguay (%)
Place of birth for the foreign-born population - Venezuela (%)
Place of birth for the foreign-born population - Other South America (%)
Place of birth for the foreign-born population - Canada (%)
Place of birth for the foreign-born population - Other Northern America (%)
Place of birth for the foreign-born population - Other (%)
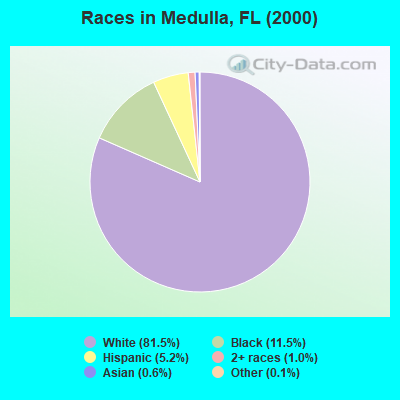
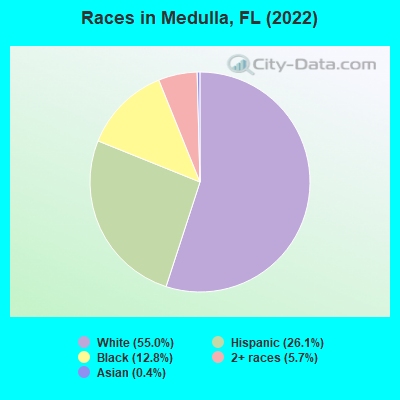
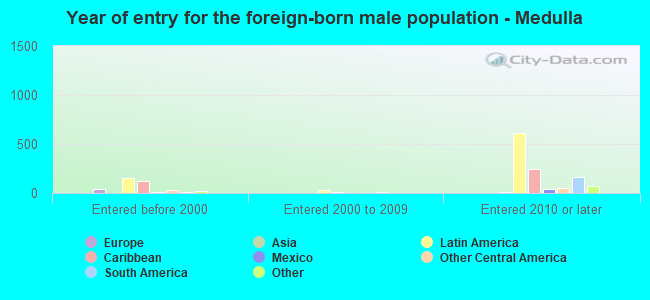
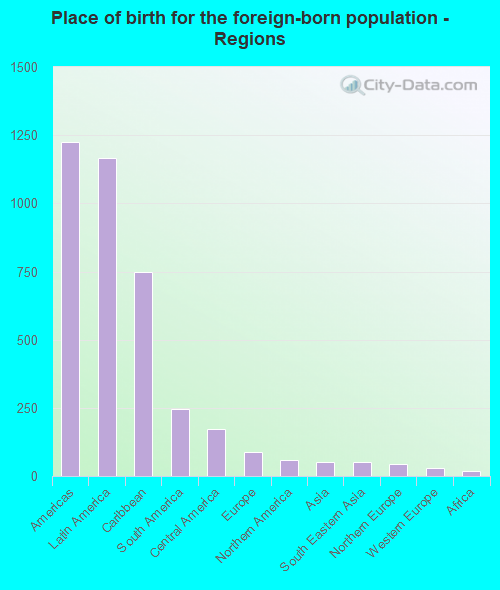
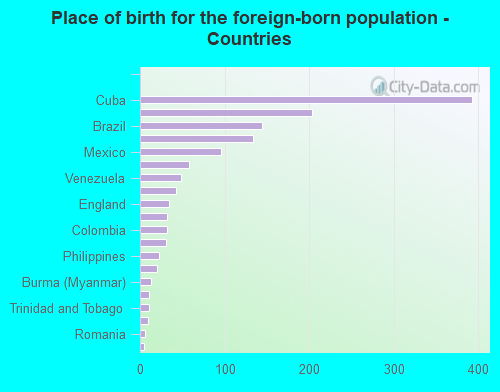
According to 2022 data, the most numerous races in Medulla, FL are White alone (6,685 residents), Hispanic (3,165 residents), and Black alone (1,555 residents). 78.7% of Medulla residents speak English at home. 11.4% of Medulla, FL residents are foreign-born (9.8% born in Latin America), which is 84.1% less than the foreign-born rate of 21.0% across the entire state of Florida.
Race distribution in Medulla
2000 2022
10,458,509 65.4% White alone 2,682,715 16.8% Hispanic 2,264,268 14.2% Black alone 261,693 1.6% Asian alone 236,954 1.5% Two or more races 42,358 0.3% American Indian alone 28,994 0.2% Other race alone 6,887 0.04% Native Hawaiian and Other
11,309,403 50.8% White alone 6,025,039 27.1% Hispanic 3,241,015 14.6% Black alone 861,630 3.9% Two or more races 623,692 2.8% Asian alone 152,054 0.7% Other race alone 22,504 0.1% American Indian alone 9,486 0.04% Native Hawaiian and Other
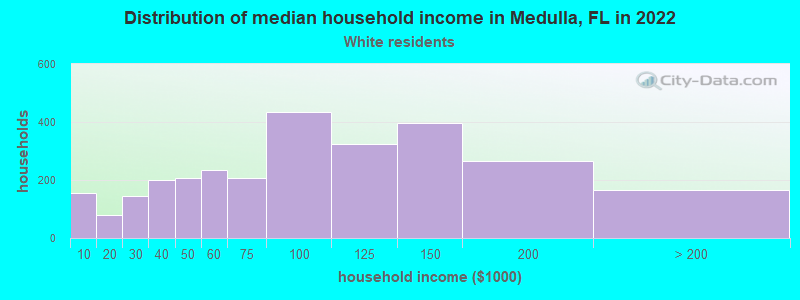
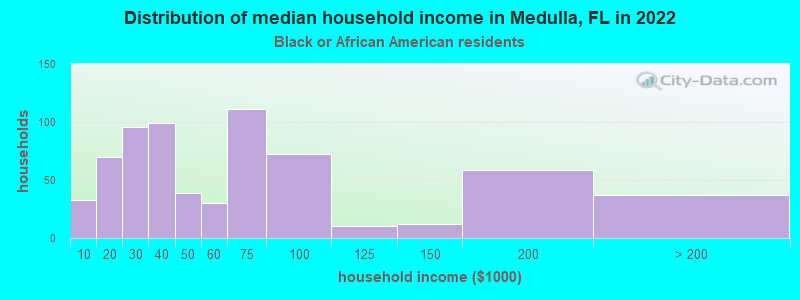
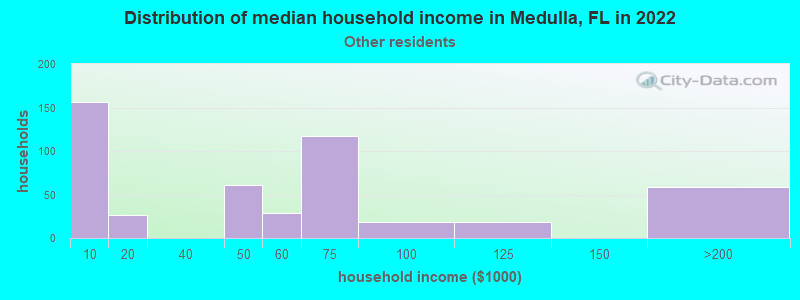
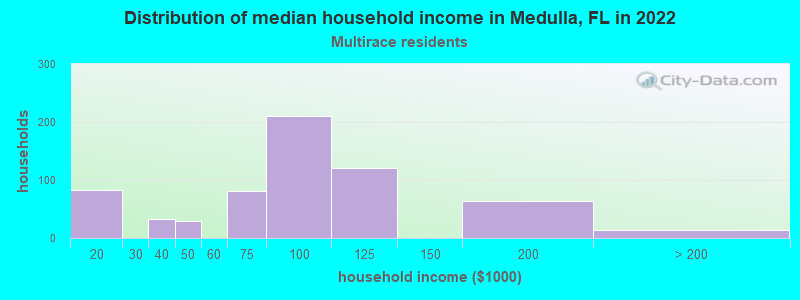
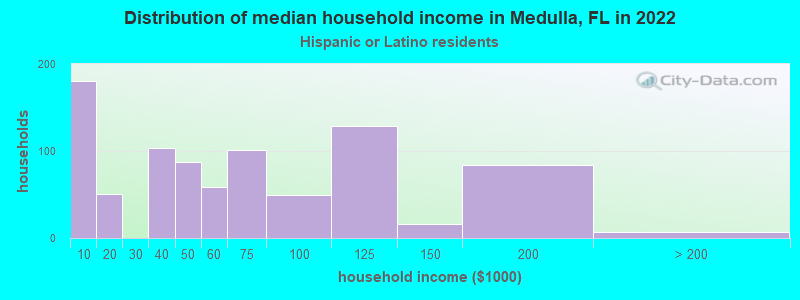
Income and house value in Medulla Median household income in 2022 $92,923 White non-Hispanic householders$46,130 Black householders$52,956 Some other race householders$87,255 Two or more races householders$53,124 Hispanic or Latino race householdersMedian 2022 house value $380,612 White Non-Hispanic householders$200,597 Black or African American householders $449,220 Asian householders$96,704 Two or more races householders$212,358 Hispanic or Latino householders
Median age by race in Medulla
44.1 Median age for White residents43.8 44.2 30.5 Median age for Black or African American residents30.7 35.1 -898,856,639.4 Median age for American Indian / Alaska Native residents-899,908,171.7 -834,555,826.4 37.8 Median age for Asian residents-651,924,651.3 58.6 -679,849,340.2 Median age for Native Hawaiian / Pacific Islander residents-858,307,848.3 -443,298,968.6 39.1 Median age for Other race residents36.8 39.8 21.4 Median age for Two or more races residents18.5 27.1 41.7 Median age for White alone residents42.0 41.6 29.5 Median age for Hispanic or Latino residents29.7 29.6
Owner/renter occupied households by race in Medulla
House owners and renters - White residents 2,029 74.0% Owner occupied715 26.0% Renter occupiedHouse owners and renters - Black or African American residents 382 53.8% Owner occupied328 46.2% Renter occupiedHouse owners and renters - Asian residents 4 100.0% Renter occupiedHouse owners and renters - Other race residents 152 35.4% Owner occupied278 64.6% Renter occupiedHouse owners and renters - Two or more races residents 566 92.3% Owner occupied47 7.7% Renter occupiedHouse owners and renters - White alone residents 2,029 74.5% Owner occupied695 25.5% Renter occupiedHouse owners and renters - Hispanic or Latino residents 464 55.3% Owner occupied375 44.7% Renter occupied
Language usage in Medulla
English speakers - Total 78.7% of residents of Medulla speak English at home.
16.5% of residents speak Spanish at home 1,285 67.0% Speak English very well634 33.0% Speak English less than very well3.5% of residents speak other language at home 257 63.6% Speak English very well147 36.4% Speak English less than very well
English speakers - Born in the United States 93.9% of residents of Medulla speak English at home.
6.1% of residents speak Spanish at home 219 90.5% Speak English very well23 9.5% Speak English less than very well0.2% of residents speak other language at home 7 100.0% Speak English very well
English speakers - Native, born elsewhere 31.0% of residents of Medulla speak English at home.
63.4% of residents speak Spanish at home 172 64.2% Speak English very well96 35.8% Speak English less than very well10.9% of residents speak other language at home 46 100.0% Speak English very well
English speakers - Foreign-born 24.9% of residents of Medulla speak English at home.
50.6% of residents speak Spanish at home 307 37.9% Speak English very well503 62.1% Speak English less than very well21.6% of residents speak other language at home 185 53.5% Speak English very well161 46.5% Speak English less than very well
White (Caucasian) - Speak only English Native:
97.7% (6,136)Foreign-born:
46.2% (93)
White (Caucasian) - Speak another language Native:
4.0% (251)Foreign-born:
52.9% (107)
Black or African American - Speak only English Native:
97.4% (1,248)Foreign-born:
9.6% (28)
Black or African American - Speak another language Native:
2.7% (35)Foreign-born:
95.5% (280)
Other race - Speak only English Native:
30.2% (119)Foreign-born:
27.4% (212)
Other race - Speak another language Native:
66.1% (261)Foreign-born:
70.9% (548)
Two or more races - Speak only English Native:
74.2% (1,619)Foreign-born:
43.6% (204)
Two or more races - Speak another language Native:
24.4% (532)Foreign-born:
65.5% (307)
White alone - Speak only English Native:
99.0% (6,173)Foreign-born:
35.3% (72)
White alone - Speak another language Native:
1.0% (64)Foreign-born:
55.1% (112)
Hispanic or Latino - Speak only English Native:
46.0% (944)Foreign-born:
24.3% (244)
Hispanic or Latino - Speak another language Native:
52.5% (1,079)Foreign-born:
77.9% (783)
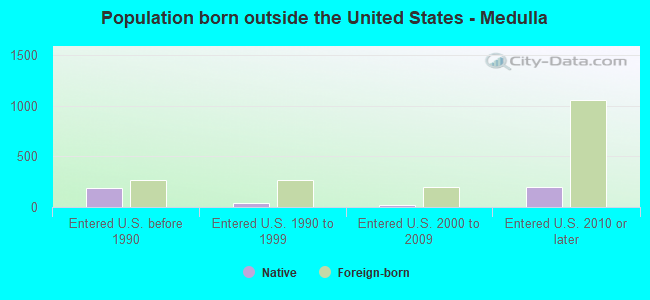
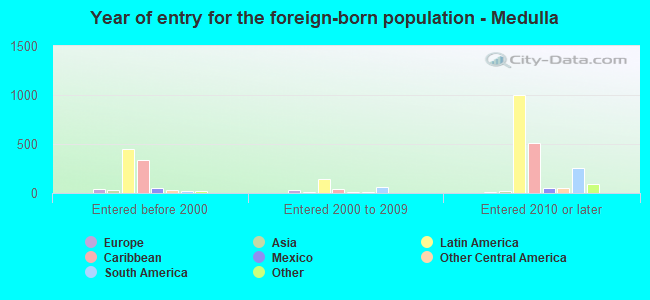
Foreign-born residents in Medulla 1,385 residents are foreign born (9.8% Latin America ).
This city:
11.4%Florida:
21.1%
Marital status for residents in Medulla Marital status - White (Caucasian) population 15 years and over
Males 30.7% Never married56.6% Now married1.6% Separated3.3% Widowed7.8% DivorcedFemales 28.5% Never married53.0% Now married1.2% Separated5.1% Widowed12.1% DivorcedWomen who gave birth in the past 12 months Now married:
58.1% (16)Unmarried:
41.9% (11)
Women who did not give birth in the past 12 months Now married:
48.3% (764)Unmarried:
51.7% (816)
Marital status - Black or African American population 15 years and over
Males 59.7% Never married30.7% Now married0.0% Separated4.6% Widowed5.1% DivorcedFemales 33.4% Never married31.3% Now married0.0% Separated13.6% Widowed21.7% DivorcedWomen who did not give birth in the past 12 months Now married:
25.8% (111)Unmarried:
74.2% (320)
Marital status - Asian population 15 years and over
Males 0.0% Never married100.0% Now married0.0% Separated0.0% Widowed0.0% DivorcedFemales 0.0% Never married100.0% Now married0.0% Separated0.0% Widowed0.0% DivorcedWomen who did not give birth in the past 12 months Now married:
100.0% (8)Unmarried:
0.0% (0)
Marital status - Other race population 15 years and over
Males 35.8% Never married57.3% Now married3.4% Separated0.0% Widowed3.6% DivorcedFemales 19.3% Never married58.6% Now married17.9% Separated4.2% Widowed0.0% DivorcedWomen who did not give birth in the past 12 months Now married:
77.6% (201)Unmarried:
22.4% (58)
Marital status - Two or more races population 15 years and over
Males 47.2% Never married52.8% Now married0.0% Separated0.0% Widowed0.0% DivorcedFemales 55.4% Never married31.0% Now married1.7% Separated5.8% Widowed6.1% DivorcedWomen who gave birth in the past 12 months Now married:
0.0% (0)Unmarried:
100.0% (20)
Women who did not give birth in the past 12 months Now married:
21.9% (183)Unmarried:
78.1% (651)
Marital status - White alone, not Hispanic / Latino population 15 years and over
Males 30.4% Never married56.0% Now married1.8% Separated3.6% Widowed8.3% DivorcedFemales 29.5% Never married51.4% Now married0.9% Separated5.3% Widowed12.9% DivorcedWomen who gave birth in the past 12 months Now married:
58.1% (18)Unmarried:
41.9% (13)
Women who did not give birth in the past 12 months Now married:
47.0% (769)Unmarried:
53.0% (867)
Marital status - Hispanic or Latino population 15 years and over
Males 42.4% Never married52.7% Now married1.3% Separated0.0% Widowed3.7% DivorcedFemales 39.8% Never married44.3% Now married5.3% Separated5.4% Widowed5.2% DivorcedWomen who gave birth in the past 12 months Now married:
0.0% (0)Unmarried:
100.0% (14)
Women who did not give birth in the past 12 months Now married:
37.8% (345)Unmarried:
62.2% (569)
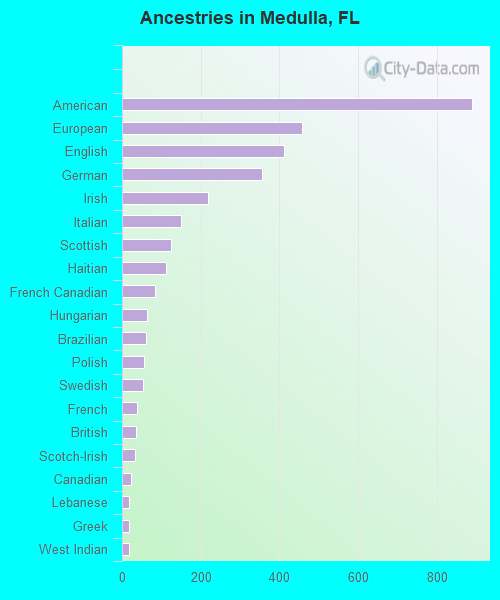
Ancestries in Medulla
888 15.6% American457 8.0% European411 7.2% English355 6.2% German219 3.8% Irish151 2.6% Italian125 2.2% Scottish111 1.9% Haitian84 1.5% French Canadian64 1.1% Hungarian60 1.1% Brazilian57 1.0% Polish54 0.9% Swedish38 0.7% French35 0.6% British33 0.6% Scotch-Irish23 0.4% Canadian18 0.3% Lebanese17 0.3% Greek17 0.3% West Indian6 0.1% Dutch5 0.09% Slovene3 0.05% Eastern European3 0.05% Northern European
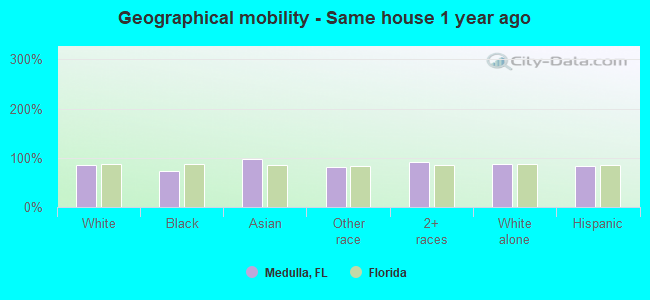
Geographical mobility in Medulla Same house 1 year ago 5,726 85.9% White (Caucasian)1,188 72.3% Black or African American50 97.1% Asian985 81.7% Other race2,498 92.4% Two or more races5,809 87.0% White alone, not Hispanic / Latino2,615 83.3% Hispanic or LatinoMoved within same county 498 7.5% White / Caucasian77 4.7% Black or African American123 10.2% Other race129 4.8% Two or more races413 6.2% White alone, not Hispanic / Latino314 10.0% Hispanic or LatinoMoved within same state 241 3.6% White / Caucasian411 25.0% Black or African American2 3.9% Asian20 1.6% Other race257 3.8% White alone, not Hispanic / Latino49 1.6% Hispanic or LatinoMoved from different state 169 2.5% White / Caucasian48 4.0% Other race51 1.9% Two or more races160 2.4% White alone, not Hispanic / Latino145 4.6% Hispanic or LatinoMoved from abroad 18 0.3% White20 1.7% Other race28 0.4% White alone, not Hispanic / Latino11 0.4% Hispanic or Latino
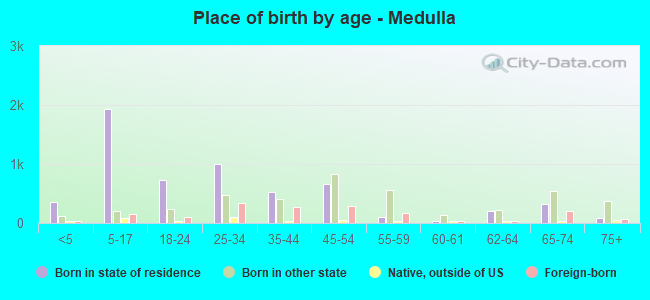
Children Nativity (place of birth) in Medulla
Children under 6 years - Living with two parents Both parents native 301 100.0% NativeBoth parents foreign-born 73 100.0% NativeOne native, one foreign-born parent 40 100.0% NativeChildren under 6 years - Living with one parent Native parent 97 100.0% NativeChildren 6 to 17 years - Living with two parents Both parents native 1,095 99.8% Native3 0.2% Foreign-bornBoth parents foreign-born 48 27.8% Native124 72.2% Foreign-bornOne native, one foreign-born parent 385 100.0% NativeChildren 6 to 17 years - Living with one parent Native parent 374 100.0% NativeForeign-born parent 62 71.9% Native24 28.1% Foreign-born
Grandparents responsible for own grandchildren in Medulla
Grandparents (30 to 59 years) White / Caucasian 12 71.9% Responsible for grandchildren5 28.1% Not responsible for grandchildrenBlack or African American 6 100.0% Responsible for grandchildrenWhite alone, not Hispanic / Latino 14 69.5% Responsible for grandchildren6 30.5% Not responsible for grandchildrenGrandparents (60 years and over) White / Caucasian 20 16.5% Responsible for grandchildren103 83.5% Not responsible for grandchildrenBlack or African American 6 7.2% Responsible for grandchildren80 92.8% Not responsible for grandchildrenWhite alone, not Hispanic / Latino 24 18.2% Responsible for grandchildren107 81.8% Not responsible for grandchildren