Races in Matthews, North Carolina (NC) Detailed Stats
Data:
Races - White alone (%)
Races - White alone (% change since 2000)
Races - Black alone (%)
Races - Black alone (% change since 2000)
Races - American Indian alone (%)
Races - American Indian alone (% change since 2000)
Races - Asian alone (%)
Races - Asian alone (% change since 2000)
Races - Hispanic (%)
Races - Hispanic (% change since 2000)
Races - Native Hawaiian and Other Pacific Islander alone (%)
Races - Native Hawaiian and Other Pacific Islander alone (% change since 2000)
Races - Two or more races(%)
Races - Two or more races(% change since 2000)
Races - Other race alone (%)
Races - Other race alone (% change since 2000)
Racial diversity
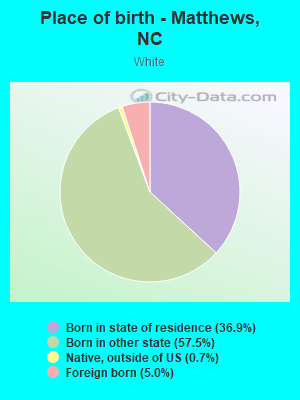
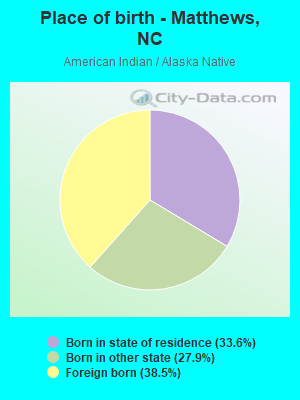
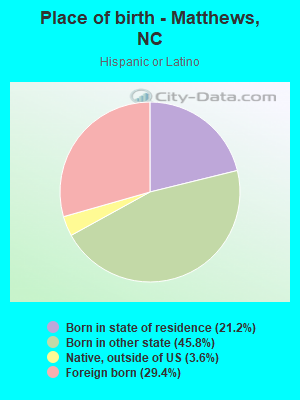
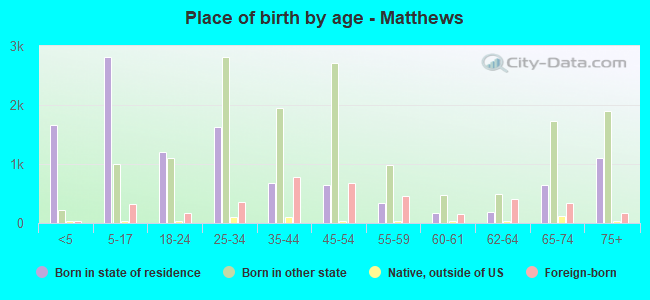
Place of birth - Born in state of residence (%)
Place of birth - Born in state of residence (%) - White
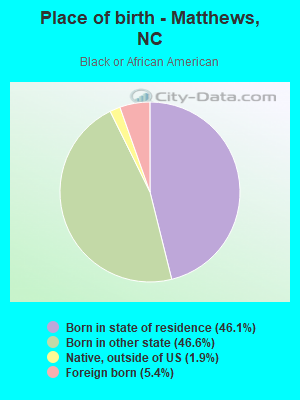
Place of birth - Born in state of residence (%) - Black or African American
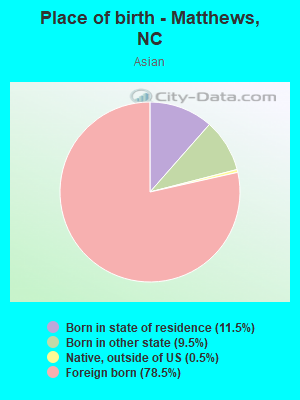
Place of birth - Born in state of residence (%) - Asian
Place of birth - Born in state of residence (%) - Hispanic or Latino
Place of birth - Born in state of residence (%) - American Indian and Alaska Native
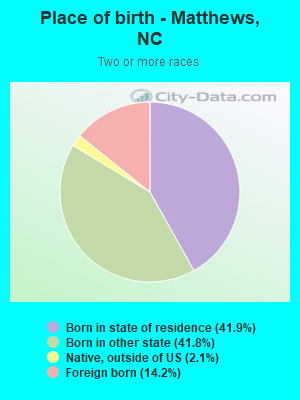
Place of birth - Born in state of residence (%) - Multirace
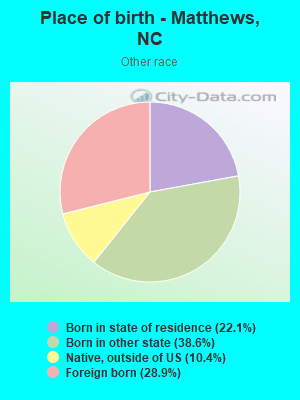
Place of birth - Born in state of residence (%) - Other Race
Place of birth - Born in other state (%)
Place of birth - Born in other state (%) - White
Place of birth - Born in other state (%) - Black or African American
Place of birth - Born in other state (%) - Asian
Place of birth - Born in other state (%) - Hispanic or Latino
Place of birth - Born in other state (%) - American Indian and Alaska Native
Place of birth - Born in other state (%) - Multirace
Place of birth - Born in other state (%) - Other Race
Place of birth - Native, outside of US (%)
Place of birth - Native, outside of US (%) - White
Place of birth - Native, outside of US (%) - Black or African American
Place of birth - Native, outside of US (%) - Asian
Place of birth - Native, outside of US (%) - Hispanic or Latino
Place of birth - Native, outside of US (%) - American Indian and Alaska Native
Place of birth - Native, outside of US (%) - Multirace
Place of birth - Native, outside of US (%) - Other Race
Place of birth - Foreign born (%)
Place of birth - Foreign born (%) - White
Place of birth - Foreign born (%) - Black or African American
Place of birth - Foreign born (%) - Asian
Place of birth - Foreign born (%) - Hispanic or Latino
Place of birth - Foreign born (%) - American Indian and Alaska Native
Place of birth - Foreign born (%) - Multirace
Place of birth - Foreign born (%) - Other Race
Residents speaking English at home (%)
Residents speaking English at home - Born in the United States (%)
Residents speaking English at home - Native, born elsewhere (%)
Residents speaking English at home - Foreign born (%)
Residents speaking Spanish at home (%)
Residents speaking Spanish at home - Born in the United States (%)
Residents speaking Spanish at home - Native, born elsewhere (%)
Residents speaking Spanish at home - Foreign born (%)
Residents speaking other language at home (%)
Residents speaking other language at home - Born in the United States (%)
Residents speaking other language at home - Native, born elsewhere (%)
Residents speaking other language at home - Foreign born (%)
Marital status - Never married (%)
Marital status - Now married (%)
Marital status - Separated (%)
Marital status - Widowed (%)
Marital status - Divorced (%)
Ancestries Reported - Arab (%)
Ancestries Reported - Czech (%)
Ancestries Reported - Danish (%)
Ancestries Reported - Dutch (%)
Ancestries Reported - English (%)
Ancestries Reported - French (%)
Ancestries Reported - French Canadian (%)
Ancestries Reported - German (%)
Ancestries Reported - Greek (%)
Ancestries Reported - Hungarian (%)
Ancestries Reported - Irish (%)
Ancestries Reported - Italian (%)
Ancestries Reported - Lithuanian (%)
Ancestries Reported - Norwegian (%)
Ancestries Reported - Polish (%)
Ancestries Reported - Portuguese (%)
Ancestries Reported - Russian (%)
Ancestries Reported - Scotch-Irish (%)
Ancestries Reported - Scottish (%)
Ancestries Reported - Slovak (%)
Ancestries Reported - Subsaharan African (%)
Ancestries Reported - Swedish (%)
Ancestries Reported - Swiss (%)
Ancestries Reported - Ukrainian (%)
Ancestries Reported - United States (%)
Ancestries Reported - Welsh (%)
Ancestries Reported - West Indian (%)
Ancestries Reported - Other (%)
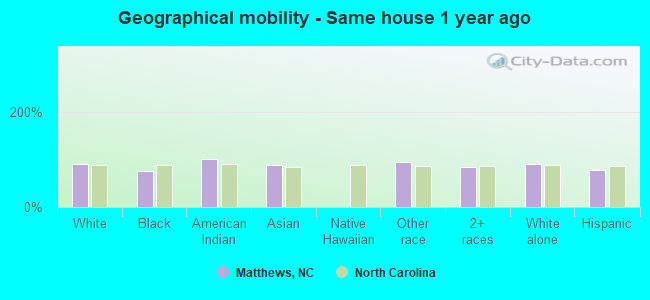
Geographical mobility - Same house 1 year ago (%)
Geographical mobility - Same house 1 year ago (%) - White
Geographical mobility - Same house 1 year ago (%) - Black or African American
Geographical mobility - Same house 1 year ago (%) - Asian
Geographical mobility - Same house 1 year ago (%) - Hispanic or Latino
Geographical mobility - Same house 1 year ago (%) - American Indian and Alaska Native
Geographical mobility - Same house 1 year ago (%) - Multirace
Geographical mobility - Same house 1 year ago (%) - Other Race
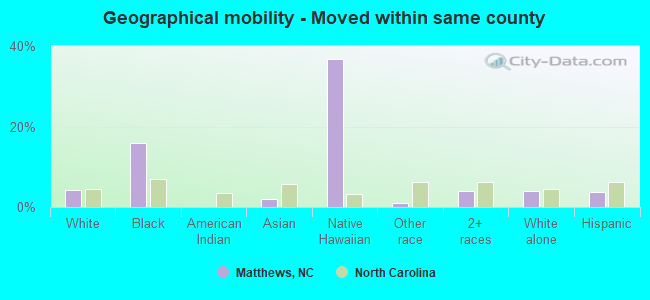
Geographical mobility - Moved within same county (%)
Geographical mobility - Moved within same county (%) - White
Geographical mobility - Moved within same county (%) - Black or African American
Geographical mobility - Moved within same county (%) - Asian
Geographical mobility - Moved within same county (%) - Hispanic or Latino
Geographical mobility - Moved within same county (%) - American Indian and Alaska Native
Geographical mobility - Moved within same county (%) - Multirace
Geographical mobility - Moved within same county (%) - Other Race
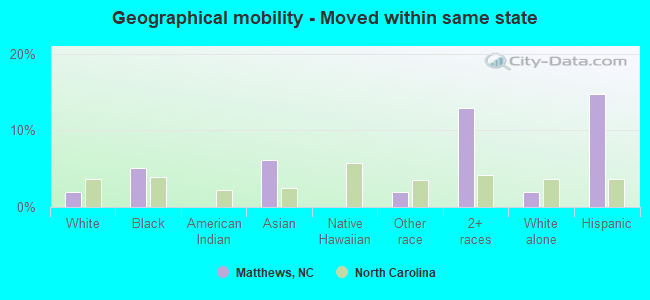
Geographical mobility - Moved from different county within same state (%)
Geographical mobility - Moved from different county within same state (%) - White
Geographical mobility - Moved from different county within same state (%) - Black or African American
Geographical mobility - Moved from different county within same state (%) - Asian
Geographical mobility - Moved from different county within same state (%) - Hispanic or Latino
Geographical mobility - Moved from different county within same state (%) - American Indian and Alaska Native
Geographical mobility - Moved from different county within same state (%) - Multirace
Geographical mobility - Moved from different county within same state (%) - Other Race
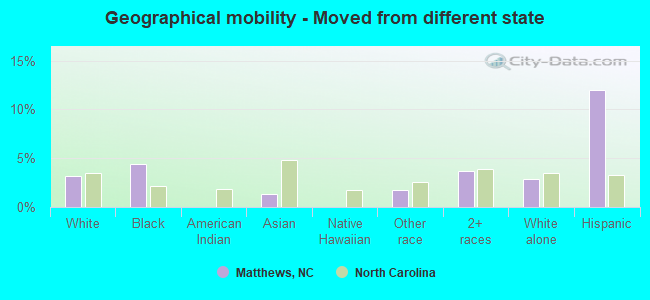
Geographical mobility - Moved from different state (%)
Geographical mobility - Moved from different state (%) - White
Geographical mobility - Moved from different state (%) - Black or African American
Geographical mobility - Moved from different state (%) - Asian
Geographical mobility - Moved from different state (%) - Hispanic or Latino
Geographical mobility - Moved from different state (%) - American Indian and Alaska Native
Geographical mobility - Moved from different state (%) - Multirace
Geographical mobility - Moved from different state (%) - Other Race
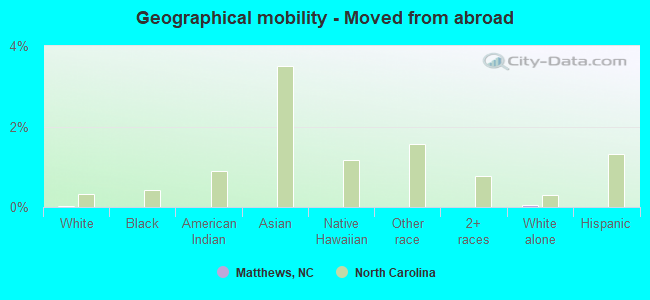
Geographical mobility - Moved from abroad (%)
Geographical mobility - Moved from abroad (%) - White
Geographical mobility - Moved from abroad (%) - Black or African American
Geographical mobility - Moved from abroad (%) - Asian
Geographical mobility - Moved from abroad (%) - Hispanic or Latino
Geographical mobility - Moved from abroad (%) - American Indian and Alaska Native
Geographical mobility - Moved from abroad (%) - Multirace
Geographical mobility - Moved from abroad (%) - Other Race
Place of birth for the foreign-born population - Ireland (%)
Place of birth for the foreign-born population - Denmark (%)
Place of birth for the foreign-born population - Norway (%)
Place of birth for the foreign-born population - Sweden (%)
Place of birth for the foreign-born population - United Kingdom (%)
Place of birth for the foreign-born population - England (%)
Place of birth for the foreign-born population - Scotland (%)
Place of birth for the foreign-born population - Other Northern Europe (%)
Place of birth for the foreign-born population - Austria (%)
Place of birth for the foreign-born population - Belgium (%)
Place of birth for the foreign-born population - France (%)
Place of birth for the foreign-born population - Germany (%)
Place of birth for the foreign-born population - Netherlands (%)
Place of birth for the foreign-born population - Switzerland (%)
Place of birth for the foreign-born population - Other Western Europe (%)
Place of birth for the foreign-born population - Greece (%)
Place of birth for the foreign-born population - Italy (%)
Place of birth for the foreign-born population - Portugal (%)
Place of birth for the foreign-born population - Spain (%)
Place of birth for the foreign-born population - Other Southern Europe (%)
Place of birth for the foreign-born population - Albania (%)
Place of birth for the foreign-born population - Belarus (%)
Place of birth for the foreign-born population - Bosnia and Herzegovina (%)
Place of birth for the foreign-born population - Bulgaria (%)
Place of birth for the foreign-born population - Croatia (%)
Place of birth for the foreign-born population - Czechoslovakia (%)
Place of birth for the foreign-born population - Hungary (%)
Place of birth for the foreign-born population - Latvia (%)
Place of birth for the foreign-born population - Lithuania (%)
Place of birth for the foreign-born population - North Macedonia (Macedonia) (%)
Place of birth for the foreign-born population - Moldova (%)
Place of birth for the foreign-born population - Poland (%)
Place of birth for the foreign-born population - Romania (%)
Place of birth for the foreign-born population - Russia (%)
Place of birth for the foreign-born population - Serbia (%)
Place of birth for the foreign-born population - Ukraine (%)
Place of birth for the foreign-born population - Other Eastern Europe (%)
Place of birth for the foreign-born population - China (%)
Place of birth for the foreign-born population - Hong Kong (%)
Place of birth for the foreign-born population - Taiwan (%)
Place of birth for the foreign-born population - Japan (%)
Place of birth for the foreign-born population - Korea (%)
Place of birth for the foreign-born population - Other Eastern Asia (%)
Place of birth for the foreign-born population - Afghanistan (%)
Place of birth for the foreign-born population - Bangladesh (%)
Place of birth for the foreign-born population - India (%)
Place of birth for the foreign-born population - Iran (%)
Place of birth for the foreign-born population - Kazakhstan (%)
Place of birth for the foreign-born population - Nepal (%)
Place of birth for the foreign-born population - Pakistan (%)
Place of birth for the foreign-born population - Sri Lanka (%)
Place of birth for the foreign-born population - Uzbekistan (%)
Place of birth for the foreign-born population - Other South Central Asia (%)
Place of birth for the foreign-born population - Burma (%)
Place of birth for the foreign-born population - Cambodia (%)
Place of birth for the foreign-born population - Indonesia (%)
Place of birth for the foreign-born population - Laos (%)
Place of birth for the foreign-born population - Malaysia (%)
Place of birth for the foreign-born population - Philippines (%)
Place of birth for the foreign-born population - Singapore (%)
Place of birth for the foreign-born population - Thailand (%)
Place of birth for the foreign-born population - Vietnam (%)
Place of birth for the foreign-born population - Other South Eastern Asia (%)
Place of birth for the foreign-born population - Armenia (%)
Place of birth for the foreign-born population - Iraq (%)
Place of birth for the foreign-born population - Israel (%)
Place of birth for the foreign-born population - Jordan (%)
Place of birth for the foreign-born population - Kuwait (%)
Place of birth for the foreign-born population - Lebanon (%)
Place of birth for the foreign-born population - Saudi Arabia (%)
Place of birth for the foreign-born population - Syria (%)
Place of birth for the foreign-born population - Turkey (%)
Place of birth for the foreign-born population - Yemen (%)
Place of birth for the foreign-born population - Other Western Asia (%)
Place of birth for the foreign-born population - Eritrea (%)
Place of birth for the foreign-born population - Ethiopia (%)
Place of birth for the foreign-born population - Kenya (%)
Place of birth for the foreign-born population - Somalia (%)
Place of birth for the foreign-born population - Uganda (%)
Place of birth for the foreign-born population - Zimbabwe (%)
Place of birth for the foreign-born population - Other Eastern Africa (%)
Place of birth for the foreign-born population - Cameroon (%)
Place of birth for the foreign-born population - Congo (%)
Place of birth for the foreign-born population - Democratic Republic of Congo (Zaire) (%)
Place of birth for the foreign-born population - Other Middle Africa (%)
Place of birth for the foreign-born population - Egypt (%)
Place of birth for the foreign-born population - Morocco (%)
Place of birth for the foreign-born population - Sudan (%)
Place of birth for the foreign-born population - Other Northern Africa (%)
Place of birth for the foreign-born population - South Africa (%)
Place of birth for the foreign-born population - Other Southern Africa (%)
Place of birth for the foreign-born population - Cabo Verde (%)
Place of birth for the foreign-born population - Ghana (%)
Place of birth for the foreign-born population - Liberia (%)
Place of birth for the foreign-born population - Nigeria (%)
Place of birth for the foreign-born population - Senegal (%)
Place of birth for the foreign-born population - Sierra Leone (%)
Place of birth for the foreign-born population - Other Western Africa (%)
Place of birth for the foreign-born population - Australia (%)
Place of birth for the foreign-born population - New Zealand (%)
Place of birth for the foreign-born population - Fiji (%)
Place of birth for the foreign-born population - Micronesia (%)
Place of birth for the foreign-born population - Bahamas (%)
Place of birth for the foreign-born population - Barbados (%)
Place of birth for the foreign-born population - Cuba (%)
Place of birth for the foreign-born population - Dominica (%)
Place of birth for the foreign-born population - Dominican Republic (%)
Place of birth for the foreign-born population - Grenada (%)
Place of birth for the foreign-born population - Haiti (%)
Place of birth for the foreign-born population - Jamaica (%)
Place of birth for the foreign-born population - St. Vincent and the Grenadines (%)
Place of birth for the foreign-born population - Trinidad and Tobago (%)
Place of birth for the foreign-born population - West Indies (%)
Place of birth for the foreign-born population - Other Caribbean (%)
Place of birth for the foreign-born population - Belize (%)
Place of birth for the foreign-born population - Costa Rica (%)
Place of birth for the foreign-born population - El Salvador (%)
Place of birth for the foreign-born population - Guatemala (%)
Place of birth for the foreign-born population - Honduras (%)
Place of birth for the foreign-born population - Mexico (%)
Place of birth for the foreign-born population - Nicaragua (%)
Place of birth for the foreign-born population - Panama (%)
Place of birth for the foreign-born population - Other Central America (%)
Place of birth for the foreign-born population - Argentina (%)
Place of birth for the foreign-born population - Bolivia (%)
Place of birth for the foreign-born population - Brazil (%)
Place of birth for the foreign-born population - Chile (%)
Place of birth for the foreign-born population - Colombia (%)
Place of birth for the foreign-born population - Ecuador (%)
Place of birth for the foreign-born population - Guyana (%)
Place of birth for the foreign-born population - Peru (%)
Place of birth for the foreign-born population - Uruguay (%)
Place of birth for the foreign-born population - Venezuela (%)
Place of birth for the foreign-born population - Other South America (%)
Place of birth for the foreign-born population - Canada (%)
Place of birth for the foreign-born population - Other Northern America (%)
Place of birth for the foreign-born population - Other (%)
Latest news about races in Matthews, NC collected exclusively by city-data.com from local newspapers, TV, and radio stations
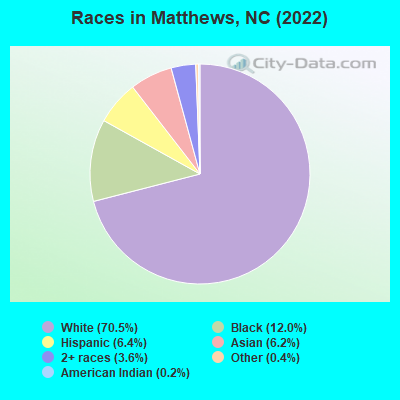
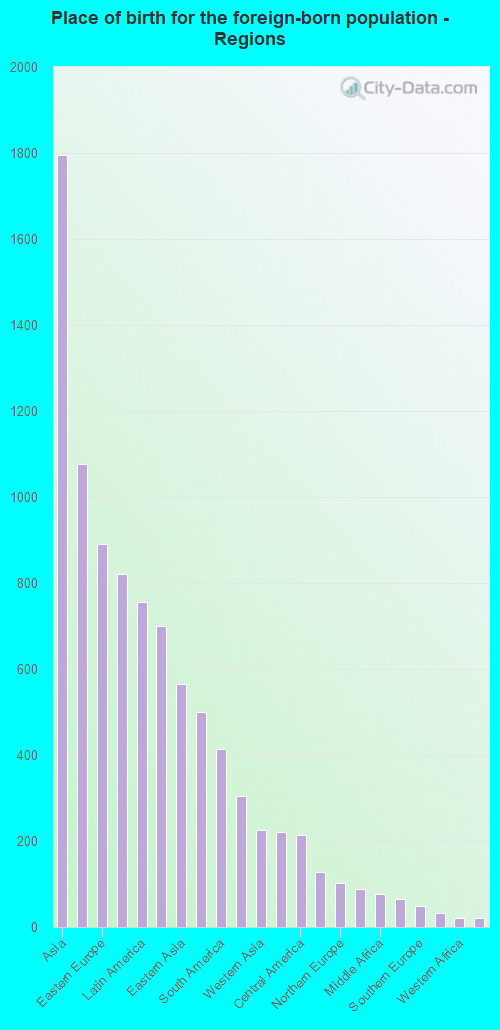
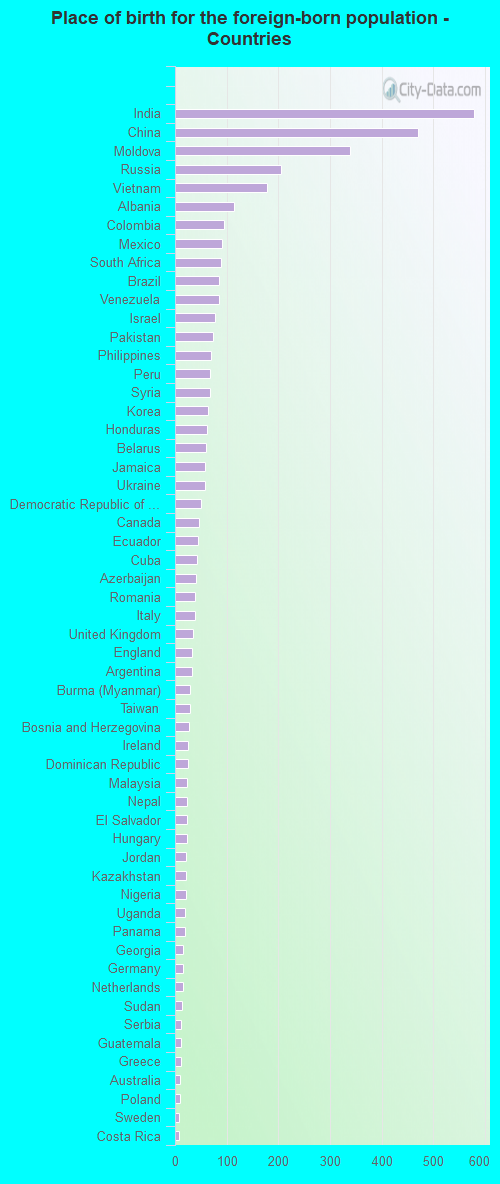
According to 2022 data, the most numerous races in Matthews, NC are White alone (21,425 residents), Black alone (3,640 residents), and Hispanic (1,957 residents). 83.5% of Matthews residents speak English at home. 12.9% of Matthews, NC residents are foreign-born (5.7% born in Asia, 3.4% born in Europe, 2.4% born in Latin America), which is 38.0% greater than the foreign-born rate of 8.0% across the entire state of North Carolina.
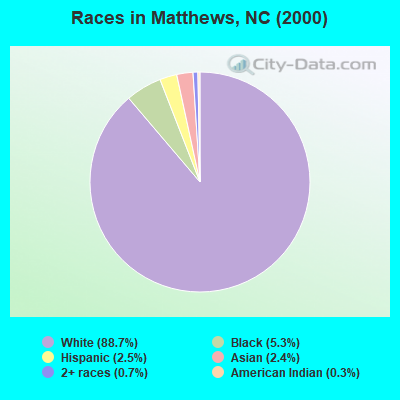
Race distribution in Matthews
2000 2022
5,647,155 70.2% White alone 1,723,301 21.4% Black alone 378,963 4.7% Hispanic 112,416 1.4% Asian alone 95,333 1.2% American Indian alone 79,965 1.0% Two or more races 9,015 0.1% Other race alone 3,165 0.04% Native Hawaiian and Other
6,497,519 60.7% White alone 2,155,650 20.1% Black alone 1,114,799 10.4% Hispanic 438,061 4.1% Two or more races 341,052 3.2% Asian alone 91,758 0.9% American Indian alone 50,180 0.5% Other race alone 9,954 0.09% Native Hawaiian and Other
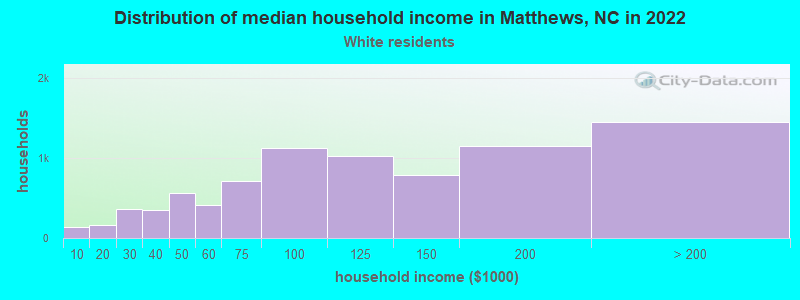
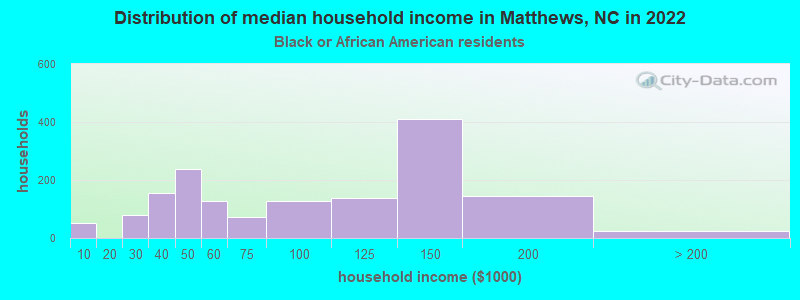
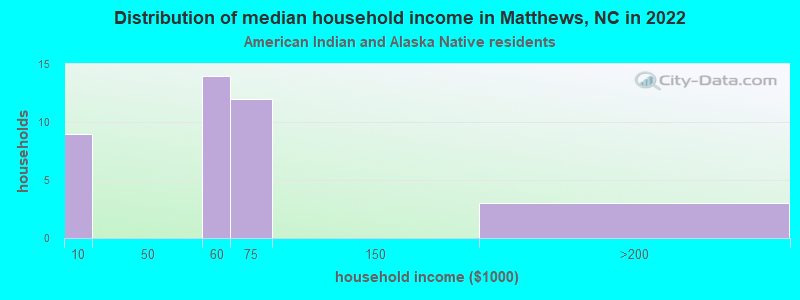
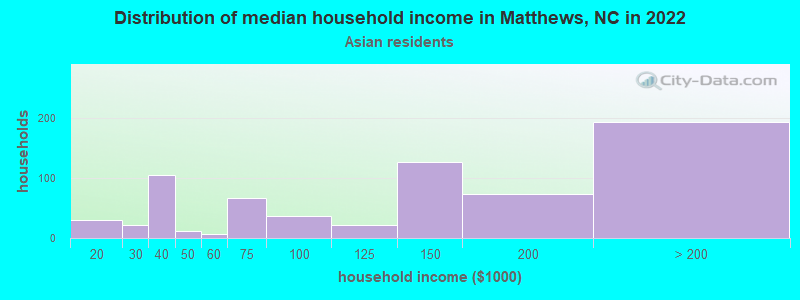
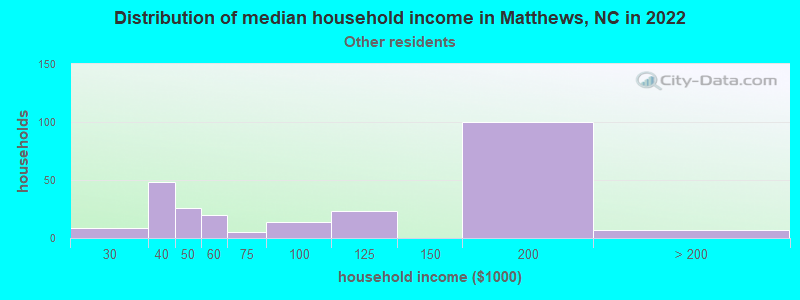
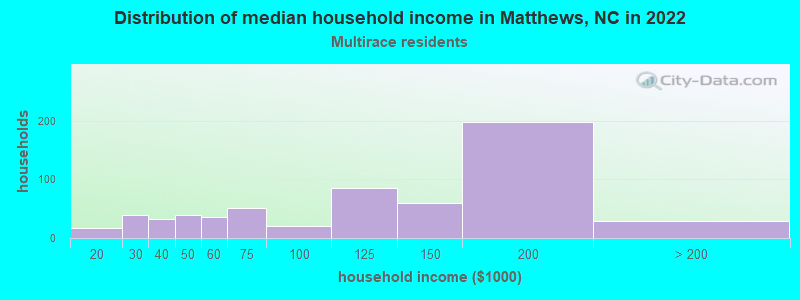
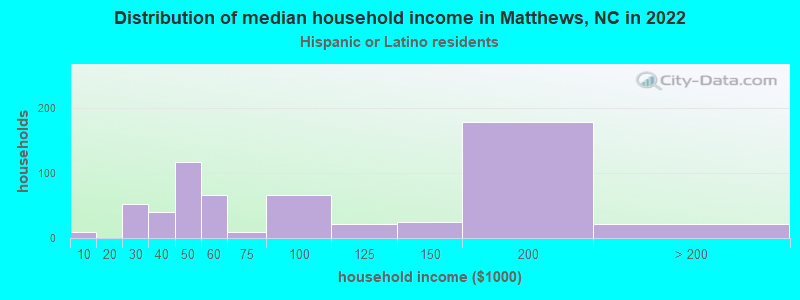
Income and house value in Matthews Median household income in 2022 $105,154 White non-Hispanic householders$85,536 Black householders$66,311 American Indian and Alaska Native householders$133,459 Asian householders$127,328 Two or more races householders$74,311 Hispanic or Latino race householdersMedian 2022 house value $434,263 White Non-Hispanic householders$377,123 Black or African American householders$539,654 American Indian or Alaska Native householders $499,276 Asian householders$334,459 Some other race householders$561,241 Two or more races householders$420,549 Hispanic or Latino householders
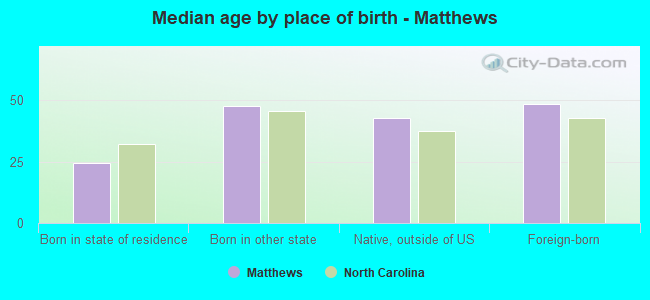
Median age by race in Matthews
42.4 Median age for White residents40.4 44.5 32.8 Median age for Black or African American residents31.3 39.1 34.3 Median age for American Indian / Alaska Native residents26.2 72.9 47.4 Median age for Asian residents47.2 45.8 -865,497,075.2 Median age for Native Hawaiian / Pacific Islander residents-706,616,728.4 -668,458,780.7 27.1 Median age for Other race residents28.9 21.0 26.9 Median age for Two or more races residents24.9 33.2 42.1 Median age for White alone residents40.3 44.2 27.3 Median age for Hispanic or Latino residents26.0 32.6
Owner/renter occupied households by race in Matthews
House owners and renters - White residents 6,133 73.8% Owner occupied2,178 26.2% Renter occupiedHouse owners and renters - Black or African American residents 537 34.8% Owner occupied1,008 65.2% Renter occupiedHouse owners and renters - American Indian / Alaska Native residents 29 49.1% Owner occupied30 50.9% Renter occupiedHouse owners and renters - Asian residents 429 64.5% Owner occupied236 35.5% Renter occupiedHouse owners and renters - Native Hawaiian / Pacific Islander residents 15 100.0% Renter occupiedHouse owners and renters - Other race residents 97 46.3% Owner occupied112 53.7% Renter occupiedHouse owners and renters - Two or more races residents 398 62.6% Owner occupied237 37.4% Renter occupiedHouse owners and renters - White alone residents 6,146 73.1% Owner occupied2,267 26.9% Renter occupiedHouse owners and renters - Hispanic or Latino residents 278 46.1% Owner occupied325 53.9% Renter occupied
Language usage in Matthews
English speakers - Total 83.5% of residents of Matthews speak English at home.
4.4% of residents speak Spanish at home 862 68.7% Speak English very well392 31.3% Speak English less than very well12.1% of residents speak other language at home 2,220 64.3% Speak English very well1,231 35.7% Speak English less than very well
English speakers - Born in the United States 92.8% of residents of Matthews speak English at home.
3.3% of residents speak Spanish at home 446 88.8% Speak English very well56 11.2% Speak English less than very well4.0% of residents speak other language at home 584 95.6% Speak English very well27 4.4% Speak English less than very well
English speakers - Native, born elsewhere 77.8% of residents of Matthews speak English at home.
17.9% of residents speak Spanish at home 47 71.2% Speak English very well19 28.8% Speak English less than very well4.9% of residents speak other language at home 18 100.0% Speak English very well
English speakers - Foreign-born 15.1% of residents of Matthews speak English at home.
14.8% of residents speak Spanish at home 224 40.7% Speak English very well326 59.3% Speak English less than very well69.1% of residents speak other language at home 1,356 52.9% Speak English very well1,208 47.1% Speak English less than very well
White (Caucasian) - Speak only English Native:
97.4% (18,089)Foreign-born:
29.0% (299)
White (Caucasian) - Speak another language Native:
2.8% (518)Foreign-born:
70.1% (723)
Black or African American - Speak only English Native:
97.9% (3,293)Foreign-born:
41.6% (83)
Black or African American - Speak another language Native:
2.1% (69)Foreign-born:
57.0% (114)
Asian - Speak only English Native:
51.9% (201)Foreign-born:
5.4% (81)
Asian - Speak another language Native:
48.2% (186)Foreign-born:
94.3% (1,412)
Other race - Speak only English Native:
36.6% (178)Foreign-born:
5.7% (13)
Other race - Speak another language Native:
64.2% (313)Foreign-born:
93.3% (214)
Two or more races - Speak only English Native:
77.0% (1,232)Foreign-born:
9.9% (32)
Two or more races - Speak another language Native:
22.7% (364)Foreign-born:
90.1% (295)
White alone - Speak only English Native:
96.3% (18,050)Foreign-born:
22.0% (296)
White alone - Speak another language Native:
3.8% (720)Foreign-born:
80.4% (1,084)
Hispanic or Latino - Speak only English Native:
54.7% (656)Foreign-born:
7.2% (42)
Hispanic or Latino - Speak another language Native:
49.2% (591)Foreign-born:
92.5% (539)
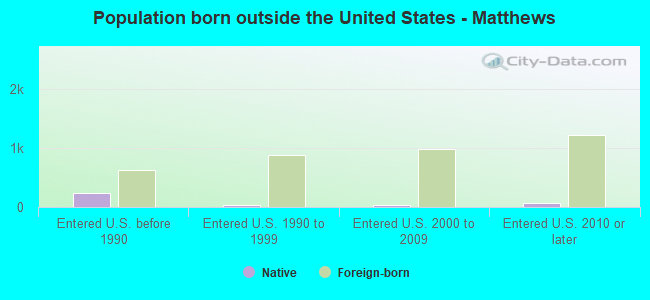
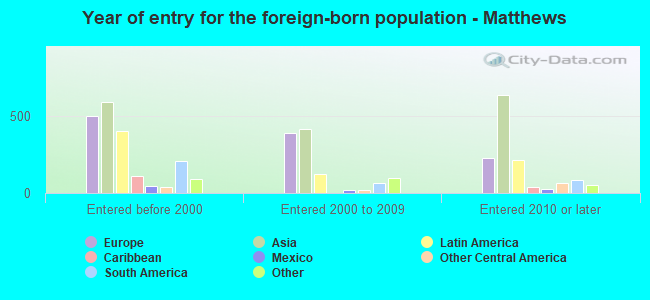
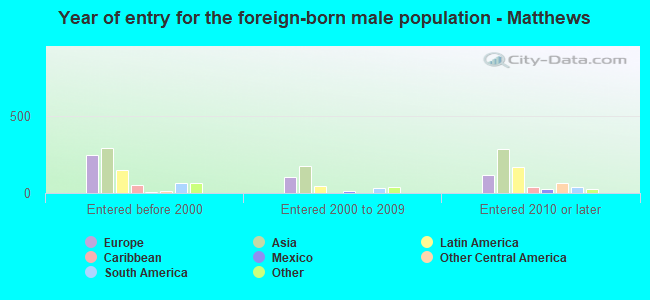
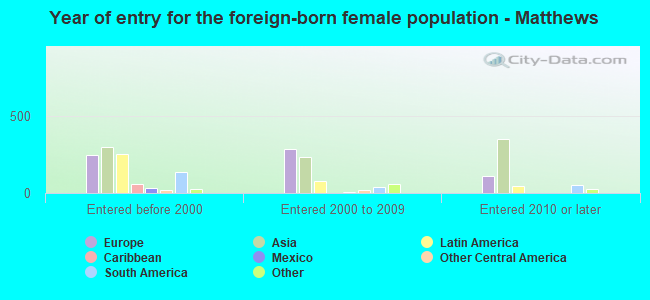
Foreign-born residents in Matthews 3,926 residents are foreign born (5.7% Asia , 3.4% Europe , 2.4% Latin America ).
This city:
12.9%North Carolina:
8.3%
Marital status for residents in Matthews Marital status - White (Caucasian) population 15 years and over
Males 27.5% Never married61.4% Now married1.5% Separated1.7% Widowed7.8% DivorcedFemales 25.9% Never married55.1% Now married1.2% Separated9.0% Widowed8.8% DivorcedWomen who gave birth in the past 12 months Now married:
70.7% (168)Unmarried:
29.3% (70)
Women who did not give birth in the past 12 months Now married:
49.9% (2,134)Unmarried:
50.1% (2,144)
Marital status - Black or African American population 15 years and over
Males 44.7% Never married46.8% Now married2.2% Separated2.7% Widowed3.6% DivorcedFemales 29.4% Never married45.1% Now married5.7% Separated3.8% Widowed15.9% DivorcedWomen who did not give birth in the past 12 months Now married:
53.3% (525)Unmarried:
46.7% (459)
Marital status - American Indian / Alaska Native population 15 years and over
Males 64.9% Never married35.1% Now married0.0% Separated0.0% Widowed0.0% DivorcedFemales 0.0% Never married100.0% Now married0.0% Separated0.0% Widowed0.0% DivorcedWomen who gave birth in the past 12 months Now married:
100.0% (11)Unmarried:
0.0% (0)
Marital status - Asian population 15 years and over
Males 20.4% Never married70.3% Now married0.0% Separated0.0% Widowed9.3% DivorcedFemales 10.8% Never married76.8% Now married0.0% Separated9.7% Widowed2.7% DivorcedWomen who gave birth in the past 12 months Now married:
100.0% (6)Unmarried:
0.0% (0)
Women who did not give birth in the past 12 months Now married:
72.5% (253)Unmarried:
27.5% (96)
Marital status - Other race population 15 years and over
Males 54.2% Never married45.5% Now married0.3% Separated0.0% Widowed0.0% DivorcedFemales 44.0% Never married42.6% Now married0.0% Separated6.2% Widowed7.2% DivorcedWomen who gave birth in the past 12 months Now married:
100.0% (35)Unmarried:
0.0% (0)
Women who did not give birth in the past 12 months Now married:
34.0% (74)Unmarried:
66.0% (143)
Marital status - Two or more races population 15 years and over
Males 53.2% Never married45.2% Now married1.0% Separated0.0% Widowed0.6% DivorcedFemales 27.6% Never married49.1% Now married1.3% Separated6.0% Widowed15.9% DivorcedWomen who gave birth in the past 12 months Now married:
86.5% (85)Unmarried:
13.5% (13)
Women who did not give birth in the past 12 months Now married:
27.2% (89)Unmarried:
72.8% (238)
Marital status - White alone, not Hispanic / Latino population 15 years and over
Males 27.1% Never married61.8% Now married1.5% Separated1.8% Widowed7.8% DivorcedFemales 25.9% Never married55.0% Now married1.0% Separated9.2% Widowed9.0% DivorcedWomen who gave birth in the past 12 months Now married:
70.7% (177)Unmarried:
29.3% (74)
Women who did not give birth in the past 12 months Now married:
49.4% (2,160)Unmarried:
50.6% (2,215)
Marital status - Hispanic or Latino population 15 years and over
Males 45.6% Never married51.8% Now married0.8% Separated0.0% Widowed1.8% DivorcedFemales 30.8% Never married54.1% Now married3.9% Separated7.6% Widowed3.6% DivorcedWomen who gave birth in the past 12 months Now married:
83.6% (54)Unmarried:
16.4% (11)
Women who did not give birth in the past 12 months Now married:
45.7% (201)Unmarried:
54.3% (239)
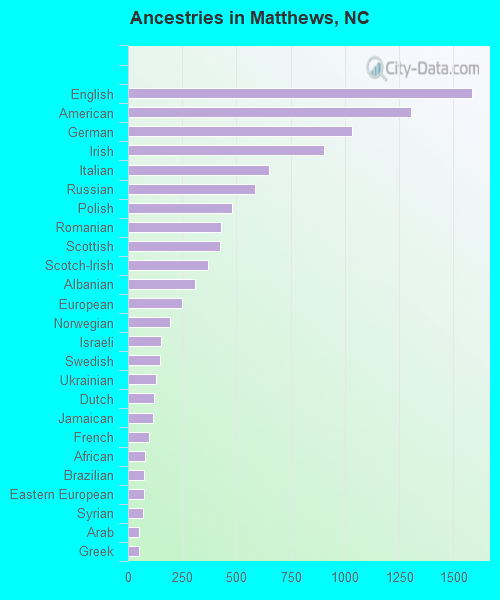
Ancestries in Matthews
1,585 10.0% English1,303 8.2% American1,034 6.5% German905 5.7% Irish648 4.1% Italian586 3.7% Russian479 3.0% Polish431 2.7% Romanian423 2.7% Scottish368 2.3% Scotch-Irish311 2.0% Albanian249 1.6% European195 1.2% Norwegian153 1.0% Israeli146 0.9% Swedish131 0.8% Ukrainian118 0.7% Dutch116 0.7% Jamaican96 0.6% French77 0.5% African74 0.5% Brazilian73 0.5% Eastern European70 0.4% Syrian53 0.3% Arab53 0.3% Greek45 0.3% Haitian42 0.3% Welsh37 0.2% Armenian36 0.2% British35 0.2% Slavic30 0.2% Nigerian28 0.2% Yugoslavian22 0.1% French Canadian21 0.1% Bulgarian20 0.1% Maltese20 0.1% Hungarian17 0.1% Lebanese16 0.1% West Indian13 0.08% Sudanese10 0.06% Scandinavian6 0.04% Serbian5 0.03% Lithuanian5 0.03% Czech
Geographical mobility in Matthews Same house 1 year ago 18,733 90.9% White (Caucasian)2,741 74.8% Black or African American123 100.0% American Indian / Alaska Native1,733 89.3% Asian787 94.4% Other race1,729 83.7% Two or more races19,378 91.4% White alone, not Hispanic / Latino1,500 77.3% Hispanic or LatinoMoved within same county 860 4.2% White / Caucasian579 15.8% Black or African American38 1.9% Asian6 36.9% Native Hawaiian / Pacific Islander9 1.1% Other race81 3.9% Two or more races857 4.0% White alone, not Hispanic / Latino74 3.8% Hispanic or LatinoMoved within same state 407 2.0% White / Caucasian184 5.0% Black or African American120 6.2% Asian16 2.0% Other race268 13.0% Two or more races406 1.9% White alone, not Hispanic / Latino285 14.7% Hispanic or LatinoMoved from different state 665 3.2% White / Caucasian160 4.4% Black or African American25 1.3% Asian15 1.7% Other race77 3.7% Two or more races598 2.8% White alone, not Hispanic / Latino232 12.0% Hispanic or LatinoMoved from abroad 6 0.0% White9 0.0% White alone, not Hispanic / Latino
Children Nativity (place of birth) in Matthews
Children under 6 years - Living with two parents Both parents native 1,529 100.0% NativeBoth parents foreign-born 127 68.3% Native59 31.7% Foreign-bornOne native, one foreign-born parent 138 100.0% NativeChildren under 6 years - Living with one parent Native parent 339 100.0% NativeForeign-born parent 48 100.0% NativeChildren 6 to 17 years - Living with two parents Both parents native 2,447 100.0% NativeBoth parents foreign-born 462 60.2% Native306 39.8% Foreign-bornOne native, one foreign-born parent 125 100.0% NativeChildren 6 to 17 years - Living with one parent Native parent 392 100.0% NativeForeign-born parent 48 60.0% Native32 40.0% Foreign-born
Grandparents responsible for own grandchildren in Matthews
Grandparents (30 to 59 years) White / Caucasian 49 81.9% Responsible for grandchildren11 18.1% Not responsible for grandchildrenBlack or African American 59 69.3% Responsible for grandchildren26 30.7% Not responsible for grandchildrenAsian 23 100.0% Not responsible for grandchildrenTwo or more races 3 100.0% Not responsible for grandchildrenWhite alone, not Hispanic / Latino 56 82.7% Responsible for grandchildren12 17.3% Not responsible for grandchildrenGrandparents (60 years and over) White / Caucasian 25 29.3% Responsible for grandchildren60 70.7% Not responsible for grandchildrenBlack or African American 4 100.0% Not responsible for grandchildrenAsian 20 100.0% Not responsible for grandchildrenTwo or more races 23 100.0% Responsible for grandchildrenWhite alone, not Hispanic / Latino 32 33.8% Responsible for grandchildren64 66.2% Not responsible for grandchildren