Races in Mascotte, Florida (FL) Detailed Stats
Data:
Races - White alone (%)
Races - White alone (% change since 2000)
Races - Black alone (%)
Races - Black alone (% change since 2000)
Races - American Indian alone (%)
Races - American Indian alone (% change since 2000)
Races - Asian alone (%)
Races - Asian alone (% change since 2000)
Races - Hispanic (%)
Races - Hispanic (% change since 2000)
Races - Native Hawaiian and Other Pacific Islander alone (%)
Races - Native Hawaiian and Other Pacific Islander alone (% change since 2000)
Races - Two or more races(%)
Races - Two or more races(% change since 2000)
Races - Other race alone (%)
Races - Other race alone (% change since 2000)
Racial diversity
Place of birth - Born in state of residence (%)
Place of birth - Born in state of residence (%) - White
Place of birth - Born in state of residence (%) - Black or African American
Place of birth - Born in state of residence (%) - Asian
Place of birth - Born in state of residence (%) - Hispanic or Latino
Place of birth - Born in state of residence (%) - American Indian and Alaska Native
Place of birth - Born in state of residence (%) - Multirace
Place of birth - Born in state of residence (%) - Other Race
Place of birth - Born in other state (%)
Place of birth - Born in other state (%) - White
Place of birth - Born in other state (%) - Black or African American
Place of birth - Born in other state (%) - Asian
Place of birth - Born in other state (%) - Hispanic or Latino
Place of birth - Born in other state (%) - American Indian and Alaska Native
Place of birth - Born in other state (%) - Multirace
Place of birth - Born in other state (%) - Other Race
Place of birth - Native, outside of US (%)
Place of birth - Native, outside of US (%) - White
Place of birth - Native, outside of US (%) - Black or African American
Place of birth - Native, outside of US (%) - Asian
Place of birth - Native, outside of US (%) - Hispanic or Latino
Place of birth - Native, outside of US (%) - American Indian and Alaska Native
Place of birth - Native, outside of US (%) - Multirace
Place of birth - Native, outside of US (%) - Other Race
Place of birth - Foreign born (%)
Place of birth - Foreign born (%) - White
Place of birth - Foreign born (%) - Black or African American
Place of birth - Foreign born (%) - Asian
Place of birth - Foreign born (%) - Hispanic or Latino
Place of birth - Foreign born (%) - American Indian and Alaska Native
Place of birth - Foreign born (%) - Multirace
Place of birth - Foreign born (%) - Other Race
Residents speaking English at home (%)
Residents speaking English at home - Born in the United States (%)
Residents speaking English at home - Native, born elsewhere (%)
Residents speaking English at home - Foreign born (%)
Residents speaking Spanish at home (%)
Residents speaking Spanish at home - Born in the United States (%)
Residents speaking Spanish at home - Native, born elsewhere (%)
Residents speaking Spanish at home - Foreign born (%)
Residents speaking other language at home (%)
Residents speaking other language at home - Born in the United States (%)
Residents speaking other language at home - Native, born elsewhere (%)
Residents speaking other language at home - Foreign born (%)
Marital status - Never married (%)
Marital status - Now married (%)
Marital status - Separated (%)
Marital status - Widowed (%)
Marital status - Divorced (%)
Ancestries Reported - Arab (%)
Ancestries Reported - Czech (%)
Ancestries Reported - Danish (%)
Ancestries Reported - Dutch (%)
Ancestries Reported - English (%)
Ancestries Reported - French (%)
Ancestries Reported - French Canadian (%)
Ancestries Reported - German (%)
Ancestries Reported - Greek (%)
Ancestries Reported - Hungarian (%)
Ancestries Reported - Irish (%)
Ancestries Reported - Italian (%)
Ancestries Reported - Lithuanian (%)
Ancestries Reported - Norwegian (%)
Ancestries Reported - Polish (%)
Ancestries Reported - Portuguese (%)
Ancestries Reported - Russian (%)
Ancestries Reported - Scotch-Irish (%)
Ancestries Reported - Scottish (%)
Ancestries Reported - Slovak (%)
Ancestries Reported - Subsaharan African (%)
Ancestries Reported - Swedish (%)
Ancestries Reported - Swiss (%)
Ancestries Reported - Ukrainian (%)
Ancestries Reported - United States (%)
Ancestries Reported - Welsh (%)
Ancestries Reported - West Indian (%)
Ancestries Reported - Other (%)
Geographical mobility - Same house 1 year ago (%)
Geographical mobility - Same house 1 year ago (%) - White
Geographical mobility - Same house 1 year ago (%) - Black or African American
Geographical mobility - Same house 1 year ago (%) - Asian
Geographical mobility - Same house 1 year ago (%) - Hispanic or Latino
Geographical mobility - Same house 1 year ago (%) - American Indian and Alaska Native
Geographical mobility - Same house 1 year ago (%) - Multirace
Geographical mobility - Same house 1 year ago (%) - Other Race
Geographical mobility - Moved within same county (%)
Geographical mobility - Moved within same county (%) - White
Geographical mobility - Moved within same county (%) - Black or African American
Geographical mobility - Moved within same county (%) - Asian
Geographical mobility - Moved within same county (%) - Hispanic or Latino
Geographical mobility - Moved within same county (%) - American Indian and Alaska Native
Geographical mobility - Moved within same county (%) - Multirace
Geographical mobility - Moved within same county (%) - Other Race
Geographical mobility - Moved from different county within same state (%)
Geographical mobility - Moved from different county within same state (%) - White
Geographical mobility - Moved from different county within same state (%) - Black or African American
Geographical mobility - Moved from different county within same state (%) - Asian
Geographical mobility - Moved from different county within same state (%) - Hispanic or Latino
Geographical mobility - Moved from different county within same state (%) - American Indian and Alaska Native
Geographical mobility - Moved from different county within same state (%) - Multirace
Geographical mobility - Moved from different county within same state (%) - Other Race
Geographical mobility - Moved from different state (%)
Geographical mobility - Moved from different state (%) - White
Geographical mobility - Moved from different state (%) - Black or African American
Geographical mobility - Moved from different state (%) - Asian
Geographical mobility - Moved from different state (%) - Hispanic or Latino
Geographical mobility - Moved from different state (%) - American Indian and Alaska Native
Geographical mobility - Moved from different state (%) - Multirace
Geographical mobility - Moved from different state (%) - Other Race
Geographical mobility - Moved from abroad (%)
Geographical mobility - Moved from abroad (%) - White
Geographical mobility - Moved from abroad (%) - Black or African American
Geographical mobility - Moved from abroad (%) - Asian
Geographical mobility - Moved from abroad (%) - Hispanic or Latino
Geographical mobility - Moved from abroad (%) - American Indian and Alaska Native
Geographical mobility - Moved from abroad (%) - Multirace
Geographical mobility - Moved from abroad (%) - Other Race
Place of birth for the foreign-born population - Ireland (%)
Place of birth for the foreign-born population - Denmark (%)
Place of birth for the foreign-born population - Norway (%)
Place of birth for the foreign-born population - Sweden (%)
Place of birth for the foreign-born population - United Kingdom (%)
Place of birth for the foreign-born population - England (%)
Place of birth for the foreign-born population - Scotland (%)
Place of birth for the foreign-born population - Other Northern Europe (%)
Place of birth for the foreign-born population - Austria (%)
Place of birth for the foreign-born population - Belgium (%)
Place of birth for the foreign-born population - France (%)
Place of birth for the foreign-born population - Germany (%)
Place of birth for the foreign-born population - Netherlands (%)
Place of birth for the foreign-born population - Switzerland (%)
Place of birth for the foreign-born population - Other Western Europe (%)
Place of birth for the foreign-born population - Greece (%)
Place of birth for the foreign-born population - Italy (%)
Place of birth for the foreign-born population - Portugal (%)
Place of birth for the foreign-born population - Spain (%)
Place of birth for the foreign-born population - Other Southern Europe (%)
Place of birth for the foreign-born population - Albania (%)
Place of birth for the foreign-born population - Belarus (%)
Place of birth for the foreign-born population - Bosnia and Herzegovina (%)
Place of birth for the foreign-born population - Bulgaria (%)
Place of birth for the foreign-born population - Croatia (%)
Place of birth for the foreign-born population - Czechoslovakia (%)
Place of birth for the foreign-born population - Hungary (%)
Place of birth for the foreign-born population - Latvia (%)
Place of birth for the foreign-born population - Lithuania (%)
Place of birth for the foreign-born population - North Macedonia (Macedonia) (%)
Place of birth for the foreign-born population - Moldova (%)
Place of birth for the foreign-born population - Poland (%)
Place of birth for the foreign-born population - Romania (%)
Place of birth for the foreign-born population - Russia (%)
Place of birth for the foreign-born population - Serbia (%)
Place of birth for the foreign-born population - Ukraine (%)
Place of birth for the foreign-born population - Other Eastern Europe (%)
Place of birth for the foreign-born population - China (%)
Place of birth for the foreign-born population - Hong Kong (%)
Place of birth for the foreign-born population - Taiwan (%)
Place of birth for the foreign-born population - Japan (%)
Place of birth for the foreign-born population - Korea (%)
Place of birth for the foreign-born population - Other Eastern Asia (%)
Place of birth for the foreign-born population - Afghanistan (%)
Place of birth for the foreign-born population - Bangladesh (%)
Place of birth for the foreign-born population - India (%)
Place of birth for the foreign-born population - Iran (%)
Place of birth for the foreign-born population - Kazakhstan (%)
Place of birth for the foreign-born population - Nepal (%)
Place of birth for the foreign-born population - Pakistan (%)
Place of birth for the foreign-born population - Sri Lanka (%)
Place of birth for the foreign-born population - Uzbekistan (%)
Place of birth for the foreign-born population - Other South Central Asia (%)
Place of birth for the foreign-born population - Burma (%)
Place of birth for the foreign-born population - Cambodia (%)
Place of birth for the foreign-born population - Indonesia (%)
Place of birth for the foreign-born population - Laos (%)
Place of birth for the foreign-born population - Malaysia (%)
Place of birth for the foreign-born population - Philippines (%)
Place of birth for the foreign-born population - Singapore (%)
Place of birth for the foreign-born population - Thailand (%)
Place of birth for the foreign-born population - Vietnam (%)
Place of birth for the foreign-born population - Other South Eastern Asia (%)
Place of birth for the foreign-born population - Armenia (%)
Place of birth for the foreign-born population - Iraq (%)
Place of birth for the foreign-born population - Israel (%)
Place of birth for the foreign-born population - Jordan (%)
Place of birth for the foreign-born population - Kuwait (%)
Place of birth for the foreign-born population - Lebanon (%)
Place of birth for the foreign-born population - Saudi Arabia (%)
Place of birth for the foreign-born population - Syria (%)
Place of birth for the foreign-born population - Turkey (%)
Place of birth for the foreign-born population - Yemen (%)
Place of birth for the foreign-born population - Other Western Asia (%)
Place of birth for the foreign-born population - Eritrea (%)
Place of birth for the foreign-born population - Ethiopia (%)
Place of birth for the foreign-born population - Kenya (%)
Place of birth for the foreign-born population - Somalia (%)
Place of birth for the foreign-born population - Uganda (%)
Place of birth for the foreign-born population - Zimbabwe (%)
Place of birth for the foreign-born population - Other Eastern Africa (%)
Place of birth for the foreign-born population - Cameroon (%)
Place of birth for the foreign-born population - Congo (%)
Place of birth for the foreign-born population - Democratic Republic of Congo (Zaire) (%)
Place of birth for the foreign-born population - Other Middle Africa (%)
Place of birth for the foreign-born population - Egypt (%)
Place of birth for the foreign-born population - Morocco (%)
Place of birth for the foreign-born population - Sudan (%)
Place of birth for the foreign-born population - Other Northern Africa (%)
Place of birth for the foreign-born population - South Africa (%)
Place of birth for the foreign-born population - Other Southern Africa (%)
Place of birth for the foreign-born population - Cabo Verde (%)
Place of birth for the foreign-born population - Ghana (%)
Place of birth for the foreign-born population - Liberia (%)
Place of birth for the foreign-born population - Nigeria (%)
Place of birth for the foreign-born population - Senegal (%)
Place of birth for the foreign-born population - Sierra Leone (%)
Place of birth for the foreign-born population - Other Western Africa (%)
Place of birth for the foreign-born population - Australia (%)
Place of birth for the foreign-born population - New Zealand (%)
Place of birth for the foreign-born population - Fiji (%)
Place of birth for the foreign-born population - Micronesia (%)
Place of birth for the foreign-born population - Bahamas (%)
Place of birth for the foreign-born population - Barbados (%)
Place of birth for the foreign-born population - Cuba (%)
Place of birth for the foreign-born population - Dominica (%)
Place of birth for the foreign-born population - Dominican Republic (%)
Place of birth for the foreign-born population - Grenada (%)
Place of birth for the foreign-born population - Haiti (%)
Place of birth for the foreign-born population - Jamaica (%)
Place of birth for the foreign-born population - St. Vincent and the Grenadines (%)
Place of birth for the foreign-born population - Trinidad and Tobago (%)
Place of birth for the foreign-born population - West Indies (%)
Place of birth for the foreign-born population - Other Caribbean (%)
Place of birth for the foreign-born population - Belize (%)
Place of birth for the foreign-born population - Costa Rica (%)
Place of birth for the foreign-born population - El Salvador (%)
Place of birth for the foreign-born population - Guatemala (%)
Place of birth for the foreign-born population - Honduras (%)
Place of birth for the foreign-born population - Mexico (%)
Place of birth for the foreign-born population - Nicaragua (%)
Place of birth for the foreign-born population - Panama (%)
Place of birth for the foreign-born population - Other Central America (%)
Place of birth for the foreign-born population - Argentina (%)
Place of birth for the foreign-born population - Bolivia (%)
Place of birth for the foreign-born population - Brazil (%)
Place of birth for the foreign-born population - Chile (%)
Place of birth for the foreign-born population - Colombia (%)
Place of birth for the foreign-born population - Ecuador (%)
Place of birth for the foreign-born population - Guyana (%)
Place of birth for the foreign-born population - Peru (%)
Place of birth for the foreign-born population - Uruguay (%)
Place of birth for the foreign-born population - Venezuela (%)
Place of birth for the foreign-born population - Other South America (%)
Place of birth for the foreign-born population - Canada (%)
Place of birth for the foreign-born population - Other Northern America (%)
Place of birth for the foreign-born population - Other (%)
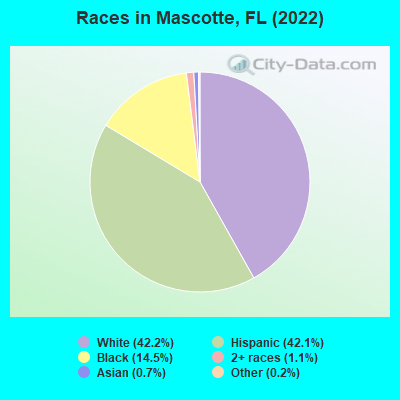
According to 2022 data, the most numerous races in Mascotte, FL are White alone (3,128 residents), Hispanic (3,120 residents), and Black alone (1,075 residents). 63.7% of Mascotte residents speak English at home. 9.5% of Mascotte, FL residents are foreign-born (9.2% born in Latin America), which is 121.9% less than the foreign-born rate of 21.0% across the entire state of Florida.
Race distribution in Mascotte
2000 2022
10,458,509 65.4% White alone 2,682,715 16.8% Hispanic 2,264,268 14.2% Black alone 261,693 1.6% Asian alone 236,954 1.5% Two or more races 42,358 0.3% American Indian alone 28,994 0.2% Other race alone 6,887 0.04% Native Hawaiian and Other
11,309,403 50.8% White alone 6,025,039 27.1% Hispanic 3,241,015 14.6% Black alone 861,630 3.9% Two or more races 623,692 2.8% Asian alone 152,054 0.7% Other race alone 22,504 0.1% American Indian alone 9,486 0.04% Native Hawaiian and Other
Income and house value in Mascotte Median household income in 2022 $66,587 White non-Hispanic householders$93,800 Black householders$56,587 Two or more races householders$65,081 Hispanic or Latino race householdersMedian 2022 house value $298,194 White Non-Hispanic householders$265,365 Black or African American householders$283,343 Some other race householders$263,802 Two or more races householders$279,826 Hispanic or Latino householders
Median age by race in Mascotte
30.2 Median age for White residents33.2 27.7 34.5 Median age for Black or African American residents35.9 41.4 -654,353,561.4 Median age for American Indian / Alaska Native residents-665,012,406.3 -591,194,968.0 35.9 Median age for Asian residents-738,211,381.4 35.9 -679,849,340.2 Median age for Native Hawaiian / Pacific Islander residents-858,307,848.3 -443,298,968.6 27.0 Median age for Other race residents37.3 24.1 31.6 Median age for Two or more races residents27.7 32.7 29.2 Median age for White alone residents29.1 29.3 30.7 Median age for Hispanic or Latino residents29.8 30.4
Owner/renter occupied households by race in Mascotte
House owners and renters - White residents 1,011 78.3% Owner occupied281 21.7% Renter occupiedHouse owners and renters - Black or African American residents 355 78.5% Owner occupied97 21.5% Renter occupiedHouse owners and renters - Asian residents 6 100.0% Owner occupiedHouse owners and renters - Other race residents 47 60.8% Owner occupied30 39.2% Renter occupiedHouse owners and renters - Two or more races residents 305 52.7% Owner occupied274 47.3% Renter occupiedHouse owners and renters - White alone residents 724 77.0% Owner occupied216 23.0% Renter occupiedHouse owners and renters - Hispanic or Latino residents 643 67.0% Owner occupied317 33.0% Renter occupied
Language usage in Mascotte
English speakers - Total 63.7% of residents of Mascotte speak English at home.
38.9% of residents speak Spanish at home 2,145 81.2% Speak English very well496 18.8% Speak English less than very well0.2% of residents speak other language at home 8 57.1% Speak English very well6 42.9% Speak English less than very well
English speakers - Born in the United States 66.3% of residents of Mascotte speak English at home.
38.5% of residents speak Spanish at home 665 91.6% Speak English very well61 8.4% Speak English less than very well
English speakers - Native, born elsewhere 18.0% of residents of Mascotte speak English at home.
80.0% of residents speak Spanish at home 402 84.6% Speak English very well73 15.4% Speak English less than very well
English speakers - Foreign-born 25.3% of residents of Mascotte speak English at home.
70.8% of residents speak Spanish at home 153 33.3% Speak English very well306 66.7% Speak English less than very well2.3% of residents speak other language at home 9 60.0% Speak English very well6 40.0% Speak English less than very well
White (Caucasian) - Speak only English Native:
77.2% (2,876)Foreign-born:
20.7% (25)
White (Caucasian) - Speak another language Native:
20.8% (775)Foreign-born:
95.1% (116)
Black or African American - Speak only English Native:
97.7% (1,057)Foreign-born:
94.5% (98)
Other race - Speak only English Native:
7.5% (12)Foreign-born:
5.4% (8)
Other race - Speak another language Native:
87.2% (144)Foreign-born:
92.2% (142)
Two or more races - Speak only English Native:
11.6% (167)Foreign-born:
2.9% (8)
Two or more races - Speak another language Native:
83.3% (1,196)Foreign-born:
100.0% (256)
White alone - Speak only English Native:
97.8% (2,741)Foreign-born:
100.0% (2)
Hispanic or Latino - Speak only English Native:
15.1% (369)Foreign-born:
5.8% (29)
Hispanic or Latino - Speak another language Native:
88.8% (2,178)Foreign-born:
95.3% (480)
Foreign-born residents in Mascotte 701 residents are foreign born (9.2% Latin America ).
This city:
9.5%Florida:
21.1%
Marital status for residents in Mascotte Marital status - White (Caucasian) population 15 years and over
Males 33.2% Never married61.6% Now married0.2% Separated0.7% Widowed4.2% DivorcedFemales 29.8% Never married55.8% Now married0.2% Separated5.8% Widowed8.3% DivorcedWomen who gave birth in the past 12 months Now married:
79.5% (92)Unmarried:
20.5% (24)
Women who did not give birth in the past 12 months Now married:
61.5% (709)Unmarried:
38.5% (443)
Marital status - Black or African American population 15 years and over
Males 28.0% Never married47.4% Now married0.3% Separated2.3% Widowed22.0% DivorcedFemales 29.8% Never married69.6% Now married0.6% Separated0.0% Widowed0.0% DivorcedWomen who did not give birth in the past 12 months Now married:
79.5% (231)Unmarried:
20.5% (59)
Marital status - Asian population 15 years and over
Males 0.0% Never married100.0% Now married0.0% Separated0.0% Widowed0.0% DivorcedFemales 0.0% Never married100.0% Now married0.0% Separated0.0% Widowed0.0% DivorcedWomen who gave birth in the past 12 months Now married:
100.0% (6)Unmarried:
0.0% (0)
Women who did not give birth in the past 12 months Now married:
100.0% (9)Unmarried:
0.0% (0)
Marital status - Other race population 15 years and over
Males 9.7% Never married90.3% Now married0.0% Separated0.0% Widowed0.0% DivorcedFemales 20.8% Never married79.2% Now married0.0% Separated0.0% Widowed0.0% DivorcedWomen who did not give birth in the past 12 months Now married:
75.6% (141)Unmarried:
24.4% (46)
Marital status - Two or more races population 15 years and over
Males 54.6% Never married39.7% Now married0.0% Separated0.0% Widowed5.7% DivorcedFemales 26.0% Never married33.1% Now married27.1% Separated4.6% Widowed9.2% DivorcedWomen who gave birth in the past 12 months Now married:
100.0% (10)Unmarried:
0.0% (0)
Women who did not give birth in the past 12 months Now married:
59.9% (277)Unmarried:
40.1% (186)
Marital status - White alone, not Hispanic / Latino population 15 years and over
Males 36.4% Never married56.8% Now married0.3% Separated1.0% Widowed5.4% DivorcedFemales 29.1% Never married54.7% Now married0.4% Separated6.0% Widowed9.9% DivorcedWomen who gave birth in the past 12 months Now married:
65.8% (49)Unmarried:
34.2% (26)
Women who did not give birth in the past 12 months Now married:
64.4% (532)Unmarried:
35.6% (294)
Marital status - Hispanic or Latino population 15 years and over
Males 40.7% Never married55.9% Now married0.0% Separated0.0% Widowed3.4% DivorcedFemales 27.3% Never married49.8% Now married12.1% Separated4.7% Widowed6.1% DivorcedWomen who gave birth in the past 12 months Now married:
100.0% (65)Unmarried:
0.0% (0)
Women who did not give birth in the past 12 months Now married:
60.8% (575)Unmarried:
39.2% (371)
Ancestries in Mascotte
1,590 29.5% American348 6.5% Irish155 2.9% English67 1.2% Guyanese41 0.8% British West Indian30 0.6% Canadian12 0.2% German11 0.2% European7 0.1% Trinidadian and Tobagonian
Children Nativity (place of birth) in Mascotte
Children under 6 years - Living with two parents Both parents native 609 100.0% NativeBoth parents foreign-born 38 100.0% NativeOne native, one foreign-born parent 78 91.2% Native8 8.8% Foreign-bornChildren under 6 years - Living with one parent Native parent 49 100.0% Native
Children 6 to 17 years - Living with two parents Both parents native 947 100.0% NativeBoth parents foreign-born 128 100.0% NativeOne native, one foreign-born parent 98 100.0% NativeChildren 6 to 17 years - Living with one parent Native parent 343 100.0% Native
Grandparents responsible for own grandchildren in Mascotte
Grandparents (30 to 59 years) White / Caucasian 33 100.0% Not responsible for grandchildrenOther race 20 100.0% Not responsible for grandchildrenWhite alone, not Hispanic / Latino 37 100.0% Not responsible for grandchildrenHispanic or Latino 15 100.0% Not responsible for grandchildrenGrandparents (60 years and over) White / Caucasian 25 79.6% Responsible for grandchildren7 20.4% Not responsible for grandchildrenOther race 20 100.0% Not responsible for grandchildrenWhite alone, not Hispanic / Latino 28 100.0% Responsible for grandchildrenHispanic or Latino 25 100.0% Not responsible for grandchildren