Races in Martell, Wisconsin (WI) Detailed Stats
Ancestries, Foreign-born residents, place of birth

Discuss Martell, Wisconsin races on our local forum with over 2,400,000 registered users
0.8% of Martell, WI residents are foreign-born , which is 494.4% less than the foreign-born rate of 5.0% across the entire state of Wisconsin.
Race distribution in Martell

- 1,06099.1%White alone
- 30.3%Hispanic
- 30.3%Asian alone
- 20.2%Black alone
- 20.2%Two or more races

2000
2022
-
- 4,681,63087.3%White alone
- 300,2455.6%Black alone
- 192,9213.6%Hispanic
- 87,9951.6%Asian alone
- 51,9211.0%Two or more races
- 43,9800.8%American Indian alone
- 3,6370.07%Other race alone
- 1,3460.03%Native Hawaiian and Other
Pacific Islander alone

-
- 4,654,03179.0%White alone
- 447,0227.6%Hispanic
- 345,6785.9%Black alone
- 217,5323.7%Two or more races
- 172,2422.9%Asian alone
- 33,7620.6%American Indian alone
- 19,6800.3%Other race alone
- 2,5920.04%Native Hawaiian and Other
Pacific Islander alone

Income and house value in Martell
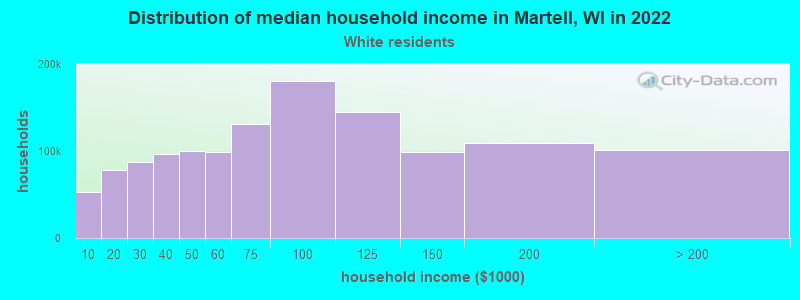
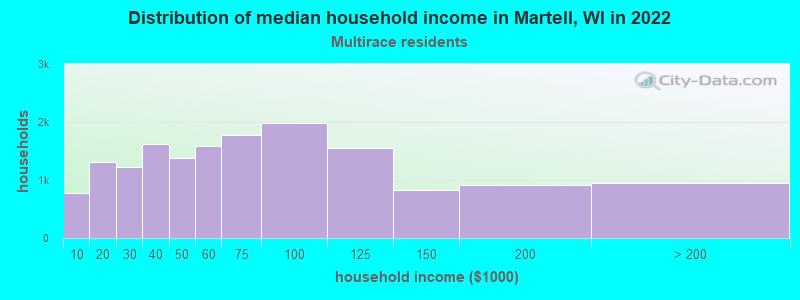
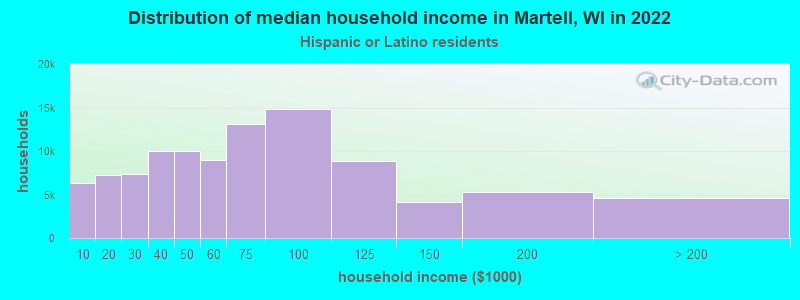
- Median household income in 2022
- $92,680White non-Hispanic householders
- $14,788Two or more races householders
- $92,950Hispanic or Latino race householders
- Median 2022 house value
- $268,810White Non-Hispanic householders
Household income for White non-Hispanic householders
Household income for Two or more races householders
Household income for Hispanic or Latino race householders
Foreign-born residents in Martell
9 residents are foreign born
| This city: | 0.8% |
| Wisconsin: | 3.6% |
Ancestries in Martell

- 45230.7%German
- 27919.0%Norwegian
- 1399.5%Irish
- 1308.8%Swedish
- 875.9%English
- 745.0%Other
- 674.6%French
- 352.4%Polish
- 342.3%Italian
- 292.0%Czech
- 281.9%Scotch-Irish
- 241.6%United States
- 201.4%Danish
- 161.1%Scottish
- 120.8%Dutch
- 110.7%Hungarian
- 80.5%Swiss
- 80.5%Welsh
- 70.5%French Canadian
- 40.3%Russian
- 30.2%Lithuanian
- 30.2%Portuguese

Zip codes: 54003.