Races in Marion, North Carolina (NC) Detailed Stats
Ancestries, Foreign-born residents, place of birth
Settings
X


Recent posts about races in Marion, North Carolina on our local forum with over 2,400,000 registered users:

Latest news about races in Marion, NC collected exclusively by city-data.com from local newspapers, TV, and radio stations
According to 2022 data, the most numerous races in Marion, NC are White alone (4,744 residents), Black alone (887 residents), and Hispanic (1,487 residents). 77.1% of Marion residents speak English at home. 15.1% of Marion, NC residents are foreign-born (10.6% born in Latin America, 3.6% born in Asia), which is 46.9% greater than the foreign-born rate of 8.0% across the entire state of North Carolina.
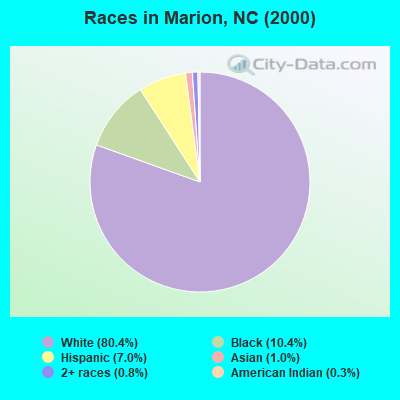
Race distribution in Marion
2000
2022

- 3,97280.4%White alone
- 51310.4%Black alone
- 3487.0%Hispanic
- 511.0%Asian alone
- 390.8%Two or more races
- 140.3%American Indian alone
- 40.08%Other race alone
- 20.04%Native Hawaiian and Other
Pacific Islander alone
-
- 4,74460.7%White alone
- 1,48719.0%Hispanic
- 88711.3%Black alone
- 3714.7%Asian alone
- 2222.8%Two or more races
- 1121.4%American Indian alone
- 100.1%Other race alone

2000
2022
-
- 5,647,15570.2%White alone
- 1,723,30121.4%Black alone
- 378,9634.7%Hispanic
- 112,4161.4%Asian alone
- 95,3331.2%American Indian alone
- 79,9651.0%Two or more races
- 9,0150.1%Other race alone
- 3,1650.04%Native Hawaiian and Other
Pacific Islander alone

-
- 6,497,51960.7%White alone
- 2,155,65020.1%Black alone
- 1,114,79910.4%Hispanic
- 438,0614.1%Two or more races
- 341,0523.2%Asian alone
- 91,7580.9%American Indian alone
- 50,1800.5%Other race alone
- 9,9540.09%Native Hawaiian and Other
Pacific Islander alone

Income and house value in Marion
- Median household income in 2022
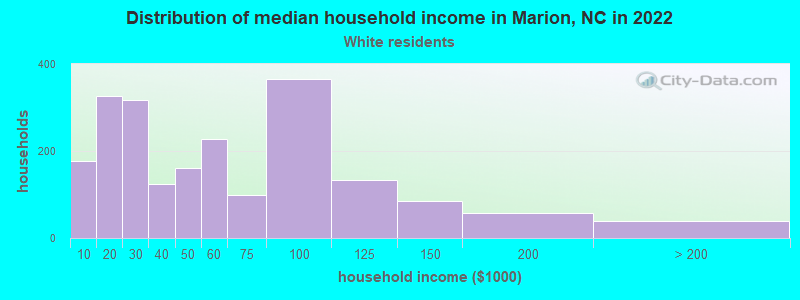
- $42,956White non-Hispanic householders
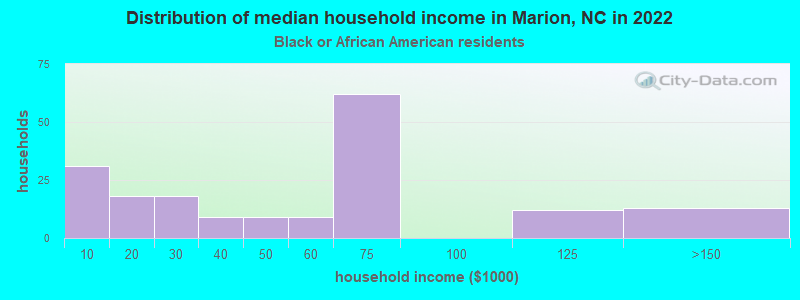
- $52,711Black householders
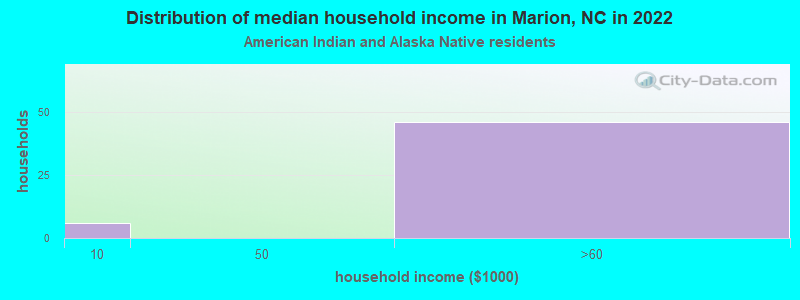
- $58,202American Indian and Alaska Native householders
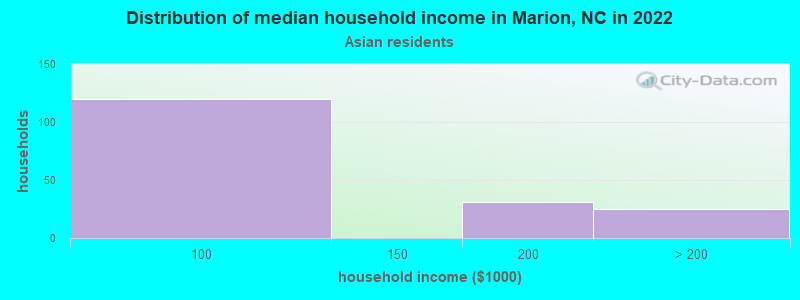
- $92,950Asian householders
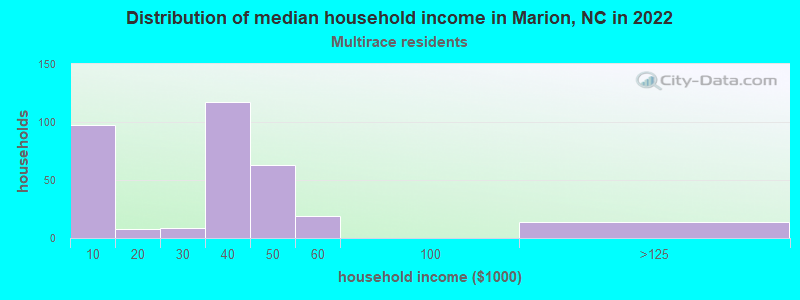
- $31,589Two or more races householders
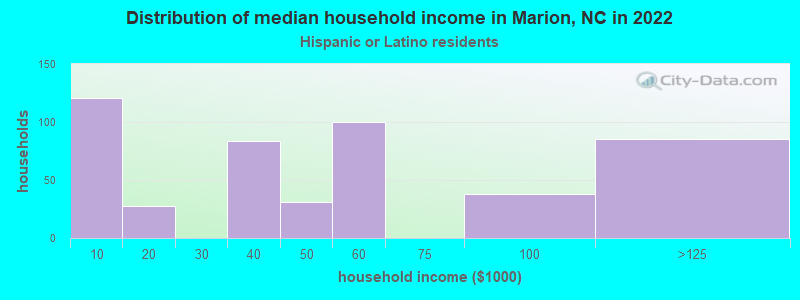
- $49,478Hispanic or Latino race householders
- Median 2022 house value
- $152,609White Non-Hispanic householders
- $104,442Black or African American householders
- $159,735American Indian or Alaska Native householders
- $216,995Asian householders
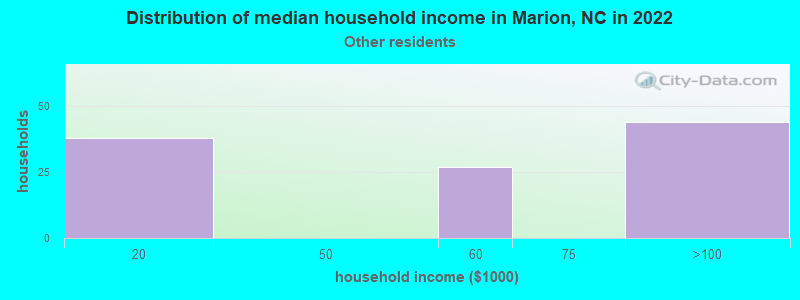
- $133,195Some other race householders
- $147,448Two or more races householders
- $129,017Hispanic or Latino householders
Household income for White non-Hispanic householders
Household income for Black householders
Household income for American Indian and Alaska Native householders
Household income for Asian householders
Household income for Some other race householders
Household income for Two or more races householders
Household income for Hispanic or Latino race householders
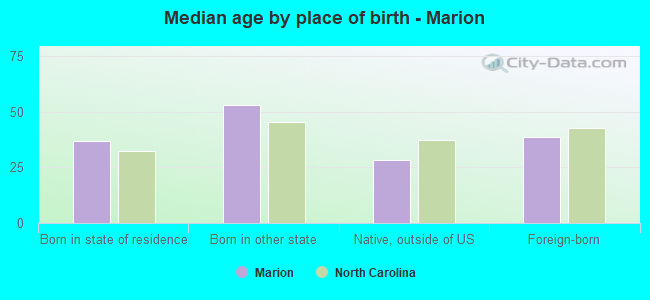
Median age by race in Marion
- 44.8Median age for White residents
- 38.0Males
- 49.1Females
- 38.0Median age for Black or African American residents
- 37.7Males
- 57.3Females
- 42.7Median age for American Indian / Alaska Native residents
- 42.6Males
- -682,971,013.8Females
- 39.4Median age for Asian residents
- 36.2Males
- 40.5Females
- -609,884,331.7Median age for Native Hawaiian / Pacific Islander residents
- -611,708,482.1Males
- -612,403,100.2Females
- 28.7Median age for Other race residents
- 34.1Males
- 15.7Females
- 25.5Median age for Two or more races residents
- 24.1Males
- 30.1Females
- 46.1Median age for White alone residents
- 38.8Males
- 51.8Females
- 29.3Median age for Hispanic or Latino residents
- 29.4Males
- 27.3Females
Owner/renter occupied households by race in Marion
- House owners and renters - White residents
- 1,18755.9%Owner occupied
- 93844.1%Renter occupied
- House owners and renters - Black or African American residents
- 9654.6%Owner occupied
- 8045.4%Renter occupied
- House owners and renters - American Indian / Alaska Native residents
- 3050.4%Owner occupied
- 3049.6%Renter occupied
- House owners and renters - Asian residents
- 5736.3%Owner occupied
- 10063.7%Renter occupied
- House owners and renters - Other race residents
- 5147.1%Owner occupied
- 5852.9%Renter occupied
- House owners and renters - Two or more races residents
- 6520.6%Owner occupied
- 25279.4%Renter occupied
- House owners and renters - White alone residents
- 1,12655.3%Owner occupied
- 91044.7%Renter occupied
- House owners and renters - Hispanic or Latino residents
- 16736.6%Owner occupied
- 28963.4%Renter occupied
Language usage in Marion
- English speakers - Total
- 77.1% of residents of Marion speak English at home.
- 17.5% of residents speak Spanish at home
- 76657.0%Speak English very well
- 57843.0%Speak English less than very well
- 5.6% of residents speak other language at home
- 26762.5%Speak English very well
- 16037.5%Speak English less than very well
- English speakers - Born in the United States
- 91.6% of residents of Marion speak English at home.
- 4.9% of residents speak Spanish at home
- 2544.6%Speak English very well
- 3155.4%Speak English less than very well
- 3.9% of residents speak other language at home
- 45100.0%Speak English very well
- English speakers - Native, born elsewhere
- 26.1% of residents of Marion speak English at home.
- 70.6% of residents speak Spanish at home
- 7184.5%Speak English very well
- 1315.5%Speak English less than very well
- English speakers - Foreign-born
- 4.8% of residents of Marion speak English at home.
- 66.3% of residents speak Spanish at home
- 30939.6%Speak English very well
- 47260.4%Speak English less than very well
- 27.2% of residents speak other language at home
- 16350.9%Speak English very well
- 15749.1%Speak English less than very well
White (Caucasian) - Speak only English
| Native: | 96.4% (4,551) |
| Foreign-born: | 16.0% (34) |
White (Caucasian) - Speak another language
| Native: | 3.3% (153) |
| Foreign-born: | 74.1% (156) |
Black or African American - Speak only English
| Native: | 100.0% (863) |
| Foreign-born: | 100.0% (22) |
American Indian / Alaska Native - Speak another language
| Native: | 48.3% (56) |
| Foreign-born: | 100.0% (44) |
Asian - Speak another language
| Native: | 68.8% (57) |
| Foreign-born: | 100.0% (289) |
Other race - Speak another language
| Native: | 72.1% (164) |
| Foreign-born: | 100.0% (221) |
Two or more races - Speak another language
| Native: | 53.8% (295) |
| Foreign-born: | 100.0% (475) |
White alone - Speak only English
| Native: | 98.9% (4,550) |
| Foreign-born: | 100.0% (30) |
Hispanic or Latino - Speak only English
| Native: | 18.5% (118) |
| Foreign-born: | 0.6% (5) |
Hispanic or Latino - Speak another language
| Native: | 79.9% (512) |
| Foreign-born: | 99.2% (807) |
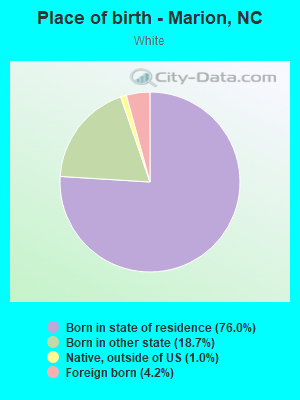
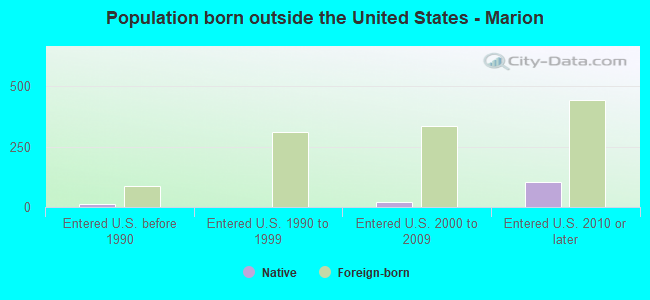
Foreign-born residents in Marion
1,178 residents are foreign born (10.6% Latin America, 3.6% Asia).
| This city: | 15.1% |
| North Carolina: | 8.3% |
Marital status for residents in Marion
Marital status - White (Caucasian) population 15 years and over
- Males
- 40.1%Never married
- 40.6%Now married
- 5.3%Separated
- 4.1%Widowed
- 10.0%Divorced
- Females
- 22.7%Never married
- 45.4%Now married
- 3.1%Separated
- 13.2%Widowed
- 15.5%Divorced
Women who gave birth in the past 12 months
| Now married: | 100.0% (42) |
| Unmarried: | 0.0% (0) |
Women who did not give birth in the past 12 months
| Now married: | 55.5% (529) |
| Unmarried: | 44.5% (423) |
Marital status - Black or African American population 15 years and over
- Males
- 65.4%Never married
- 19.5%Now married
- 1.9%Separated
- 2.2%Widowed
- 10.9%Divorced
- Females
- 38.4%Never married
- 51.0%Now married
- 0.0%Separated
- 0.0%Widowed
- 10.6%Divorced
Women who did not give birth in the past 12 months
| Now married: | 84.2% (48) |
| Unmarried: | 15.8% (9) |
Marital status - American Indian / Alaska Native population 15 years and over
- Males
- 92.0%Never married
- 0.0%Now married
- 0.0%Separated
- 0.0%Widowed
- 8.0%Divorced
- Females
- 0.0%Never married
- 0.0%Now married
- 0.0%Separated
- 78.6%Widowed
- 21.4%Divorced
Marital status - Asian population 15 years and over
- Males
- 49.5%Never married
- 0.0%Now married
- 0.0%Separated
- 0.0%Widowed
- 50.5%Divorced
- Females
- 82.7%Never married
- 0.0%Now married
- 0.0%Separated
- 0.0%Widowed
- 17.3%Divorced
Women who did not give birth in the past 12 months
| Now married: | 0.0% (0) |
| Unmarried: | 100.0% (170) |
Marital status - Other race population 15 years and over
- Males
- 43.1%Never married
- 50.9%Now married
- 6.0%Separated
- 0.0%Widowed
- 0.0%Divorced
- Females
- 44.0%Never married
- 56.0%Now married
- 0.0%Separated
- 0.0%Widowed
- 0.0%Divorced
Women who did not give birth in the past 12 months
| Now married: | 56.0% (103) |
| Unmarried: | 44.0% (81) |
Marital status - Two or more races population 15 years and over
- Males
- 41.1%Never married
- 52.6%Now married
- 0.0%Separated
- 0.0%Widowed
- 6.3%Divorced
- Females
- 41.7%Never married
- 58.3%Now married
- 0.0%Separated
- 0.0%Widowed
- 0.0%Divorced
Women who gave birth in the past 12 months
| Now married: | 0.0% (0) |
| Unmarried: | 100.0% (7) |
Women who did not give birth in the past 12 months
| Now married: | 52.6% (153) |
| Unmarried: | 47.4% (138) |
Marital status - White alone, not Hispanic / Latino population 15 years and over
- Males
- 41.1%Never married
- 38.7%Now married
- 5.7%Separated
- 3.9%Widowed
- 10.6%Divorced
- Females
- 22.0%Never married
- 43.8%Now married
- 2.4%Separated
- 14.6%Widowed
- 17.1%Divorced
Women who did not give birth in the past 12 months
| Now married: | 56.0% (481) |
| Unmarried: | 44.0% (377) |
Marital status - Hispanic or Latino population 15 years and over
- Males
- 36.1%Never married
- 60.3%Now married
- 1.5%Separated
- 2.1%Widowed
- 0.0%Divorced
- Females
- 33.2%Never married
- 63.1%Now married
- 3.7%Separated
- 0.0%Widowed
- 0.0%Divorced
Women who gave birth in the past 12 months
| Now married: | 100.0% (48) |
| Unmarried: | 0.0% (0) |
Women who did not give birth in the past 12 months
| Now married: | 57.7% (266) |
| Unmarried: | 42.3% (194) |
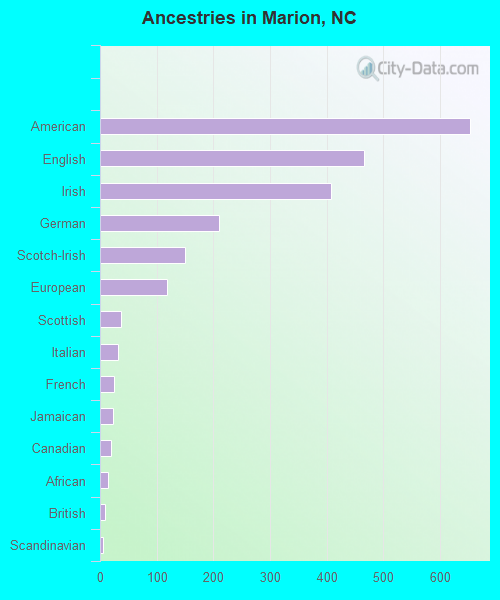
Ancestries in Marion

- 65413.5%American
- 4669.6%English
- 4078.4%Irish
- 2104.3%German
- 1503.1%Scotch-Irish
- 1182.4%European
- 370.8%Scottish
- 320.7%Italian
- 240.5%French
- 230.5%Jamaican
- 190.4%Canadian
- 140.3%African
- 80.2%British
- 60.1%Scandinavian
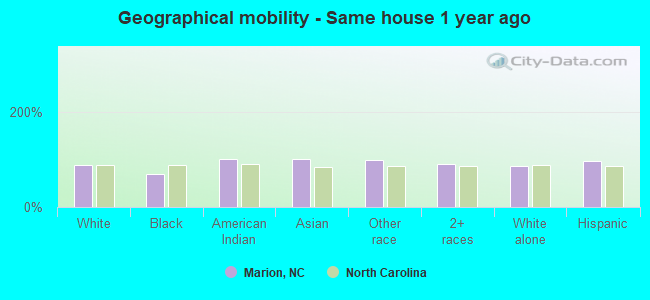
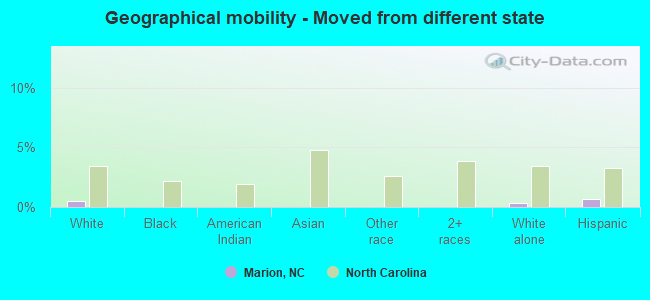
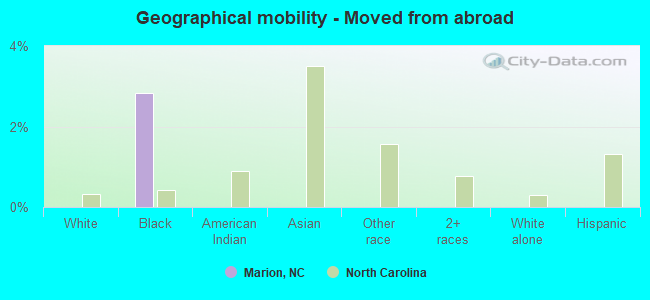
Geographical mobility in Marion

- Same house 1 year ago
- 4,39487.0%White (Caucasian)
- 60968.8%Black or African American
- 156100.0%American Indian / Alaska Native
- 381100.0%Asian
- 45198.2%Other race
- 90590.9%Two or more races
- 4,09186.4%White alone, not Hispanic / Latino
- 1,40596.3%Hispanic or Latino
-
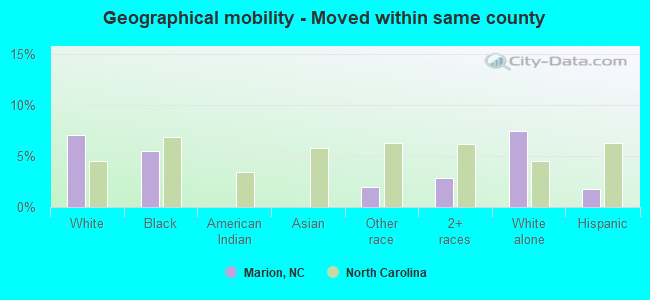
- Moved within same county
- 3577.1%White / Caucasian
- 495.5%Black or African American
- 91.9%Other race
- 282.8%Two or more races
- 3517.4%White alone, not Hispanic / Latino
- 251.7%Hispanic or Latino
-
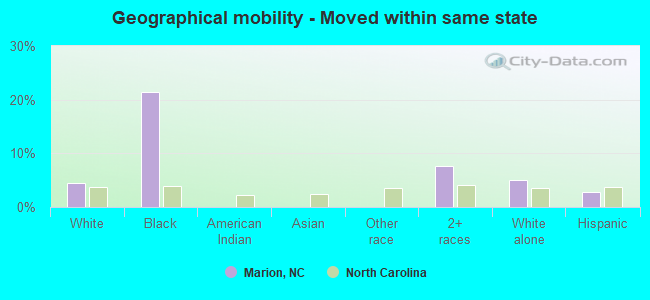
- Moved within same state
- 2284.5%White / Caucasian
- 18921.4%Black or African American
- 767.7%Two or more races
- 2355.0%White alone, not Hispanic / Latino
- 422.8%Hispanic or Latino
-
- Moved from different state
- 250.5%White / Caucasian
- 150.3%White alone, not Hispanic / Latino
- 100.7%Hispanic or Latino
-
- Moved from abroad
- 252.8%Black or African American
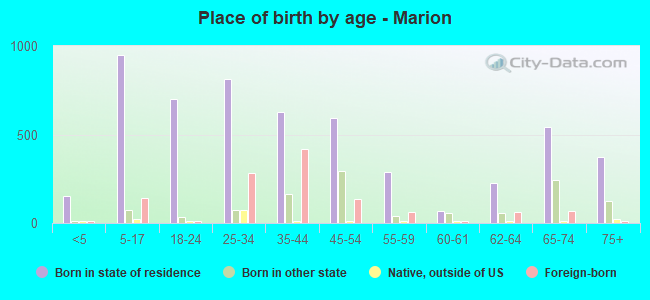
Children Nativity (place of birth) in Marion
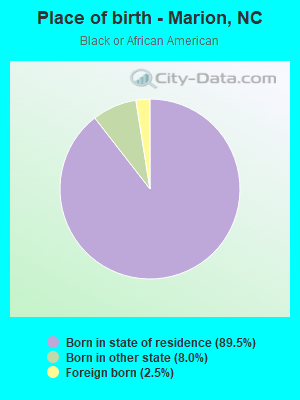
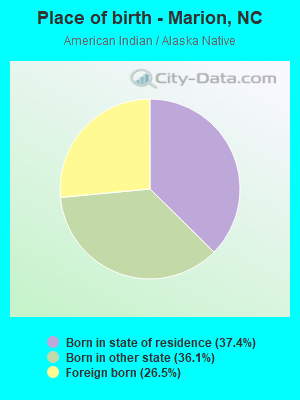
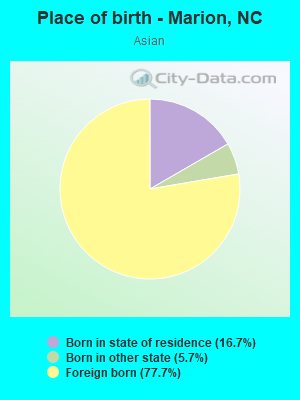
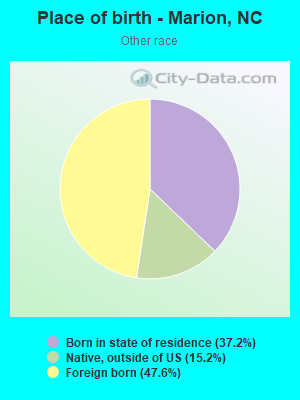
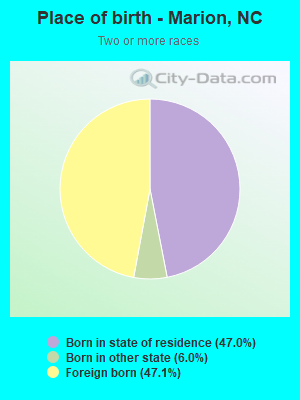
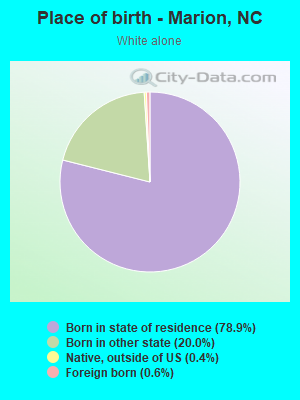
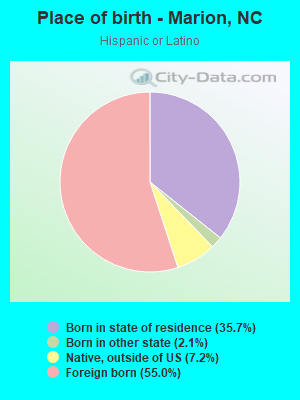
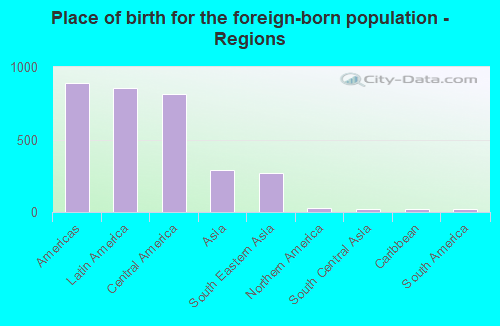
Place of birth for residents in Marion
![Place of birth for the foreign-born population - Regions]()
- 887Americas
- 857Latin America
- 816Central America
- 291Asia
- 268South Eastern Asia
- 29Northern America
- 23South Central Asia
- 21Caribbean
- 20South America
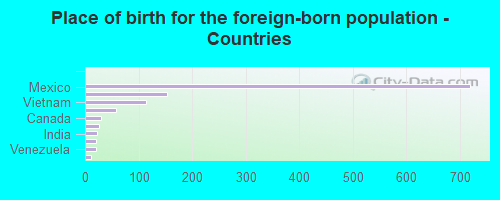
![Place of birth for the foreign-born population - Countries]()
- 719Mexico
- 154Philippines
- 114Vietnam
- 58Costa Rica
- 29Canada
- 27Guatemala
- 23India
- 21Jamaica
- 20Venezuela
- 11El Salvador