Races in Maricopa, Arizona (AZ) Detailed Stats
Data:
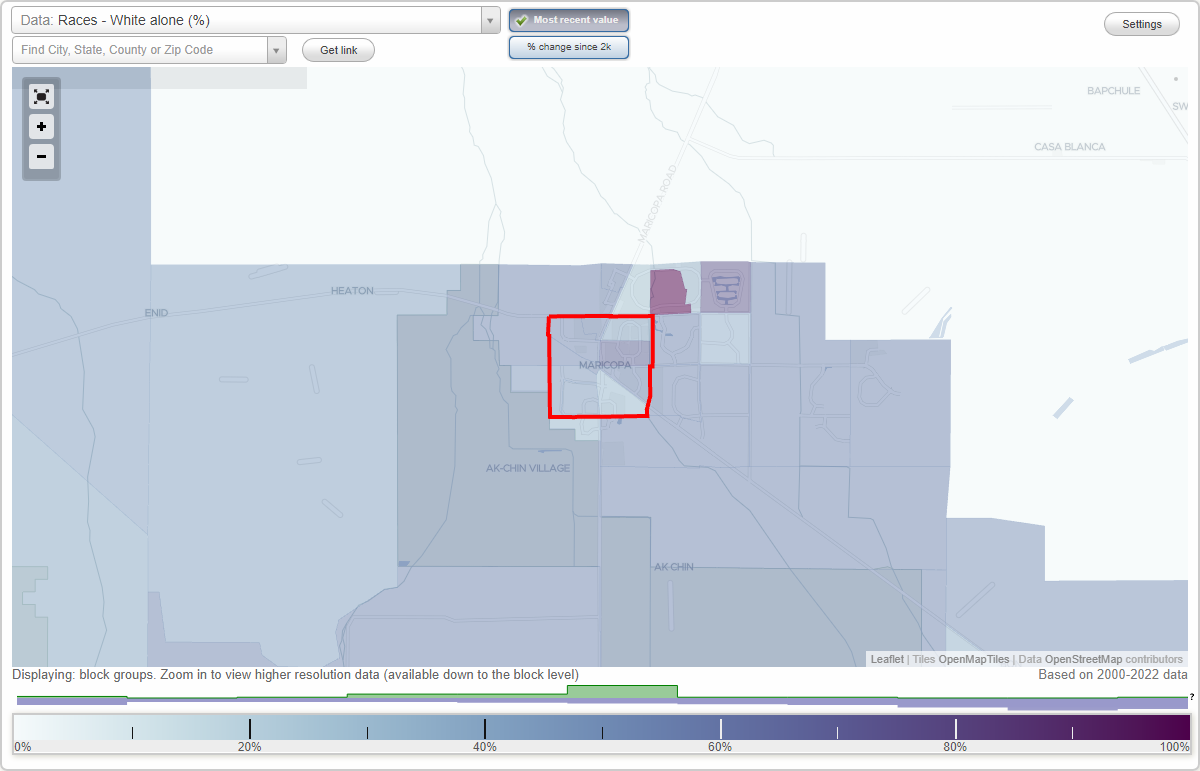
Races - White alone (%)
Races - White alone (% change since 2000)
Races - Black alone (%)
Races - Black alone (% change since 2000)
Races - American Indian alone (%)
Races - American Indian alone (% change since 2000)
Races - Asian alone (%)
Races - Asian alone (% change since 2000)
Races - Hispanic (%)
Races - Hispanic (% change since 2000)
Races - Native Hawaiian and Other Pacific Islander alone (%)
Races - Native Hawaiian and Other Pacific Islander alone (% change since 2000)
Races - Two or more races(%)
Races - Two or more races(% change since 2000)
Races - Other race alone (%)
Races - Other race alone (% change since 2000)
Racial diversity
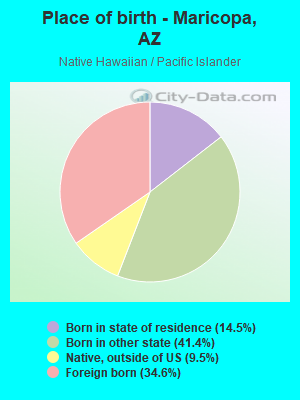
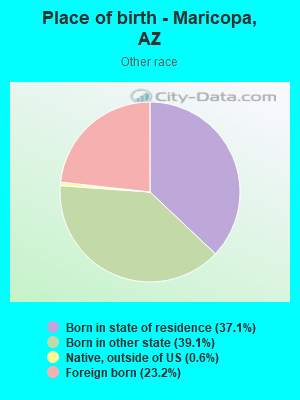
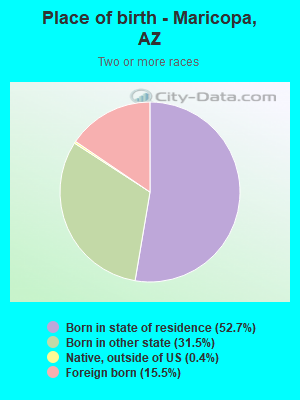
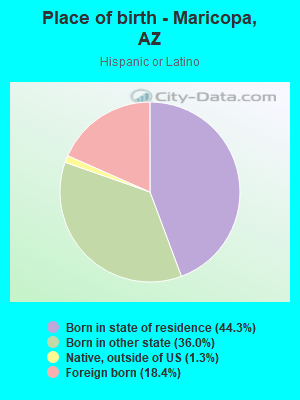
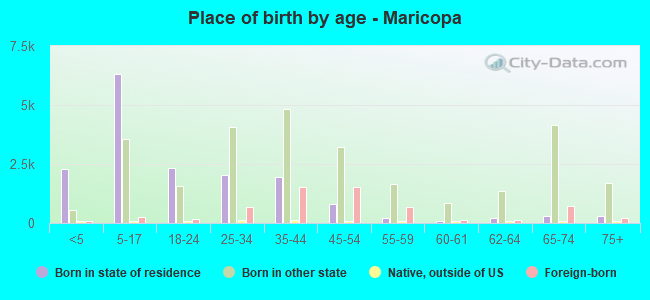
Place of birth - Born in state of residence (%)
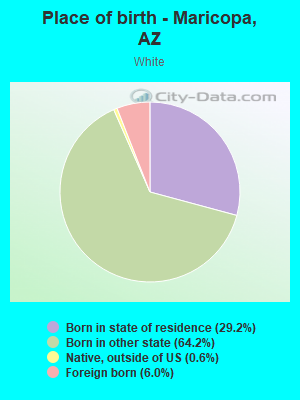
Place of birth - Born in state of residence (%) - White
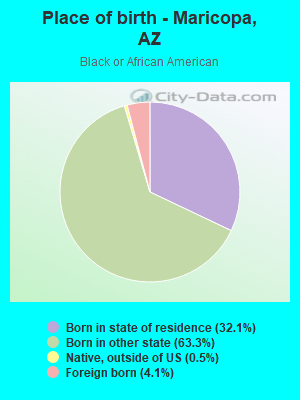
Place of birth - Born in state of residence (%) - Black or African American
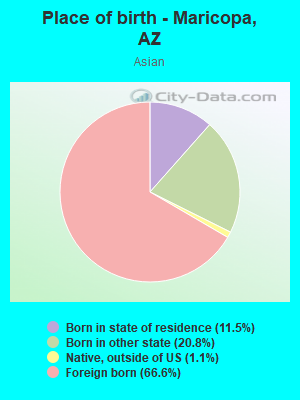
Place of birth - Born in state of residence (%) - Asian
Place of birth - Born in state of residence (%) - Hispanic or Latino
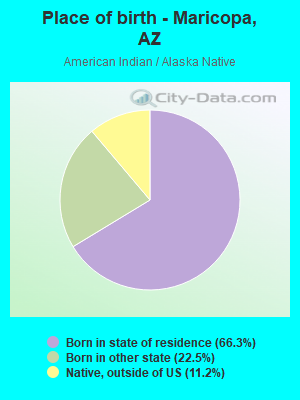
Place of birth - Born in state of residence (%) - American Indian and Alaska Native
Place of birth - Born in state of residence (%) - Multirace
Place of birth - Born in state of residence (%) - Other Race
Place of birth - Born in other state (%)
Place of birth - Born in other state (%) - White
Place of birth - Born in other state (%) - Black or African American
Place of birth - Born in other state (%) - Asian
Place of birth - Born in other state (%) - Hispanic or Latino
Place of birth - Born in other state (%) - American Indian and Alaska Native
Place of birth - Born in other state (%) - Multirace
Place of birth - Born in other state (%) - Other Race
Place of birth - Native, outside of US (%)
Place of birth - Native, outside of US (%) - White
Place of birth - Native, outside of US (%) - Black or African American
Place of birth - Native, outside of US (%) - Asian
Place of birth - Native, outside of US (%) - Hispanic or Latino
Place of birth - Native, outside of US (%) - American Indian and Alaska Native
Place of birth - Native, outside of US (%) - Multirace
Place of birth - Native, outside of US (%) - Other Race
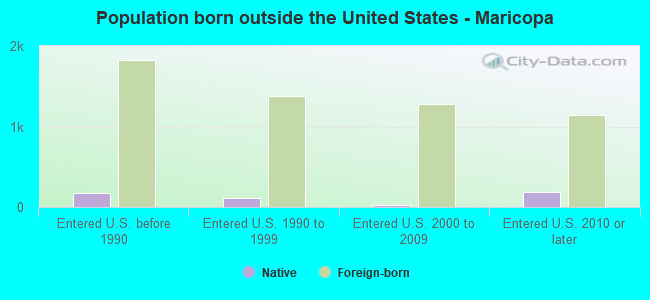
Place of birth - Foreign born (%)
Place of birth - Foreign born (%) - White
Place of birth - Foreign born (%) - Black or African American
Place of birth - Foreign born (%) - Asian
Place of birth - Foreign born (%) - Hispanic or Latino
Place of birth - Foreign born (%) - American Indian and Alaska Native
Place of birth - Foreign born (%) - Multirace
Place of birth - Foreign born (%) - Other Race
Residents speaking English at home (%)
Residents speaking English at home - Born in the United States (%)
Residents speaking English at home - Native, born elsewhere (%)
Residents speaking English at home - Foreign born (%)
Residents speaking Spanish at home (%)
Residents speaking Spanish at home - Born in the United States (%)
Residents speaking Spanish at home - Native, born elsewhere (%)
Residents speaking Spanish at home - Foreign born (%)
Residents speaking other language at home (%)
Residents speaking other language at home - Born in the United States (%)
Residents speaking other language at home - Native, born elsewhere (%)
Residents speaking other language at home - Foreign born (%)
Marital status - Never married (%)
Marital status - Now married (%)
Marital status - Separated (%)
Marital status - Widowed (%)
Marital status - Divorced (%)
Ancestries Reported - Arab (%)
Ancestries Reported - Czech (%)
Ancestries Reported - Danish (%)
Ancestries Reported - Dutch (%)
Ancestries Reported - English (%)
Ancestries Reported - French (%)
Ancestries Reported - French Canadian (%)
Ancestries Reported - German (%)
Ancestries Reported - Greek (%)
Ancestries Reported - Hungarian (%)
Ancestries Reported - Irish (%)
Ancestries Reported - Italian (%)
Ancestries Reported - Lithuanian (%)
Ancestries Reported - Norwegian (%)
Ancestries Reported - Polish (%)
Ancestries Reported - Portuguese (%)
Ancestries Reported - Russian (%)
Ancestries Reported - Scotch-Irish (%)
Ancestries Reported - Scottish (%)
Ancestries Reported - Slovak (%)
Ancestries Reported - Subsaharan African (%)
Ancestries Reported - Swedish (%)
Ancestries Reported - Swiss (%)
Ancestries Reported - Ukrainian (%)
Ancestries Reported - United States (%)
Ancestries Reported - Welsh (%)
Ancestries Reported - West Indian (%)
Ancestries Reported - Other (%)
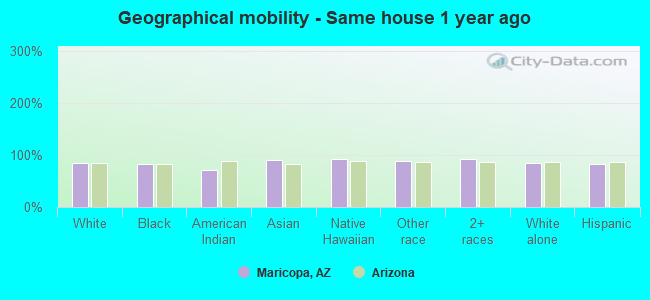
Geographical mobility - Same house 1 year ago (%)
Geographical mobility - Same house 1 year ago (%) - White
Geographical mobility - Same house 1 year ago (%) - Black or African American
Geographical mobility - Same house 1 year ago (%) - Asian
Geographical mobility - Same house 1 year ago (%) - Hispanic or Latino
Geographical mobility - Same house 1 year ago (%) - American Indian and Alaska Native
Geographical mobility - Same house 1 year ago (%) - Multirace
Geographical mobility - Same house 1 year ago (%) - Other Race
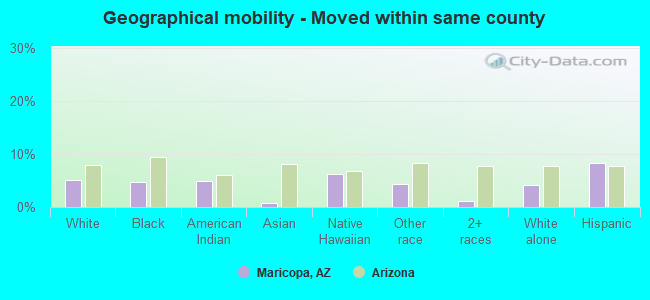
Geographical mobility - Moved within same county (%)
Geographical mobility - Moved within same county (%) - White
Geographical mobility - Moved within same county (%) - Black or African American
Geographical mobility - Moved within same county (%) - Asian
Geographical mobility - Moved within same county (%) - Hispanic or Latino
Geographical mobility - Moved within same county (%) - American Indian and Alaska Native
Geographical mobility - Moved within same county (%) - Multirace
Geographical mobility - Moved within same county (%) - Other Race
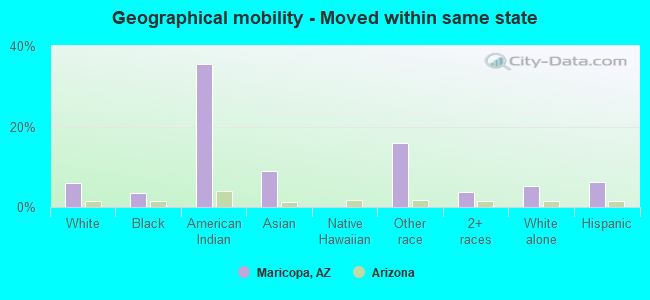
Geographical mobility - Moved from different county within same state (%)
Geographical mobility - Moved from different county within same state (%) - White
Geographical mobility - Moved from different county within same state (%) - Black or African American
Geographical mobility - Moved from different county within same state (%) - Asian
Geographical mobility - Moved from different county within same state (%) - Hispanic or Latino
Geographical mobility - Moved from different county within same state (%) - American Indian and Alaska Native
Geographical mobility - Moved from different county within same state (%) - Multirace
Geographical mobility - Moved from different county within same state (%) - Other Race
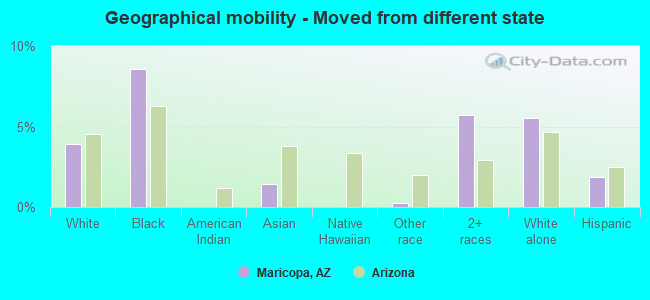
Geographical mobility - Moved from different state (%)
Geographical mobility - Moved from different state (%) - White
Geographical mobility - Moved from different state (%) - Black or African American
Geographical mobility - Moved from different state (%) - Asian
Geographical mobility - Moved from different state (%) - Hispanic or Latino
Geographical mobility - Moved from different state (%) - American Indian and Alaska Native
Geographical mobility - Moved from different state (%) - Multirace
Geographical mobility - Moved from different state (%) - Other Race
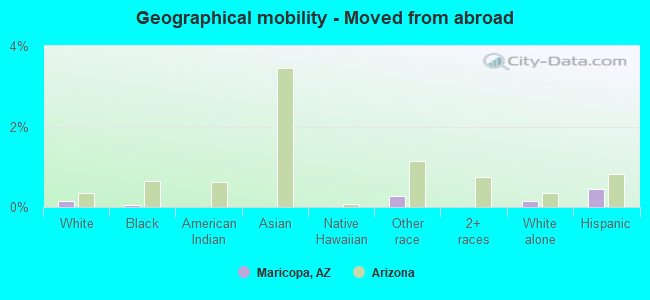
Geographical mobility - Moved from abroad (%)
Geographical mobility - Moved from abroad (%) - White
Geographical mobility - Moved from abroad (%) - Black or African American
Geographical mobility - Moved from abroad (%) - Asian
Geographical mobility - Moved from abroad (%) - Hispanic or Latino
Geographical mobility - Moved from abroad (%) - American Indian and Alaska Native
Geographical mobility - Moved from abroad (%) - Multirace
Geographical mobility - Moved from abroad (%) - Other Race
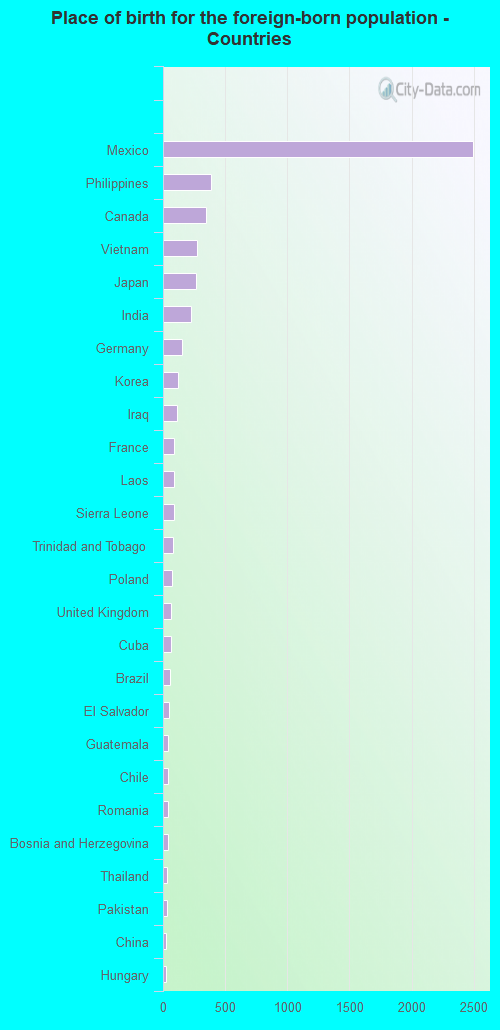
Place of birth for the foreign-born population - Ireland (%)
Place of birth for the foreign-born population - Denmark (%)
Place of birth for the foreign-born population - Norway (%)
Place of birth for the foreign-born population - Sweden (%)
Place of birth for the foreign-born population - United Kingdom (%)
Place of birth for the foreign-born population - England (%)
Place of birth for the foreign-born population - Scotland (%)
Place of birth for the foreign-born population - Other Northern Europe (%)
Place of birth for the foreign-born population - Austria (%)
Place of birth for the foreign-born population - Belgium (%)
Place of birth for the foreign-born population - France (%)
Place of birth for the foreign-born population - Germany (%)
Place of birth for the foreign-born population - Netherlands (%)
Place of birth for the foreign-born population - Switzerland (%)
Place of birth for the foreign-born population - Other Western Europe (%)
Place of birth for the foreign-born population - Greece (%)
Place of birth for the foreign-born population - Italy (%)
Place of birth for the foreign-born population - Portugal (%)
Place of birth for the foreign-born population - Spain (%)
Place of birth for the foreign-born population - Other Southern Europe (%)
Place of birth for the foreign-born population - Albania (%)
Place of birth for the foreign-born population - Belarus (%)
Place of birth for the foreign-born population - Bosnia and Herzegovina (%)
Place of birth for the foreign-born population - Bulgaria (%)
Place of birth for the foreign-born population - Croatia (%)
Place of birth for the foreign-born population - Czechoslovakia (%)
Place of birth for the foreign-born population - Hungary (%)
Place of birth for the foreign-born population - Latvia (%)
Place of birth for the foreign-born population - Lithuania (%)
Place of birth for the foreign-born population - North Macedonia (Macedonia) (%)
Place of birth for the foreign-born population - Moldova (%)
Place of birth for the foreign-born population - Poland (%)
Place of birth for the foreign-born population - Romania (%)
Place of birth for the foreign-born population - Russia (%)
Place of birth for the foreign-born population - Serbia (%)
Place of birth for the foreign-born population - Ukraine (%)
Place of birth for the foreign-born population - Other Eastern Europe (%)
Place of birth for the foreign-born population - China (%)
Place of birth for the foreign-born population - Hong Kong (%)
Place of birth for the foreign-born population - Taiwan (%)
Place of birth for the foreign-born population - Japan (%)
Place of birth for the foreign-born population - Korea (%)
Place of birth for the foreign-born population - Other Eastern Asia (%)
Place of birth for the foreign-born population - Afghanistan (%)
Place of birth for the foreign-born population - Bangladesh (%)
Place of birth for the foreign-born population - India (%)
Place of birth for the foreign-born population - Iran (%)
Place of birth for the foreign-born population - Kazakhstan (%)
Place of birth for the foreign-born population - Nepal (%)
Place of birth for the foreign-born population - Pakistan (%)
Place of birth for the foreign-born population - Sri Lanka (%)
Place of birth for the foreign-born population - Uzbekistan (%)
Place of birth for the foreign-born population - Other South Central Asia (%)
Place of birth for the foreign-born population - Burma (%)
Place of birth for the foreign-born population - Cambodia (%)
Place of birth for the foreign-born population - Indonesia (%)
Place of birth for the foreign-born population - Laos (%)
Place of birth for the foreign-born population - Malaysia (%)
Place of birth for the foreign-born population - Philippines (%)
Place of birth for the foreign-born population - Singapore (%)
Place of birth for the foreign-born population - Thailand (%)
Place of birth for the foreign-born population - Vietnam (%)
Place of birth for the foreign-born population - Other South Eastern Asia (%)
Place of birth for the foreign-born population - Armenia (%)
Place of birth for the foreign-born population - Iraq (%)
Place of birth for the foreign-born population - Israel (%)
Place of birth for the foreign-born population - Jordan (%)
Place of birth for the foreign-born population - Kuwait (%)
Place of birth for the foreign-born population - Lebanon (%)
Place of birth for the foreign-born population - Saudi Arabia (%)
Place of birth for the foreign-born population - Syria (%)
Place of birth for the foreign-born population - Turkey (%)
Place of birth for the foreign-born population - Yemen (%)
Place of birth for the foreign-born population - Other Western Asia (%)
Place of birth for the foreign-born population - Eritrea (%)
Place of birth for the foreign-born population - Ethiopia (%)
Place of birth for the foreign-born population - Kenya (%)
Place of birth for the foreign-born population - Somalia (%)
Place of birth for the foreign-born population - Uganda (%)
Place of birth for the foreign-born population - Zimbabwe (%)
Place of birth for the foreign-born population - Other Eastern Africa (%)
Place of birth for the foreign-born population - Cameroon (%)
Place of birth for the foreign-born population - Congo (%)
Place of birth for the foreign-born population - Democratic Republic of Congo (Zaire) (%)
Place of birth for the foreign-born population - Other Middle Africa (%)
Place of birth for the foreign-born population - Egypt (%)
Place of birth for the foreign-born population - Morocco (%)
Place of birth for the foreign-born population - Sudan (%)
Place of birth for the foreign-born population - Other Northern Africa (%)
Place of birth for the foreign-born population - South Africa (%)
Place of birth for the foreign-born population - Other Southern Africa (%)
Place of birth for the foreign-born population - Cabo Verde (%)
Place of birth for the foreign-born population - Ghana (%)
Place of birth for the foreign-born population - Liberia (%)
Place of birth for the foreign-born population - Nigeria (%)
Place of birth for the foreign-born population - Senegal (%)
Place of birth for the foreign-born population - Sierra Leone (%)
Place of birth for the foreign-born population - Other Western Africa (%)
Place of birth for the foreign-born population - Australia (%)
Place of birth for the foreign-born population - New Zealand (%)
Place of birth for the foreign-born population - Fiji (%)
Place of birth for the foreign-born population - Micronesia (%)
Place of birth for the foreign-born population - Bahamas (%)
Place of birth for the foreign-born population - Barbados (%)
Place of birth for the foreign-born population - Cuba (%)
Place of birth for the foreign-born population - Dominica (%)
Place of birth for the foreign-born population - Dominican Republic (%)
Place of birth for the foreign-born population - Grenada (%)
Place of birth for the foreign-born population - Haiti (%)
Place of birth for the foreign-born population - Jamaica (%)
Place of birth for the foreign-born population - St. Vincent and the Grenadines (%)
Place of birth for the foreign-born population - Trinidad and Tobago (%)
Place of birth for the foreign-born population - West Indies (%)
Place of birth for the foreign-born population - Other Caribbean (%)
Place of birth for the foreign-born population - Belize (%)
Place of birth for the foreign-born population - Costa Rica (%)
Place of birth for the foreign-born population - El Salvador (%)
Place of birth for the foreign-born population - Guatemala (%)
Place of birth for the foreign-born population - Honduras (%)
Place of birth for the foreign-born population - Mexico (%)
Place of birth for the foreign-born population - Nicaragua (%)
Place of birth for the foreign-born population - Panama (%)
Place of birth for the foreign-born population - Other Central America (%)
Place of birth for the foreign-born population - Argentina (%)
Place of birth for the foreign-born population - Bolivia (%)
Place of birth for the foreign-born population - Brazil (%)
Place of birth for the foreign-born population - Chile (%)
Place of birth for the foreign-born population - Colombia (%)
Place of birth for the foreign-born population - Ecuador (%)
Place of birth for the foreign-born population - Guyana (%)
Place of birth for the foreign-born population - Peru (%)
Place of birth for the foreign-born population - Uruguay (%)
Place of birth for the foreign-born population - Venezuela (%)
Place of birth for the foreign-born population - Other South America (%)
Place of birth for the foreign-born population - Canada (%)
Place of birth for the foreign-born population - Other Northern America (%)
Place of birth for the foreign-born population - Other (%)
Latest news about races in Maricopa, AZ collected exclusively by city-data.com from local newspapers, TV, and radio stations
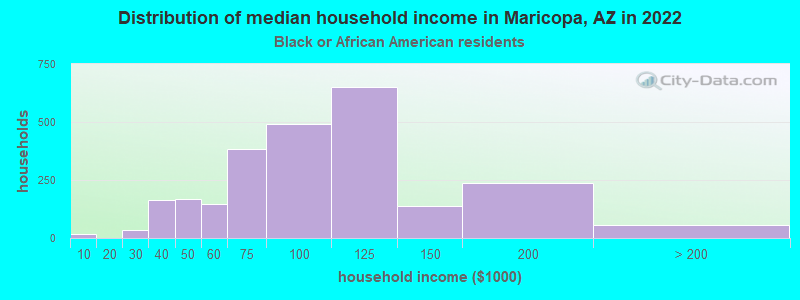
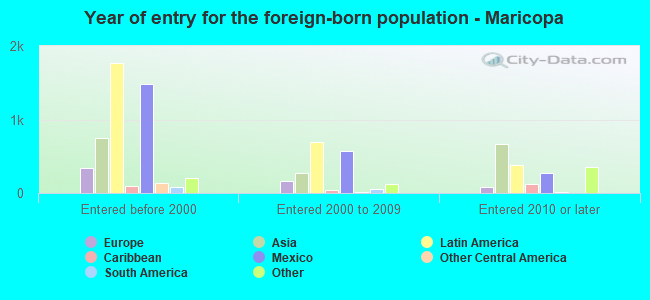
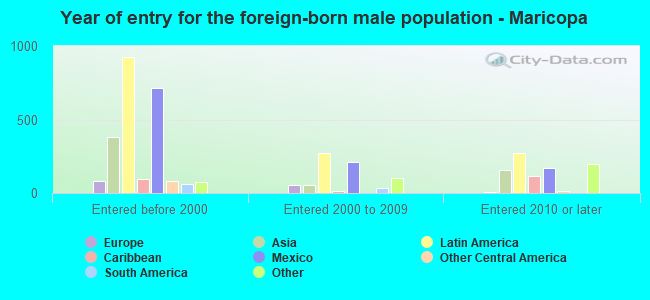
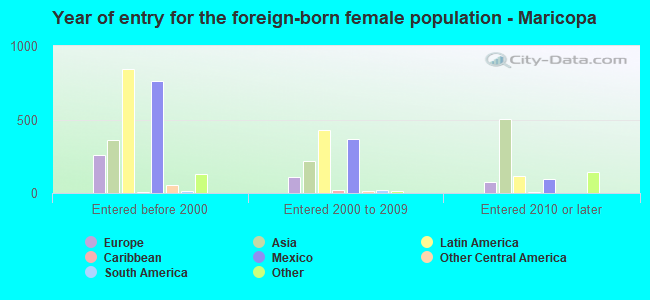
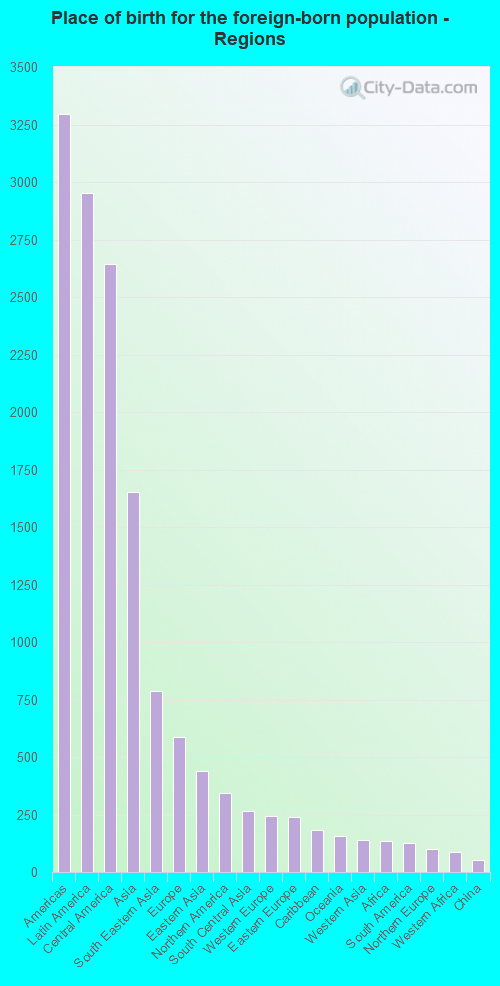
According to 2022 data, the most numerous races in Maricopa, AZ are White alone (25,216 residents), Hispanic (15,836 residents), and Black alone (6,814 residents). 80.0% of Maricopa residents speak English at home. 11.0% of Maricopa, AZ residents are foreign-born (5.9% born in Latin America, 3.3% born in Asia, 1.2% born in Europe), which is 18.1% less than the foreign-born rate of 13.0% across the entire state of Arizona.
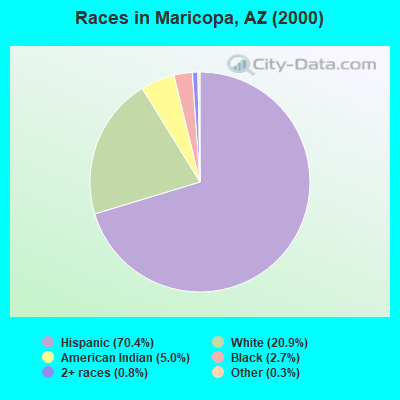
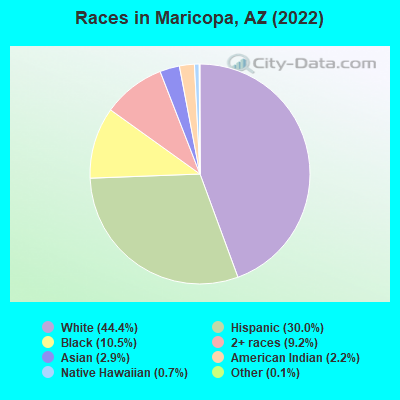
Race distribution in Maricopa
2000 2022
3,274,258 63.8% White alone 1,295,617 25.3% Hispanic 233,370 4.5% American Indian alone 149,941 2.9% Black alone 89,315 1.7% Asian alone 76,372 1.5% Two or more races 6,120 0.1% Other race alone 5,639 0.1% Native Hawaiian and Other
3,814,587 51.8% White alone 2,388,520 32.5% Hispanic 322,459 4.4% Black alone 284,994 3.9% Two or more races 257,020 3.5% Asian alone 241,688 3.3% American Indian alone 36,042 0.5% Other race alone 13,887 0.2% Native Hawaiian and Other
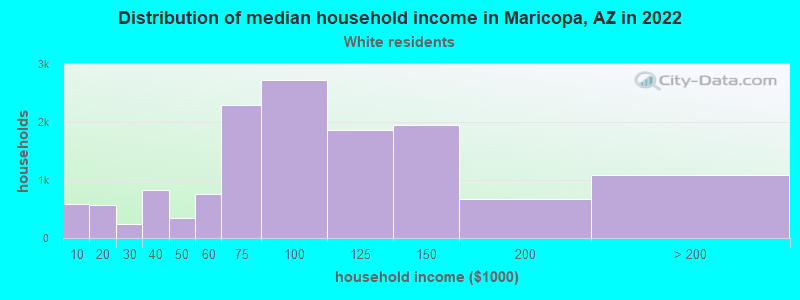
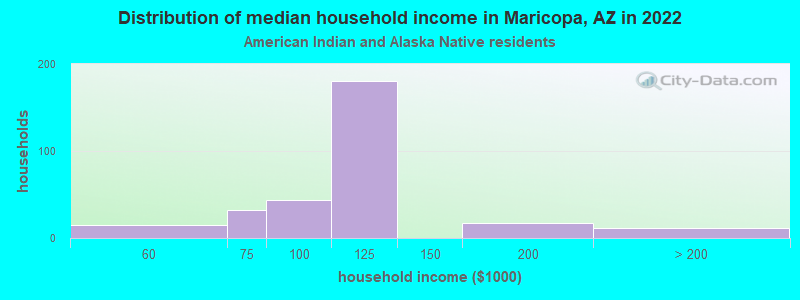
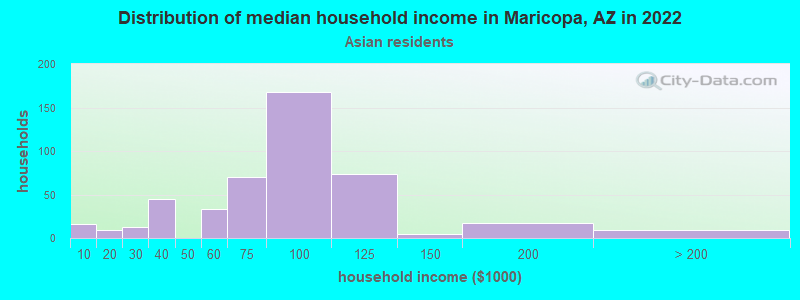
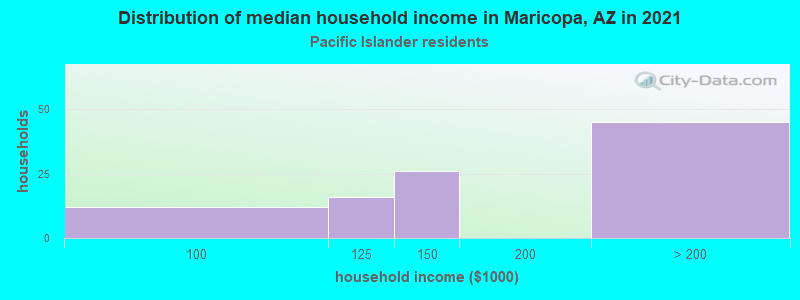
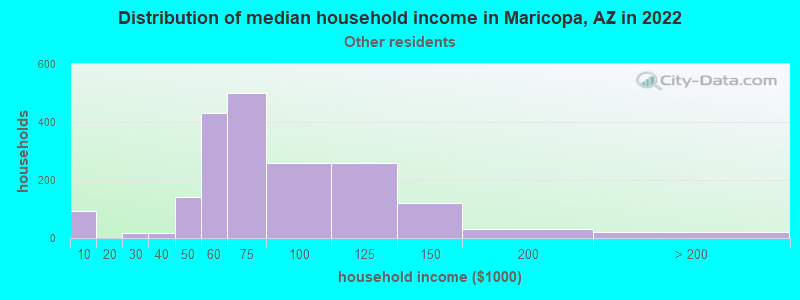
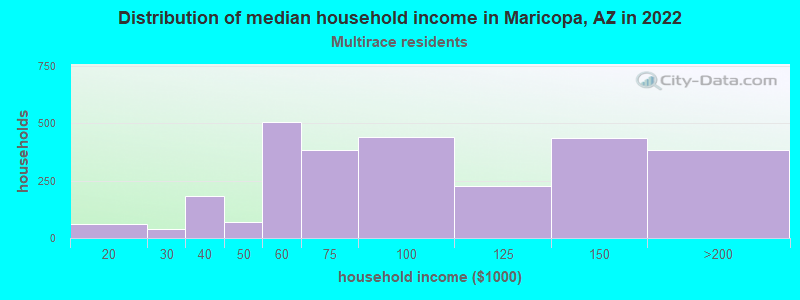
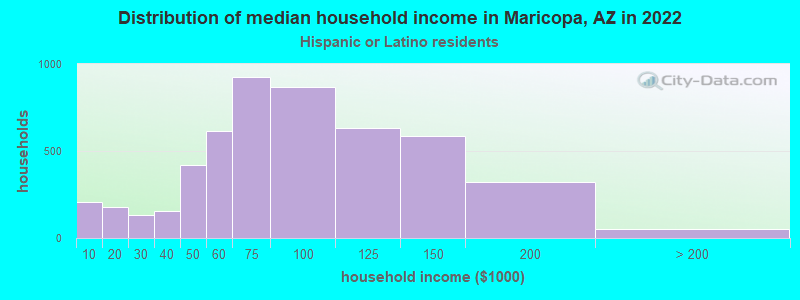
Income and house value in Maricopa Median household income in 2022 $96,303 White non-Hispanic householders$73,607 Black householders$150,113 American Indian and Alaska Native householders$88,953 Asian householders$95,736 Native Hawaiian and other Pacific Islander householders$107,204 Some other race householders$87,012 Two or more races householders$102,829 Hispanic or Latino race householdersMedian 2022 house value $315,170 White Non-Hispanic householders$303,756 Some other race householders$288,292 Hispanic or Latino householders
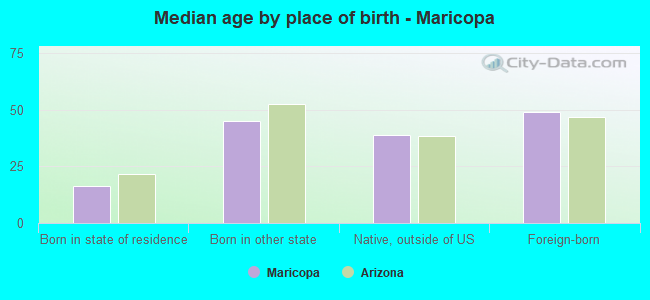
Median age by race in Maricopa
41.8 Median age for White residents41.1 42.0 38.3 Median age for Black or African American residents34.9 38.7 35.5 Median age for American Indian / Alaska Native residents34.6 33.5 40.8 Median age for Asian residents44.0 37.2 44.8 Median age for Native Hawaiian / Pacific Islander residents37.3 55.2 34.7 Median age for Other race residents38.4 29.8 22.1 Median age for Two or more races residents20.3 22.9 45.0 Median age for White alone residents44.4 45.4 26.9 Median age for Hispanic or Latino residents27.3 26.3
Owner/renter occupied households by race in Maricopa
House owners and renters - White residents 9,914 84.6% Owner occupied1,802 15.4% Renter occupiedHouse owners and renters - Black or African American residents 1,547 68.2% Owner occupied721 31.8% Renter occupiedHouse owners and renters - American Indian / Alaska Native residents 201 81.2% Owner occupied47 18.8% Renter occupiedHouse owners and renters - Asian residents 461 85.0% Owner occupied82 15.0% Renter occupiedHouse owners and renters - Native Hawaiian / Pacific Islander residents 15 47.1% Owner occupied17 52.9% Renter occupiedHouse owners and renters - Other race residents 880 80.0% Owner occupied220 20.0% Renter occupiedHouse owners and renters - Two or more races residents 2,936 87.1% Owner occupied434 12.9% Renter occupiedHouse owners and renters - White alone residents 8,361 84.7% Owner occupied1,512 15.3% Renter occupiedHouse owners and renters - Hispanic or Latino residents 3,579 83.5% Owner occupied707 16.5% Renter occupied
Language usage in Maricopa
English speakers - Total 80.0% of residents of Maricopa speak English at home.
14.6% of residents speak Spanish at home 5,319 77.9% Speak English very well1,506 22.1% Speak English less than very well5.6% of residents speak other language at home 1,822 69.6% Speak English very well796 30.4% Speak English less than very well
English speakers - Born in the United States 89.0% of residents of Maricopa speak English at home.
9.7% of residents speak Spanish at home 2,342 91.6% Speak English very well215 8.4% Speak English less than very well1.4% of residents speak other language at home 333 92.2% Speak English very well28 7.8% Speak English less than very well
English speakers - Native, born elsewhere 70.8% of residents of Maricopa speak English at home.
22.0% of residents speak Spanish at home 77 75.5% Speak English very well25 24.5% Speak English less than very well7.1% of residents speak other language at home 33 100.0% Speak English very well
English speakers - Foreign-born 21.7% of residents of Maricopa speak English at home.
42.5% of residents speak Spanish at home 1,291 53.8% Speak English very well1,107 46.2% Speak English less than very well36.7% of residents speak other language at home 1,311 63.3% Speak English very well760 36.7% Speak English less than very well
White (Caucasian) - Speak only English Native:
91.7% (25,647)Foreign-born:
24.5% (463)
White (Caucasian) - Speak another language Native:
8.7% (2,439)Foreign-born:
75.2% (1,424)
Black or African American - Speak only English Native:
97.6% (5,619)Foreign-born:
81.7% (237)
Black or African American - Speak another language Native:
2.7% (157)Foreign-born:
30.9% (90)
Asian - Speak only English Native:
61.5% (371)Foreign-born:
16.4% (210)
Asian - Speak another language Native:
39.2% (237)Foreign-born:
82.7% (1,060)
Native Hawaiian / Pacific Islander - Speak another language Native:
6.4% (10)Foreign-born:
100.0% (175)
Other race - Speak only English Native:
53.9% (1,524)Foreign-born:
12.9% (113)
Other race - Speak another language Native:
48.2% (1,363)Foreign-born:
88.9% (778)
Two or more races - Speak only English Native:
65.5% (6,555)Foreign-born:
12.5% (395)
Two or more races - Speak another language Native:
16.3% (1,633)Foreign-born:
58.0% (1,833)
White alone - Speak only English Native:
98.1% (22,877)Foreign-born:
36.5% (324)
White alone - Speak another language Native:
1.9% (442)Foreign-born:
75.0% (666)
Hispanic or Latino - Speak only English Native:
61.2% (7,196)Foreign-born:
10.0% (282)
Hispanic or Latino - Speak another language Native:
39.6% (4,663)Foreign-born:
88.5% (2,480)
Foreign-born residents in Maricopa 5,825 residents are foreign born (5.9% Latin America , 3.3% Asia , 1.2% Europe ).
This city:
11.0%Arizona:
100.0%
Marital status for residents in Maricopa Marital status - White (Caucasian) population 15 years and over
Males 29.7% Never married59.9% Now married1.0% Separated2.6% Widowed6.8% DivorcedFemales 25.4% Never married57.0% Now married1.9% Separated5.6% Widowed10.0% DivorcedWomen who gave birth in the past 12 months Now married:
70.0% (325)Unmarried:
30.0% (139)
Women who did not give birth in the past 12 months Now married:
53.7% (3,606)Unmarried:
46.3% (3,113)
Marital status - Black or African American population 15 years and over
Males 38.5% Never married45.8% Now married1.3% Separated0.5% Widowed13.9% DivorcedFemales 45.0% Never married32.1% Now married1.7% Separated4.8% Widowed16.3% DivorcedWomen who gave birth in the past 12 months Now married:
32.2% (65)Unmarried:
67.8% (136)
Women who did not give birth in the past 12 months Now married:
31.9% (730)Unmarried:
68.1% (1,556)
Marital status - American Indian / Alaska Native population 15 years and over
Males 44.4% Never married40.1% Now married0.0% Separated0.0% Widowed15.5% DivorcedFemales 59.1% Never married21.0% Now married0.0% Separated5.8% Widowed14.0% DivorcedWomen who gave birth in the past 12 months Now married:
0.0% (0)Unmarried:
100.0% (13)
Women who did not give birth in the past 12 months Now married:
16.7% (33)Unmarried:
83.3% (165)
Marital status - Asian population 15 years and over
Males 18.9% Never married75.4% Now married1.1% Separated0.5% Widowed4.1% DivorcedFemales 18.3% Never married72.5% Now married0.0% Separated3.9% Widowed5.3% DivorcedWomen who gave birth in the past 12 months Now married:
60.0% (9)Unmarried:
40.0% (6)
Women who did not give birth in the past 12 months Now married:
74.4% (516)Unmarried:
25.6% (177)
Marital status - Native Hawaiian / Pacific Islander population 15 years and over
Males 13.2% Never married80.5% Now married6.3% Separated0.0% Widowed0.0% DivorcedFemales 22.8% Never married39.6% Now married22.8% Separated14.9% Widowed0.0% DivorcedWomen who gave birth in the past 12 months Now married:
100.0% (4)Unmarried:
0.0% (0)
Women who did not give birth in the past 12 months Now married:
60.3% (29)Unmarried:
39.7% (19)
Marital status - Other race population 15 years and over
Males 41.8% Never married55.5% Now married0.0% Separated0.0% Widowed2.7% DivorcedFemales 34.6% Never married53.1% Now married0.0% Separated2.6% Widowed9.7% DivorcedWomen who gave birth in the past 12 months Now married:
100.0% (47)Unmarried:
0.0% (0)
Women who did not give birth in the past 12 months Now married:
47.0% (423)Unmarried:
53.0% (476)
Marital status - Two or more races population 15 years and over
Males 52.7% Never married33.3% Now married0.0% Separated0.0% Widowed14.0% DivorcedFemales 58.0% Never married32.0% Now married0.0% Separated1.1% Widowed8.9% DivorcedWomen who gave birth in the past 12 months Now married:
0.0% (0)Unmarried:
100.0% (230)
Women who did not give birth in the past 12 months Now married:
33.5% (1,010)Unmarried:
66.5% (2,004)
Marital status - White alone, not Hispanic / Latino population 15 years and over
Males 26.2% Never married62.6% Now married0.9% Separated3.1% Widowed7.2% DivorcedFemales 20.6% Never married59.2% Now married2.3% Separated7.0% Widowed11.1% DivorcedWomen who gave birth in the past 12 months Now married:
65.5% (193)Unmarried:
34.5% (102)
Women who did not give birth in the past 12 months Now married:
57.1% (2,811)Unmarried:
42.9% (2,116)
Marital status - Hispanic or Latino population 15 years and over
Males 41.3% Never married52.2% Now married0.9% Separated0.6% Widowed5.0% DivorcedFemales 40.5% Never married49.1% Now married0.6% Separated1.6% Widowed8.1% DivorcedWomen who gave birth in the past 12 months Now married:
79.4% (241)Unmarried:
20.6% (63)
Women who did not give birth in the past 12 months Now married:
45.1% (1,912)Unmarried:
54.9% (2,323)
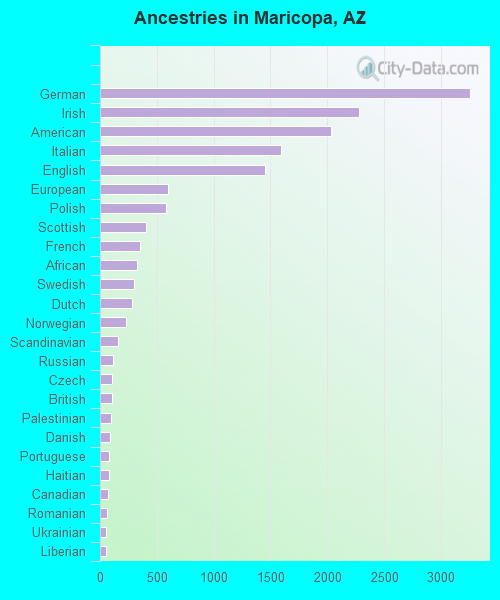
Ancestries in Maricopa
2,524 9.2% German1,620 5.9% English1,446 5.3% Irish1,343 4.9% American955 3.5% Italian534 2.0% Polish533 1.9% European350 1.3% Scottish220 0.8% French195 0.7% Norwegian153 0.6% British153 0.6% Dutch144 0.5% African121 0.4% Assyrian105 0.4% Scandinavian94 0.3% Canadian94 0.3% Scotch-Irish92 0.3% Danish76 0.3% Hungarian62 0.2% Romanian55 0.2% Swedish50 0.2% Finnish49 0.2% French Canadian49 0.2% Portuguese47 0.2% Welsh46 0.2% Russian41 0.1% Czech40 0.1% Ukrainian37 0.1% Barbadian33 0.1% Iraqi29 0.1% Macedonian29 0.1% Yugoslavian24 0.09% Serbian18 0.07% Czechoslovakian15 0.05% Palestinian14 0.05% Swiss12 0.04% Northern European12 0.04% Eastern European11 0.04% Iranian10 0.04% Arab10 0.04% Lithuanian10 0.04% Slavic10 0.04% Belgian9 0.03% Australian5 0.02% Israeli4 0.01% Lebanese4 0.01% Turkish
Geographical mobility in Maricopa Same house 1 year ago 26,331 85.4% White (Caucasian)5,276 83.2% Black or African American463 71.7% American Indian / Alaska Native1,965 91.1% Asian290 92.9% Native Hawaiian / Pacific Islander2,517 87.9% Other race11,121 92.2% Two or more races20,332 85.6% White alone, not Hispanic / Latino11,887 83.6% Hispanic or LatinoMoved within same county 1,585 5.1% White / Caucasian299 4.7% Black or African American31 4.8% American Indian / Alaska Native18 0.8% Asian19 6.1% Native Hawaiian / Pacific Islander124 4.3% Other race143 1.2% Two or more races983 4.1% White alone, not Hispanic / Latino1,187 8.3% Hispanic or LatinoMoved within same state 1,852 6.0% White / Caucasian221 3.5% Black or African American230 35.6% American Indian / Alaska Native194 9.0% Asian452 15.8% Other race439 3.6% Two or more races1,238 5.2% White alone, not Hispanic / Latino896 6.3% Hispanic or LatinoMoved from different state 1,212 3.9% White / Caucasian545 8.6% Black or African American30 1.4% Asian7 0.3% Other race689 5.7% Two or more races1,313 5.5% White alone, not Hispanic / Latino264 1.9% Hispanic or LatinoMoved from abroad 49 0.2% White3 0.1% Black or African American8 0.3% Other race35 0.1% White alone, not Hispanic / Latino64 0.5% Hispanic or Latino
Children Nativity (place of birth) in Maricopa
Children under 6 years - Living with two parents Both parents native 1,606 99.9% Native2 0.1% Foreign-bornBoth parents foreign-born 166 100.0% NativeOne native, one foreign-born parent 403 99.2% Native3 0.8% Foreign-bornChildren under 6 years - Living with one parent Native parent 986 100.0% NativeForeign-born parent 19 100.0% NativeChildren 6 to 17 years - Living with two parents Both parents native 4,757 100.0% NativeBoth parents foreign-born 783 92.6% Native62 7.4% Foreign-bornOne native, one foreign-born parent 1,418 89.1% Native173 10.9% Foreign-bornChildren 6 to 17 years - Living with one parent Native parent 1,746 100.0% NativeForeign-born parent 219 51.8% Native204 48.2% Foreign-born
Grandparents responsible for own grandchildren in Maricopa
Grandparents (30 to 59 years) White / Caucasian 363 64.9% Responsible for grandchildren197 35.1% Not responsible for grandchildrenBlack or African American 20 100.0% Responsible for grandchildrenAmerican Indian / Alaska Native 7 100.0% Not responsible for grandchildrenAsian 5 9.5% Responsible for grandchildren48 90.5% Not responsible for grandchildrenOther race 20 63.6% Responsible for grandchildren11 36.4% Not responsible for grandchildrenWhite alone, not Hispanic / Latino 231 61.4% Responsible for grandchildren145 38.6% Not responsible for grandchildrenHispanic or Latino 50 24.1% Responsible for grandchildren159 75.9% Not responsible for grandchildrenGrandparents (60 years and over) White / Caucasian 226 37.8% Responsible for grandchildren372 62.2% Not responsible for grandchildrenBlack or African American 19 16.8% Responsible for grandchildren94 83.2% Not responsible for grandchildrenAsian 97 100.0% Not responsible for grandchildrenOther race 16 32.7% Responsible for grandchildren32 67.3% Not responsible for grandchildrenWhite alone, not Hispanic / Latino 226 44.3% Responsible for grandchildren284 55.7% Not responsible for grandchildrenHispanic or Latino 44 13.2% Responsible for grandchildren291 86.8% Not responsible for grandchildren