Races in Manson, Washington (WA) Detailed Stats
Ancestries, Foreign-born residents, place of birth

Data:
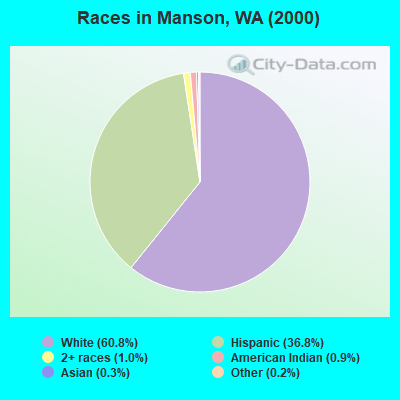
Race distribution in Manson

- 1,97460.8%White alone
- 1,19436.8%Hispanic
- 331.0%Two or more races
- 290.9%American Indian alone
- 90.3%Asian alone
- 70.2%Other race alone
- 10.03%Black alone
- 10.03%Native Hawaiian and Other
Pacific Islander alone
2000
2022
-
- 4,652,49078.9%White alone
- 441,5097.5%Hispanic
- 319,4015.4%Asian alone
- 184,6313.1%Black alone
- 175,9263.0%Two or more races
- 85,3961.4%American Indian alone
- 22,7790.4%Native Hawaiian and Other
Pacific Islander alone
- 11,9890.2%Other race alone
-
- 4,941,45663.5%White alone
- 1,093,31314.0%Hispanic
- 755,8329.7%Asian alone
- 523,4486.7%Two or more races
- 299,5373.8%Black alone
- 69,0240.9%American Indian alone
- 52,2310.7%Native Hawaiian and Other
Pacific Islander alone
- 50,9450.7%Other race alone
Income and house value in Manson
- Median household income in 2022
- $79,224White non-Hispanic householders
- $53,531American Indian and Alaska Native householders
- $90,021Some other race householders
- $58,640Two or more races householders
- $88,999Hispanic or Latino race householders
- Median 2022 house value
- $583,749White Non-Hispanic householders
- over $1,000,000Asian householders
- $415,049Some other race householders
- $472,428Two or more races householders
- $317,815Hispanic or Latino householders