Races in Manorhaven, New York (NY) Detailed Stats
Data:
Races - White alone (%)
Races - White alone (% change since 2000)
Races - Black alone (%)
Races - Black alone (% change since 2000)
Races - American Indian alone (%)
Races - American Indian alone (% change since 2000)
Races - Asian alone (%)
Races - Asian alone (% change since 2000)
Races - Hispanic (%)
Races - Hispanic (% change since 2000)
Races - Native Hawaiian and Other Pacific Islander alone (%)
Races - Native Hawaiian and Other Pacific Islander alone (% change since 2000)
Races - Two or more races(%)
Races - Two or more races(% change since 2000)
Races - Other race alone (%)
Races - Other race alone (% change since 2000)
Racial diversity
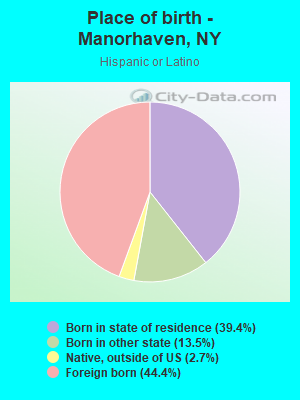
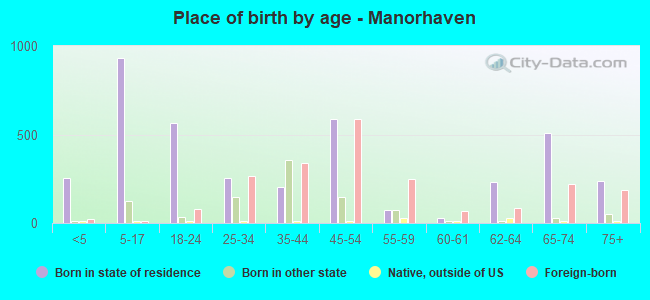
Place of birth - Born in state of residence (%)
Place of birth - Born in state of residence (%) - White
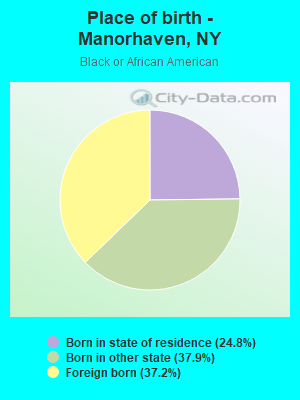
Place of birth - Born in state of residence (%) - Black or African American
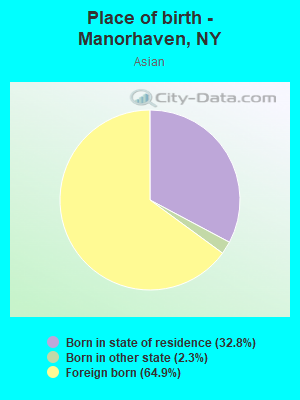
Place of birth - Born in state of residence (%) - Asian
Place of birth - Born in state of residence (%) - Hispanic or Latino
Place of birth - Born in state of residence (%) - American Indian and Alaska Native
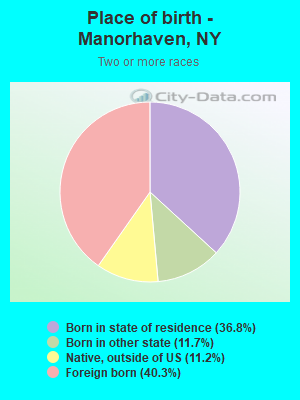
Place of birth - Born in state of residence (%) - Multirace
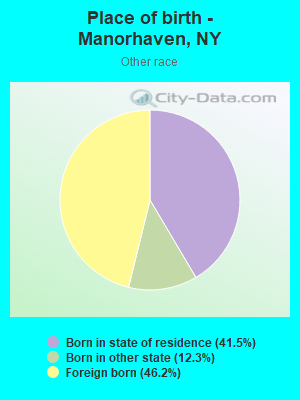
Place of birth - Born in state of residence (%) - Other Race
Place of birth - Born in other state (%)
Place of birth - Born in other state (%) - White
Place of birth - Born in other state (%) - Black or African American
Place of birth - Born in other state (%) - Asian
Place of birth - Born in other state (%) - Hispanic or Latino
Place of birth - Born in other state (%) - American Indian and Alaska Native
Place of birth - Born in other state (%) - Multirace
Place of birth - Born in other state (%) - Other Race
Place of birth - Native, outside of US (%)
Place of birth - Native, outside of US (%) - White
Place of birth - Native, outside of US (%) - Black or African American
Place of birth - Native, outside of US (%) - Asian
Place of birth - Native, outside of US (%) - Hispanic or Latino
Place of birth - Native, outside of US (%) - American Indian and Alaska Native
Place of birth - Native, outside of US (%) - Multirace
Place of birth - Native, outside of US (%) - Other Race
Place of birth - Foreign born (%)
Place of birth - Foreign born (%) - White
Place of birth - Foreign born (%) - Black or African American
Place of birth - Foreign born (%) - Asian
Place of birth - Foreign born (%) - Hispanic or Latino
Place of birth - Foreign born (%) - American Indian and Alaska Native
Place of birth - Foreign born (%) - Multirace
Place of birth - Foreign born (%) - Other Race
Residents speaking English at home (%)
Residents speaking English at home - Born in the United States (%)
Residents speaking English at home - Native, born elsewhere (%)
Residents speaking English at home - Foreign born (%)
Residents speaking Spanish at home (%)
Residents speaking Spanish at home - Born in the United States (%)
Residents speaking Spanish at home - Native, born elsewhere (%)
Residents speaking Spanish at home - Foreign born (%)
Residents speaking other language at home (%)
Residents speaking other language at home - Born in the United States (%)
Residents speaking other language at home - Native, born elsewhere (%)
Residents speaking other language at home - Foreign born (%)
Marital status - Never married (%)
Marital status - Now married (%)
Marital status - Separated (%)
Marital status - Widowed (%)
Marital status - Divorced (%)
Ancestries Reported - Arab (%)
Ancestries Reported - Czech (%)
Ancestries Reported - Danish (%)
Ancestries Reported - Dutch (%)
Ancestries Reported - English (%)
Ancestries Reported - French (%)
Ancestries Reported - French Canadian (%)
Ancestries Reported - German (%)
Ancestries Reported - Greek (%)
Ancestries Reported - Hungarian (%)
Ancestries Reported - Irish (%)
Ancestries Reported - Italian (%)
Ancestries Reported - Lithuanian (%)
Ancestries Reported - Norwegian (%)
Ancestries Reported - Polish (%)
Ancestries Reported - Portuguese (%)
Ancestries Reported - Russian (%)
Ancestries Reported - Scotch-Irish (%)
Ancestries Reported - Scottish (%)
Ancestries Reported - Slovak (%)
Ancestries Reported - Subsaharan African (%)
Ancestries Reported - Swedish (%)
Ancestries Reported - Swiss (%)
Ancestries Reported - Ukrainian (%)
Ancestries Reported - United States (%)
Ancestries Reported - Welsh (%)
Ancestries Reported - West Indian (%)
Ancestries Reported - Other (%)
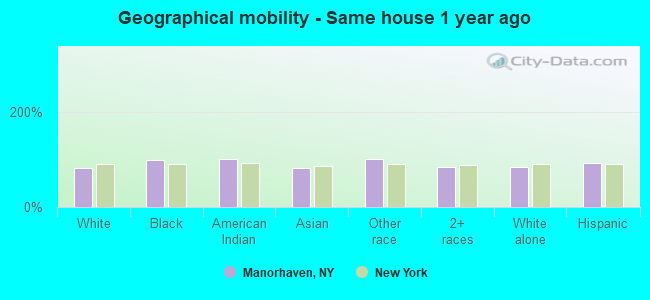
Geographical mobility - Same house 1 year ago (%)
Geographical mobility - Same house 1 year ago (%) - White
Geographical mobility - Same house 1 year ago (%) - Black or African American
Geographical mobility - Same house 1 year ago (%) - Asian
Geographical mobility - Same house 1 year ago (%) - Hispanic or Latino
Geographical mobility - Same house 1 year ago (%) - American Indian and Alaska Native
Geographical mobility - Same house 1 year ago (%) - Multirace
Geographical mobility - Same house 1 year ago (%) - Other Race
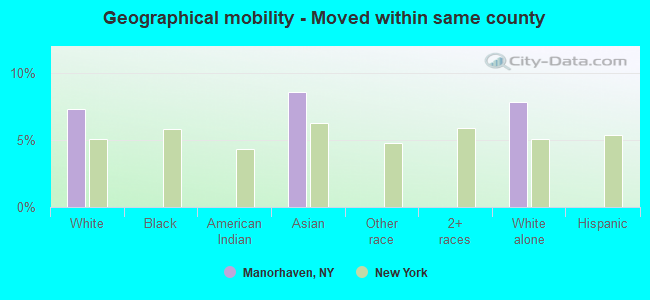
Geographical mobility - Moved within same county (%)
Geographical mobility - Moved within same county (%) - White
Geographical mobility - Moved within same county (%) - Black or African American
Geographical mobility - Moved within same county (%) - Asian
Geographical mobility - Moved within same county (%) - Hispanic or Latino
Geographical mobility - Moved within same county (%) - American Indian and Alaska Native
Geographical mobility - Moved within same county (%) - Multirace
Geographical mobility - Moved within same county (%) - Other Race
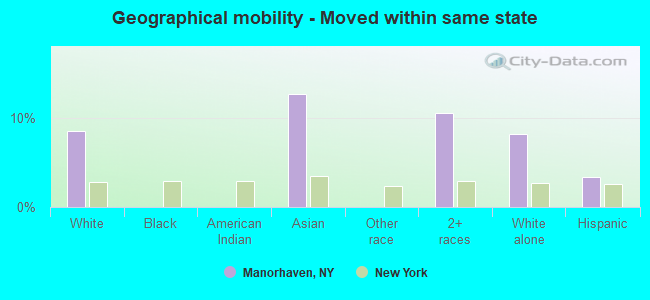
Geographical mobility - Moved from different county within same state (%)
Geographical mobility - Moved from different county within same state (%) - White
Geographical mobility - Moved from different county within same state (%) - Black or African American
Geographical mobility - Moved from different county within same state (%) - Asian
Geographical mobility - Moved from different county within same state (%) - Hispanic or Latino
Geographical mobility - Moved from different county within same state (%) - American Indian and Alaska Native
Geographical mobility - Moved from different county within same state (%) - Multirace
Geographical mobility - Moved from different county within same state (%) - Other Race
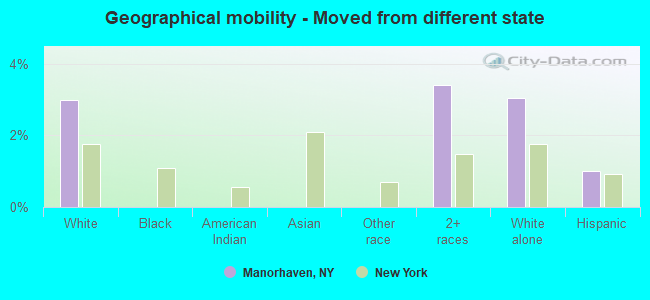
Geographical mobility - Moved from different state (%)
Geographical mobility - Moved from different state (%) - White
Geographical mobility - Moved from different state (%) - Black or African American
Geographical mobility - Moved from different state (%) - Asian
Geographical mobility - Moved from different state (%) - Hispanic or Latino
Geographical mobility - Moved from different state (%) - American Indian and Alaska Native
Geographical mobility - Moved from different state (%) - Multirace
Geographical mobility - Moved from different state (%) - Other Race
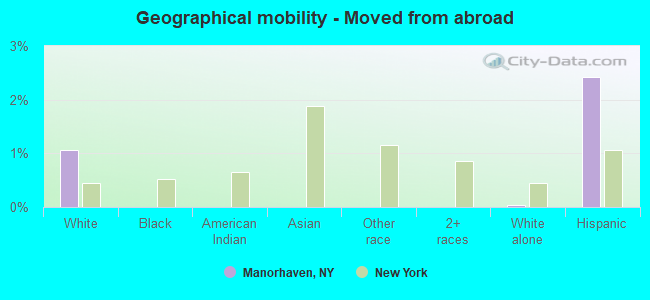
Geographical mobility - Moved from abroad (%)
Geographical mobility - Moved from abroad (%) - White
Geographical mobility - Moved from abroad (%) - Black or African American
Geographical mobility - Moved from abroad (%) - Asian
Geographical mobility - Moved from abroad (%) - Hispanic or Latino
Geographical mobility - Moved from abroad (%) - American Indian and Alaska Native
Geographical mobility - Moved from abroad (%) - Multirace
Geographical mobility - Moved from abroad (%) - Other Race
Place of birth for the foreign-born population - Ireland (%)
Place of birth for the foreign-born population - Denmark (%)
Place of birth for the foreign-born population - Norway (%)
Place of birth for the foreign-born population - Sweden (%)
Place of birth for the foreign-born population - United Kingdom (%)
Place of birth for the foreign-born population - England (%)
Place of birth for the foreign-born population - Scotland (%)
Place of birth for the foreign-born population - Other Northern Europe (%)
Place of birth for the foreign-born population - Austria (%)
Place of birth for the foreign-born population - Belgium (%)
Place of birth for the foreign-born population - France (%)
Place of birth for the foreign-born population - Germany (%)
Place of birth for the foreign-born population - Netherlands (%)
Place of birth for the foreign-born population - Switzerland (%)
Place of birth for the foreign-born population - Other Western Europe (%)
Place of birth for the foreign-born population - Greece (%)
Place of birth for the foreign-born population - Italy (%)
Place of birth for the foreign-born population - Portugal (%)
Place of birth for the foreign-born population - Spain (%)
Place of birth for the foreign-born population - Other Southern Europe (%)
Place of birth for the foreign-born population - Albania (%)
Place of birth for the foreign-born population - Belarus (%)
Place of birth for the foreign-born population - Bosnia and Herzegovina (%)
Place of birth for the foreign-born population - Bulgaria (%)
Place of birth for the foreign-born population - Croatia (%)
Place of birth for the foreign-born population - Czechoslovakia (%)
Place of birth for the foreign-born population - Hungary (%)
Place of birth for the foreign-born population - Latvia (%)
Place of birth for the foreign-born population - Lithuania (%)
Place of birth for the foreign-born population - North Macedonia (Macedonia) (%)
Place of birth for the foreign-born population - Moldova (%)
Place of birth for the foreign-born population - Poland (%)
Place of birth for the foreign-born population - Romania (%)
Place of birth for the foreign-born population - Russia (%)
Place of birth for the foreign-born population - Serbia (%)
Place of birth for the foreign-born population - Ukraine (%)
Place of birth for the foreign-born population - Other Eastern Europe (%)
Place of birth for the foreign-born population - China (%)
Place of birth for the foreign-born population - Hong Kong (%)
Place of birth for the foreign-born population - Taiwan (%)
Place of birth for the foreign-born population - Japan (%)
Place of birth for the foreign-born population - Korea (%)
Place of birth for the foreign-born population - Other Eastern Asia (%)
Place of birth for the foreign-born population - Afghanistan (%)
Place of birth for the foreign-born population - Bangladesh (%)
Place of birth for the foreign-born population - India (%)
Place of birth for the foreign-born population - Iran (%)
Place of birth for the foreign-born population - Kazakhstan (%)
Place of birth for the foreign-born population - Nepal (%)
Place of birth for the foreign-born population - Pakistan (%)
Place of birth for the foreign-born population - Sri Lanka (%)
Place of birth for the foreign-born population - Uzbekistan (%)
Place of birth for the foreign-born population - Other South Central Asia (%)
Place of birth for the foreign-born population - Burma (%)
Place of birth for the foreign-born population - Cambodia (%)
Place of birth for the foreign-born population - Indonesia (%)
Place of birth for the foreign-born population - Laos (%)
Place of birth for the foreign-born population - Malaysia (%)
Place of birth for the foreign-born population - Philippines (%)
Place of birth for the foreign-born population - Singapore (%)
Place of birth for the foreign-born population - Thailand (%)
Place of birth for the foreign-born population - Vietnam (%)
Place of birth for the foreign-born population - Other South Eastern Asia (%)
Place of birth for the foreign-born population - Armenia (%)
Place of birth for the foreign-born population - Iraq (%)
Place of birth for the foreign-born population - Israel (%)
Place of birth for the foreign-born population - Jordan (%)
Place of birth for the foreign-born population - Kuwait (%)
Place of birth for the foreign-born population - Lebanon (%)
Place of birth for the foreign-born population - Saudi Arabia (%)
Place of birth for the foreign-born population - Syria (%)
Place of birth for the foreign-born population - Turkey (%)
Place of birth for the foreign-born population - Yemen (%)
Place of birth for the foreign-born population - Other Western Asia (%)
Place of birth for the foreign-born population - Eritrea (%)
Place of birth for the foreign-born population - Ethiopia (%)
Place of birth for the foreign-born population - Kenya (%)
Place of birth for the foreign-born population - Somalia (%)
Place of birth for the foreign-born population - Uganda (%)
Place of birth for the foreign-born population - Zimbabwe (%)
Place of birth for the foreign-born population - Other Eastern Africa (%)
Place of birth for the foreign-born population - Cameroon (%)
Place of birth for the foreign-born population - Congo (%)
Place of birth for the foreign-born population - Democratic Republic of Congo (Zaire) (%)
Place of birth for the foreign-born population - Other Middle Africa (%)
Place of birth for the foreign-born population - Egypt (%)
Place of birth for the foreign-born population - Morocco (%)
Place of birth for the foreign-born population - Sudan (%)
Place of birth for the foreign-born population - Other Northern Africa (%)
Place of birth for the foreign-born population - South Africa (%)
Place of birth for the foreign-born population - Other Southern Africa (%)
Place of birth for the foreign-born population - Cabo Verde (%)
Place of birth for the foreign-born population - Ghana (%)
Place of birth for the foreign-born population - Liberia (%)
Place of birth for the foreign-born population - Nigeria (%)
Place of birth for the foreign-born population - Senegal (%)
Place of birth for the foreign-born population - Sierra Leone (%)
Place of birth for the foreign-born population - Other Western Africa (%)
Place of birth for the foreign-born population - Australia (%)
Place of birth for the foreign-born population - New Zealand (%)
Place of birth for the foreign-born population - Fiji (%)
Place of birth for the foreign-born population - Micronesia (%)
Place of birth for the foreign-born population - Bahamas (%)
Place of birth for the foreign-born population - Barbados (%)
Place of birth for the foreign-born population - Cuba (%)
Place of birth for the foreign-born population - Dominica (%)
Place of birth for the foreign-born population - Dominican Republic (%)
Place of birth for the foreign-born population - Grenada (%)
Place of birth for the foreign-born population - Haiti (%)
Place of birth for the foreign-born population - Jamaica (%)
Place of birth for the foreign-born population - St. Vincent and the Grenadines (%)
Place of birth for the foreign-born population - Trinidad and Tobago (%)
Place of birth for the foreign-born population - West Indies (%)
Place of birth for the foreign-born population - Other Caribbean (%)
Place of birth for the foreign-born population - Belize (%)
Place of birth for the foreign-born population - Costa Rica (%)
Place of birth for the foreign-born population - El Salvador (%)
Place of birth for the foreign-born population - Guatemala (%)
Place of birth for the foreign-born population - Honduras (%)
Place of birth for the foreign-born population - Mexico (%)
Place of birth for the foreign-born population - Nicaragua (%)
Place of birth for the foreign-born population - Panama (%)
Place of birth for the foreign-born population - Other Central America (%)
Place of birth for the foreign-born population - Argentina (%)
Place of birth for the foreign-born population - Bolivia (%)
Place of birth for the foreign-born population - Brazil (%)
Place of birth for the foreign-born population - Chile (%)
Place of birth for the foreign-born population - Colombia (%)
Place of birth for the foreign-born population - Ecuador (%)
Place of birth for the foreign-born population - Guyana (%)
Place of birth for the foreign-born population - Peru (%)
Place of birth for the foreign-born population - Uruguay (%)
Place of birth for the foreign-born population - Venezuela (%)
Place of birth for the foreign-born population - Other South America (%)
Place of birth for the foreign-born population - Canada (%)
Place of birth for the foreign-born population - Other Northern America (%)
Place of birth for the foreign-born population - Other (%)
Latest news about races in Manorhaven, NY collected exclusively by city-data.com from local newspapers, TV, and radio stations
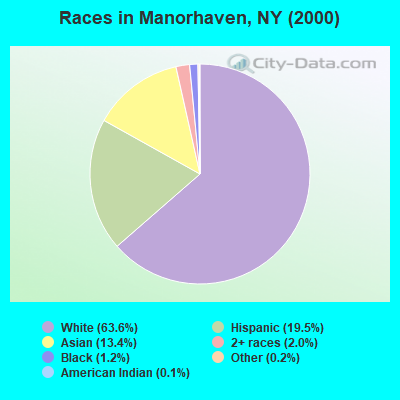
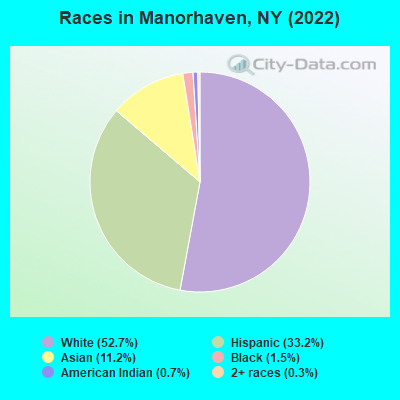
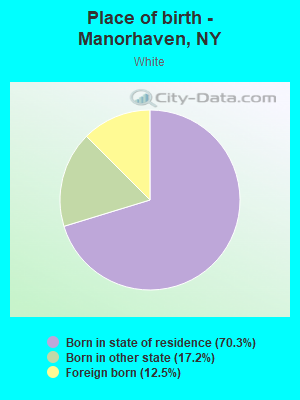
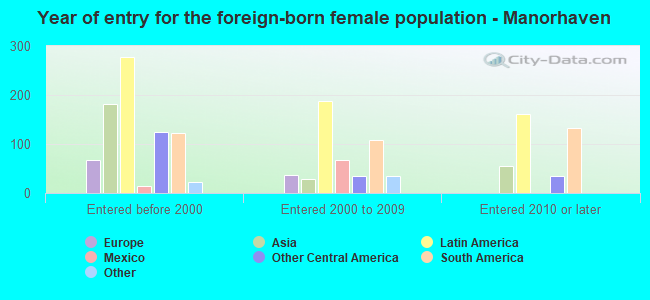
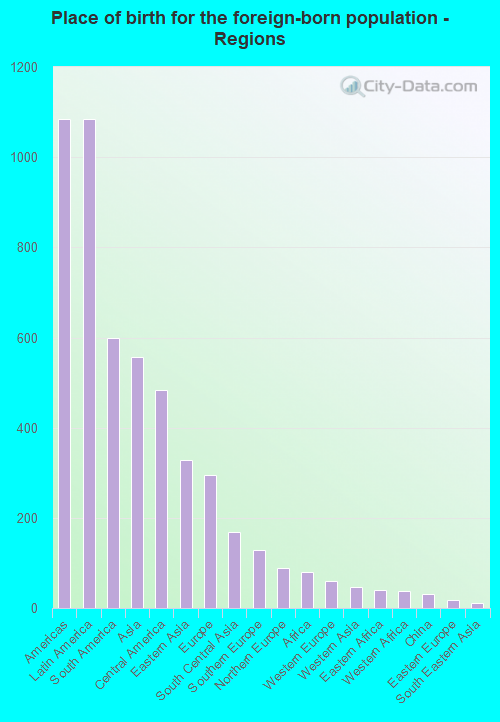
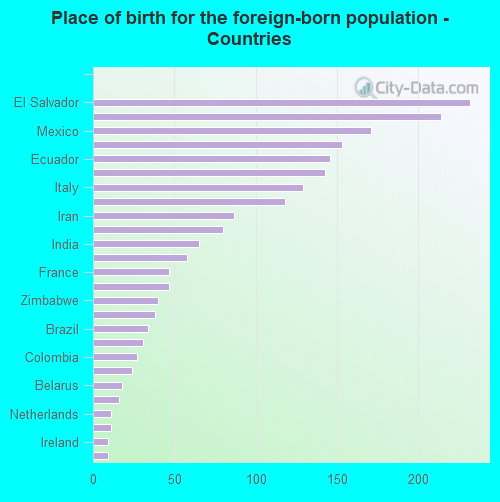
According to 2022 data, the most numerous races in Manorhaven, NY are White alone (3,634 residents), Hispanic (2,289 residents), and Black alone (106 residents). 59.6% of Manorhaven residents speak English at home. 29.2% of Manorhaven, NY residents are foreign-born (15.8% born in Latin America, 8.1% born in Asia, 4.3% born in Europe), which is 24.6% greater than the foreign-born rate of 22.0% across the entire state of New York.
Race distribution in Manorhaven
2000 2022
11,760,981 62.0% White alone 2,867,583 15.1% Hispanic 2,812,623 14.8% Black alone 1,035,926 5.5% Asian alone 366,116 1.9% Two or more races 75,499 0.4% Other race alone 52,499 0.3% American Indian alone 5,230 0.03% Native Hawaiian and Other
10,408,933 52.9% White alone 3,867,299 19.7% Hispanic 2,633,840 13.4% Black alone 1,776,286 9.0% Asian alone 732,670 3.7% Two or more races 216,110 1.1% Other race alone 35,082 0.2% American Indian alone 6,931 0.04% Native Hawaiian and Other
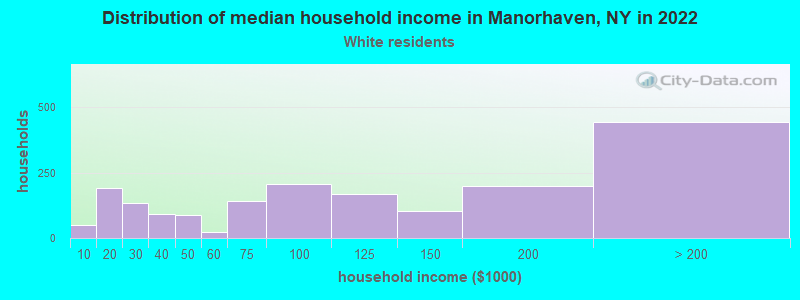
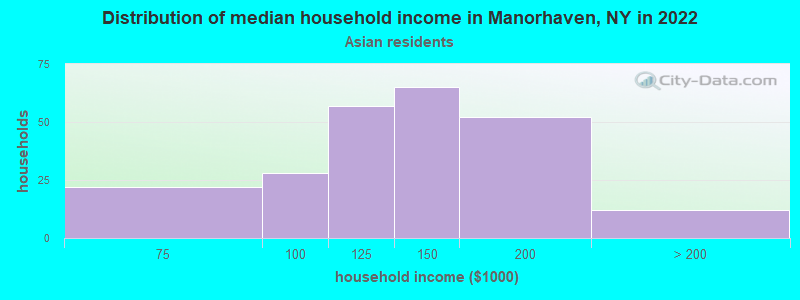
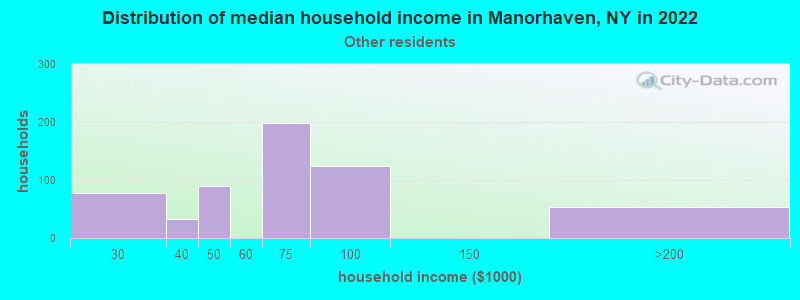
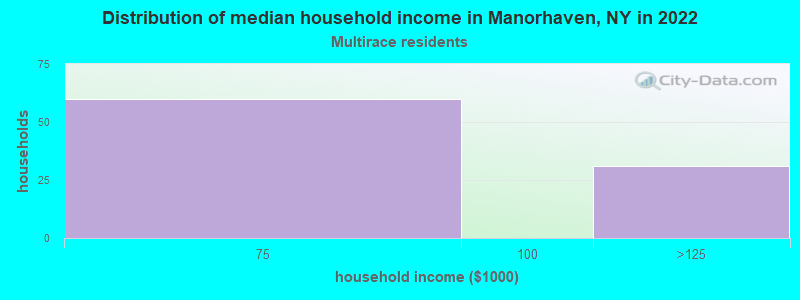
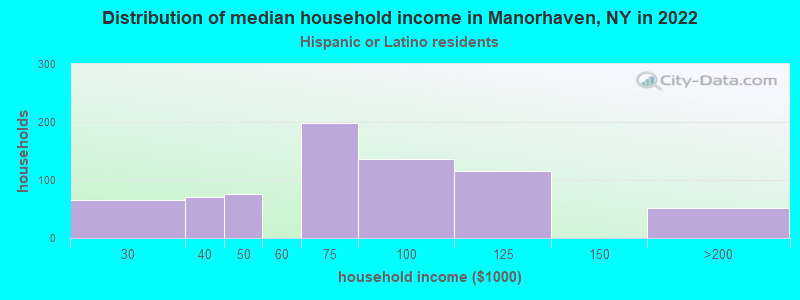
Income and house value in Manorhaven Median household income in 2022 $97,923 White non-Hispanic householders$126,446 Asian householders$65,874 Some other race householders$65,420 Hispanic or Latino race householdersMedian 2022 house value $673,282 White Non-Hispanic householders$462,588 Black or African American householders $663,167 Asian householders$637,262 Some other race householders$490,960 Hispanic or Latino householders
Median age by race in Manorhaven
51.1 Median age for White residents50.4 52.6 30.2 Median age for Black or African American residents35.5 30.7 -855,158,729.3 Median age for American Indian / Alaska Native residents-607,543,322.5 -837,121,211.3 40.9 Median age for Asian residents42.3 39.7 -487,992,314.6 Median age for Native Hawaiian / Pacific Islander residents-477,502,295.2 -497,387,669.3 32.5 Median age for Other race residents44.0 12.6 34.9 Median age for Two or more races residents19.8 51.7 50.6 Median age for White alone residents49.5 51.9 35.0 Median age for Hispanic or Latino residents37.0 29.2
Owner/renter occupied households by race in Manorhaven
House owners and renters - White residents 791 42.1% Owner occupied1,087 57.9% Renter occupiedHouse owners and renters - Black or African American residents 18 100.0% Renter occupiedHouse owners and renters - Asian residents 42 19.1% Owner occupied179 80.9% Renter occupiedHouse owners and renters - Other race residents 152 27.9% Owner occupied393 72.1% Renter occupiedHouse owners and renters - Two or more races residents 110 100.0% Owner occupiedHouse owners and renters - White alone residents 751 40.4% Owner occupied1,109 59.6% Renter occupiedHouse owners and renters - Hispanic or Latino residents 271 39.2% Owner occupied420 60.8% Renter occupied
Language usage in Manorhaven
English speakers - Total 59.6% of residents of Manorhaven speak English at home.
25.6% of residents speak Spanish at home 943 55.5% Speak English very well757 44.5% Speak English less than very well14.7% of residents speak other language at home 588 60.3% Speak English very well387 39.7% Speak English less than very well
English speakers - Born in the United States 80.0% of residents of Manorhaven speak English at home.
21.7% of residents speak Spanish at home 140 69.0% Speak English very well63 31.0% Speak English less than very well
English speakers - Native, born elsewhere 41.4% of residents of Manorhaven speak English at home.
53.4% of residents speak Spanish at home 31 100.0% Speak English very well
English speakers - Foreign-born 13.9% of residents of Manorhaven speak English at home.
45.3% of residents speak Spanish at home 297 31.8% Speak English very well638 68.2% Speak English less than very well39.3% of residents speak other language at home 467 57.7% Speak English very well343 42.3% Speak English less than very well
White (Caucasian) - Speak only English Native:
100.0% (3,121)Foreign-born:
46.3% (214)
White (Caucasian) - Speak another language Native:
1.1% (35)Foreign-born:
57.3% (265)
Black or African American - Speak another language Native:
33.8% (23)Foreign-born:
100.0% (38)
Asian - Speak only English Native:
43.6% (107)Foreign-born:
4.7% (23)
Asian - Speak another language Native:
56.0% (137)Foreign-born:
97.2% (470)
Other race - Speak only English Native:
15.3% (107)Foreign-born:
4.9% (37)
Other race - Speak another language Native:
80.9% (567)Foreign-born:
95.8% (723)
Two or more races - Speak another language Native:
72.3% (360)Foreign-born:
100.0% (344)
White alone - Speak only English Native:
99.8% (3,084)Foreign-born:
45.7% (227)
White alone - Speak another language Native:
0.7% (23)Foreign-born:
53.9% (268)
Hispanic or Latino - Speak only English Native:
27.0% (289)Foreign-born:
4.1% (43)
Hispanic or Latino - Speak another language Native:
73.5% (788)Foreign-born:
95.9% (983)
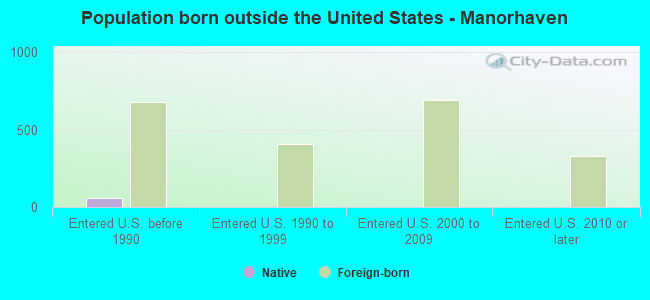
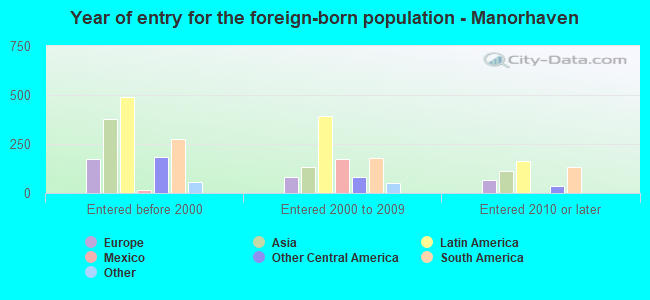
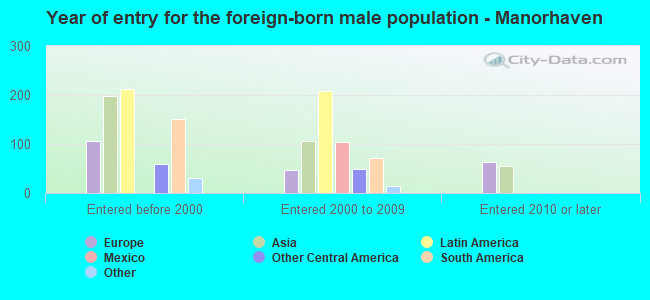
Foreign-born residents in Manorhaven 2,015 residents are foreign born (15.8% Latin America , 8.1% Asia , 4.3% Europe ).
This city:
29.2%New York:
22.6%
Marital status for residents in Manorhaven Marital status - White (Caucasian) population 15 years and over
Males 26.4% Never married50.4% Now married4.6% Separated2.3% Widowed16.3% DivorcedFemales 29.2% Never married34.5% Now married1.3% Separated13.4% Widowed21.6% DivorcedWomen who gave birth in the past 12 months Now married:
100.0% (48)Unmarried:
0.0% (0)
Women who did not give birth in the past 12 months Now married:
32.6% (264)Unmarried:
67.4% (546)
Marital status - Black or African American population 15 years and over
Males 51.2% Never married48.8% Now married0.0% Separated0.0% Widowed0.0% DivorcedFemales 4.8% Never married95.2% Now married0.0% Separated0.0% Widowed0.0% DivorcedWomen who did not give birth in the past 12 months Now married:
93.3% (40)Unmarried:
6.7% (3)
Marital status - Asian population 15 years and over
Males 19.6% Never married73.4% Now married0.0% Separated0.0% Widowed7.1% DivorcedFemales 13.3% Never married75.4% Now married0.0% Separated11.4% Widowed0.0% DivorcedWomen who did not give birth in the past 12 months Now married:
81.7% (138)Unmarried:
18.3% (31)
Marital status - Other race population 15 years and over
Males 16.2% Never married44.3% Now married15.0% Separated3.8% Widowed20.6% DivorcedFemales 15.9% Never married76.7% Now married0.0% Separated0.0% Widowed7.4% DivorcedWomen who gave birth in the past 12 months Now married:
41.7% (28)Unmarried:
58.3% (40)
Women who did not give birth in the past 12 months Now married:
88.6% (168)Unmarried:
11.4% (22)
Marital status - Two or more races population 15 years and over
Males 92.8% Never married0.0% Now married0.0% Separated0.0% Widowed7.2% DivorcedFemales 32.9% Never married43.3% Now married0.0% Separated23.8% Widowed0.0% DivorcedWomen who did not give birth in the past 12 months Now married:
0.0% (0)Unmarried:
100.0% (138)
Marital status - White alone, not Hispanic / Latino population 15 years and over
Males 27.8% Never married47.0% Now married5.0% Separated2.5% Widowed17.7% DivorcedFemales 28.4% Never married35.3% Now married1.4% Separated12.6% Widowed22.4% DivorcedWomen who gave birth in the past 12 months Now married:
100.0% (52)Unmarried:
0.0% (0)
Women who did not give birth in the past 12 months Now married:
34.0% (282)Unmarried:
66.0% (547)
Marital status - Hispanic or Latino population 15 years and over
Males 39.2% Never married37.0% Now married8.1% Separated2.1% Widowed13.6% DivorcedFemales 26.5% Never married56.7% Now married0.0% Separated13.2% Widowed3.6% DivorcedWomen who gave birth in the past 12 months Now married:
41.7% (25)Unmarried:
58.3% (35)
Women who did not give birth in the past 12 months Now married:
50.0% (147)Unmarried:
50.0% (147)
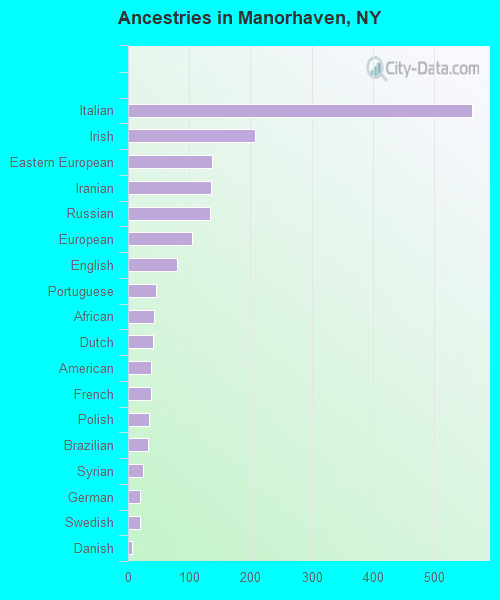
Ancestries in Manorhaven
562 13.3% Italian207 4.9% Irish137 3.2% Eastern European135 3.2% Iranian134 3.2% Russian104 2.5% European80 1.9% English46 1.1% Portuguese43 1.0% African41 1.0% Dutch38 0.9% American37 0.9% French35 0.8% Polish33 0.8% Brazilian25 0.6% Syrian20 0.5% German19 0.5% Swedish7 0.2% Danish
Children Nativity (place of birth) in Manorhaven
Children under 6 years - Living with two parents Both parents native 150 100.0% NativeBoth parents foreign-born 26 57.8% Native19 42.2% Foreign-bornOne native, one foreign-born parent 89 100.0% NativeChildren under 6 years - Living with one parent Foreign-born parent 83 100.0% Native
Children 6 to 17 years - Living with two parents Both parents native 136 100.0% NativeBoth parents foreign-born 360 100.0% NativeOne native, one foreign-born parent 221 100.0% NativeChildren 6 to 17 years - Living with one parent Native parent 212 99.6% Native1 0.4% Foreign-bornForeign-born parent 2 100.0% Native