Races in Manchester, Tennessee (TN) Detailed Stats
Data:
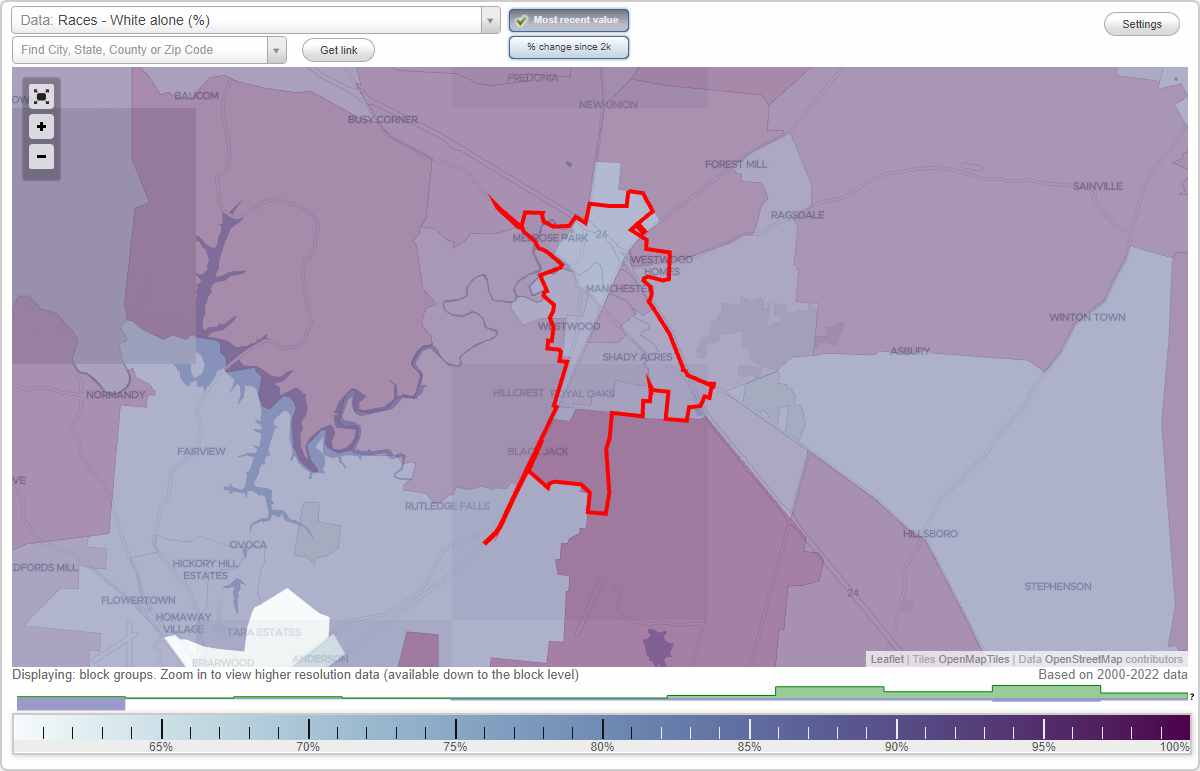
Races - White alone (%)
Races - White alone (% change since 2000)
Races - Black alone (%)
Races - Black alone (% change since 2000)
Races - American Indian alone (%)
Races - American Indian alone (% change since 2000)
Races - Asian alone (%)
Races - Asian alone (% change since 2000)
Races - Hispanic (%)
Races - Hispanic (% change since 2000)
Races - Native Hawaiian and Other Pacific Islander alone (%)
Races - Native Hawaiian and Other Pacific Islander alone (% change since 2000)
Races - Two or more races(%)
Races - Two or more races(% change since 2000)
Races - Other race alone (%)
Races - Other race alone (% change since 2000)
Racial diversity
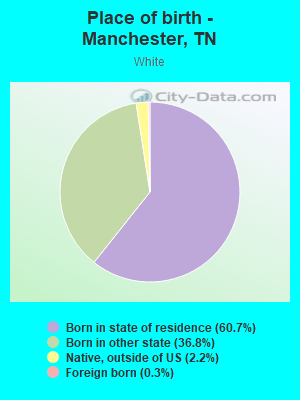
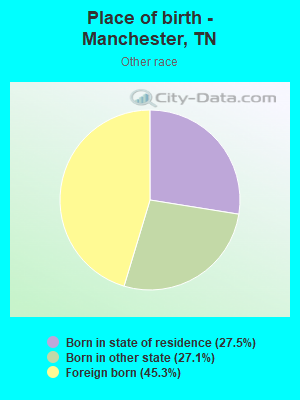
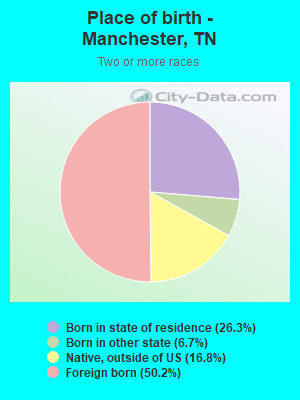
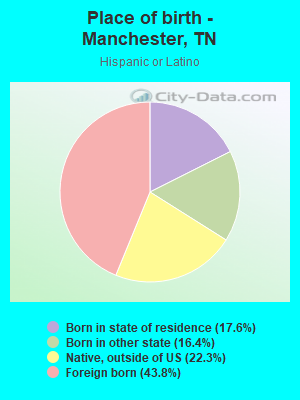
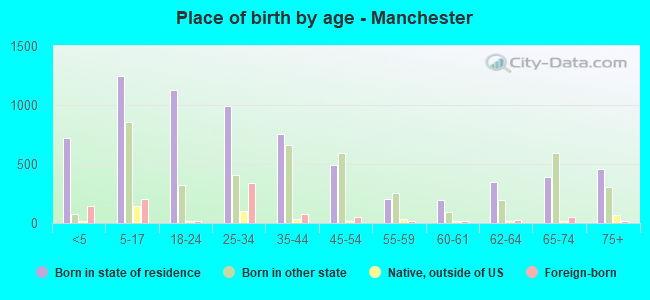
Place of birth - Born in state of residence (%)
Place of birth - Born in state of residence (%) - White
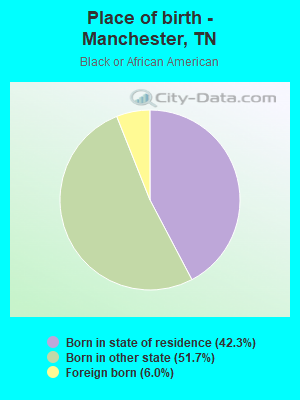
Place of birth - Born in state of residence (%) - Black or African American
Place of birth - Born in state of residence (%) - Asian
Place of birth - Born in state of residence (%) - Hispanic or Latino
Place of birth - Born in state of residence (%) - American Indian and Alaska Native
Place of birth - Born in state of residence (%) - Multirace
Place of birth - Born in state of residence (%) - Other Race
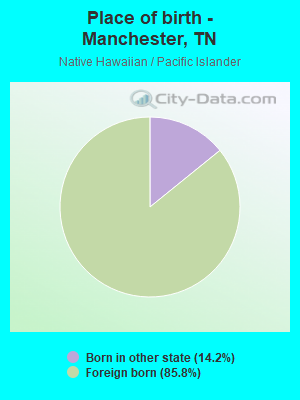
Place of birth - Born in other state (%)
Place of birth - Born in other state (%) - White
Place of birth - Born in other state (%) - Black or African American
Place of birth - Born in other state (%) - Asian
Place of birth - Born in other state (%) - Hispanic or Latino
Place of birth - Born in other state (%) - American Indian and Alaska Native
Place of birth - Born in other state (%) - Multirace
Place of birth - Born in other state (%) - Other Race
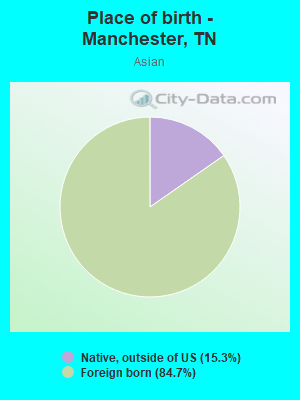
Place of birth - Native, outside of US (%)
Place of birth - Native, outside of US (%) - White
Place of birth - Native, outside of US (%) - Black or African American
Place of birth - Native, outside of US (%) - Asian
Place of birth - Native, outside of US (%) - Hispanic or Latino
Place of birth - Native, outside of US (%) - American Indian and Alaska Native
Place of birth - Native, outside of US (%) - Multirace
Place of birth - Native, outside of US (%) - Other Race
Place of birth - Foreign born (%)
Place of birth - Foreign born (%) - White
Place of birth - Foreign born (%) - Black or African American
Place of birth - Foreign born (%) - Asian
Place of birth - Foreign born (%) - Hispanic or Latino
Place of birth - Foreign born (%) - American Indian and Alaska Native
Place of birth - Foreign born (%) - Multirace
Place of birth - Foreign born (%) - Other Race
Residents speaking English at home (%)
Residents speaking English at home - Born in the United States (%)
Residents speaking English at home - Native, born elsewhere (%)
Residents speaking English at home - Foreign born (%)
Residents speaking Spanish at home (%)
Residents speaking Spanish at home - Born in the United States (%)
Residents speaking Spanish at home - Native, born elsewhere (%)
Residents speaking Spanish at home - Foreign born (%)
Residents speaking other language at home (%)
Residents speaking other language at home - Born in the United States (%)
Residents speaking other language at home - Native, born elsewhere (%)
Residents speaking other language at home - Foreign born (%)
Marital status - Never married (%)
Marital status - Now married (%)
Marital status - Separated (%)
Marital status - Widowed (%)
Marital status - Divorced (%)
Ancestries Reported - Arab (%)
Ancestries Reported - Czech (%)
Ancestries Reported - Danish (%)
Ancestries Reported - Dutch (%)
Ancestries Reported - English (%)
Ancestries Reported - French (%)
Ancestries Reported - French Canadian (%)
Ancestries Reported - German (%)
Ancestries Reported - Greek (%)
Ancestries Reported - Hungarian (%)
Ancestries Reported - Irish (%)
Ancestries Reported - Italian (%)
Ancestries Reported - Lithuanian (%)
Ancestries Reported - Norwegian (%)
Ancestries Reported - Polish (%)
Ancestries Reported - Portuguese (%)
Ancestries Reported - Russian (%)
Ancestries Reported - Scotch-Irish (%)
Ancestries Reported - Scottish (%)
Ancestries Reported - Slovak (%)
Ancestries Reported - Subsaharan African (%)
Ancestries Reported - Swedish (%)
Ancestries Reported - Swiss (%)
Ancestries Reported - Ukrainian (%)
Ancestries Reported - United States (%)
Ancestries Reported - Welsh (%)
Ancestries Reported - West Indian (%)
Ancestries Reported - Other (%)
Geographical mobility - Same house 1 year ago (%)
Geographical mobility - Same house 1 year ago (%) - White
Geographical mobility - Same house 1 year ago (%) - Black or African American
Geographical mobility - Same house 1 year ago (%) - Asian
Geographical mobility - Same house 1 year ago (%) - Hispanic or Latino
Geographical mobility - Same house 1 year ago (%) - American Indian and Alaska Native
Geographical mobility - Same house 1 year ago (%) - Multirace
Geographical mobility - Same house 1 year ago (%) - Other Race
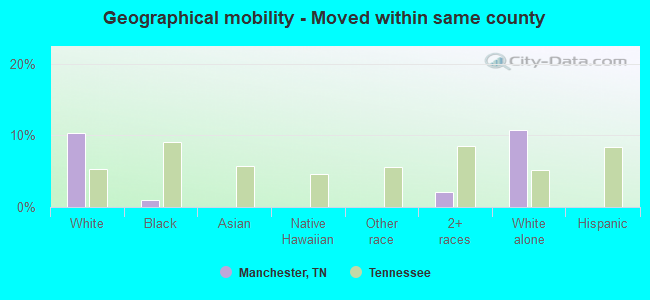
Geographical mobility - Moved within same county (%)
Geographical mobility - Moved within same county (%) - White
Geographical mobility - Moved within same county (%) - Black or African American
Geographical mobility - Moved within same county (%) - Asian
Geographical mobility - Moved within same county (%) - Hispanic or Latino
Geographical mobility - Moved within same county (%) - American Indian and Alaska Native
Geographical mobility - Moved within same county (%) - Multirace
Geographical mobility - Moved within same county (%) - Other Race
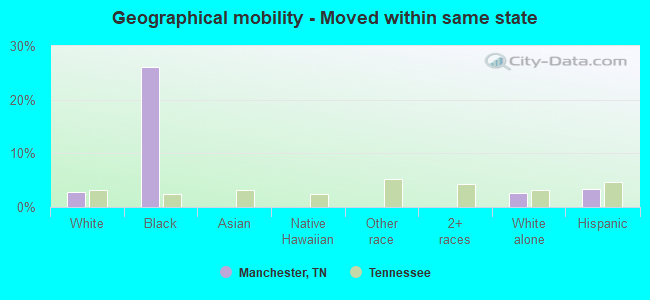
Geographical mobility - Moved from different county within same state (%)
Geographical mobility - Moved from different county within same state (%) - White
Geographical mobility - Moved from different county within same state (%) - Black or African American
Geographical mobility - Moved from different county within same state (%) - Asian
Geographical mobility - Moved from different county within same state (%) - Hispanic or Latino
Geographical mobility - Moved from different county within same state (%) - American Indian and Alaska Native
Geographical mobility - Moved from different county within same state (%) - Multirace
Geographical mobility - Moved from different county within same state (%) - Other Race
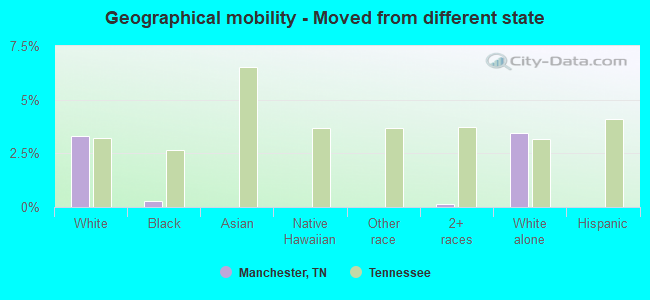
Geographical mobility - Moved from different state (%)
Geographical mobility - Moved from different state (%) - White
Geographical mobility - Moved from different state (%) - Black or African American
Geographical mobility - Moved from different state (%) - Asian
Geographical mobility - Moved from different state (%) - Hispanic or Latino
Geographical mobility - Moved from different state (%) - American Indian and Alaska Native
Geographical mobility - Moved from different state (%) - Multirace
Geographical mobility - Moved from different state (%) - Other Race
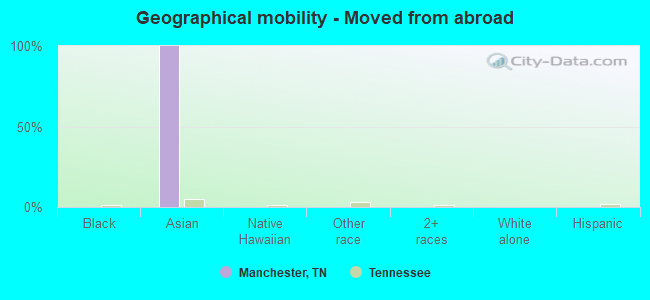
Geographical mobility - Moved from abroad (%)
Geographical mobility - Moved from abroad (%) - White
Geographical mobility - Moved from abroad (%) - Black or African American
Geographical mobility - Moved from abroad (%) - Asian
Geographical mobility - Moved from abroad (%) - Hispanic or Latino
Geographical mobility - Moved from abroad (%) - American Indian and Alaska Native
Geographical mobility - Moved from abroad (%) - Multirace
Geographical mobility - Moved from abroad (%) - Other Race
Place of birth for the foreign-born population - Ireland (%)
Place of birth for the foreign-born population - Denmark (%)
Place of birth for the foreign-born population - Norway (%)
Place of birth for the foreign-born population - Sweden (%)
Place of birth for the foreign-born population - United Kingdom (%)
Place of birth for the foreign-born population - England (%)
Place of birth for the foreign-born population - Scotland (%)
Place of birth for the foreign-born population - Other Northern Europe (%)
Place of birth for the foreign-born population - Austria (%)
Place of birth for the foreign-born population - Belgium (%)
Place of birth for the foreign-born population - France (%)
Place of birth for the foreign-born population - Germany (%)
Place of birth for the foreign-born population - Netherlands (%)
Place of birth for the foreign-born population - Switzerland (%)
Place of birth for the foreign-born population - Other Western Europe (%)
Place of birth for the foreign-born population - Greece (%)
Place of birth for the foreign-born population - Italy (%)
Place of birth for the foreign-born population - Portugal (%)
Place of birth for the foreign-born population - Spain (%)
Place of birth for the foreign-born population - Other Southern Europe (%)
Place of birth for the foreign-born population - Albania (%)
Place of birth for the foreign-born population - Belarus (%)
Place of birth for the foreign-born population - Bosnia and Herzegovina (%)
Place of birth for the foreign-born population - Bulgaria (%)
Place of birth for the foreign-born population - Croatia (%)
Place of birth for the foreign-born population - Czechoslovakia (%)
Place of birth for the foreign-born population - Hungary (%)
Place of birth for the foreign-born population - Latvia (%)
Place of birth for the foreign-born population - Lithuania (%)
Place of birth for the foreign-born population - North Macedonia (Macedonia) (%)
Place of birth for the foreign-born population - Moldova (%)
Place of birth for the foreign-born population - Poland (%)
Place of birth for the foreign-born population - Romania (%)
Place of birth for the foreign-born population - Russia (%)
Place of birth for the foreign-born population - Serbia (%)
Place of birth for the foreign-born population - Ukraine (%)
Place of birth for the foreign-born population - Other Eastern Europe (%)
Place of birth for the foreign-born population - China (%)
Place of birth for the foreign-born population - Hong Kong (%)
Place of birth for the foreign-born population - Taiwan (%)
Place of birth for the foreign-born population - Japan (%)
Place of birth for the foreign-born population - Korea (%)
Place of birth for the foreign-born population - Other Eastern Asia (%)
Place of birth for the foreign-born population - Afghanistan (%)
Place of birth for the foreign-born population - Bangladesh (%)
Place of birth for the foreign-born population - India (%)
Place of birth for the foreign-born population - Iran (%)
Place of birth for the foreign-born population - Kazakhstan (%)
Place of birth for the foreign-born population - Nepal (%)
Place of birth for the foreign-born population - Pakistan (%)
Place of birth for the foreign-born population - Sri Lanka (%)
Place of birth for the foreign-born population - Uzbekistan (%)
Place of birth for the foreign-born population - Other South Central Asia (%)
Place of birth for the foreign-born population - Burma (%)
Place of birth for the foreign-born population - Cambodia (%)
Place of birth for the foreign-born population - Indonesia (%)
Place of birth for the foreign-born population - Laos (%)
Place of birth for the foreign-born population - Malaysia (%)
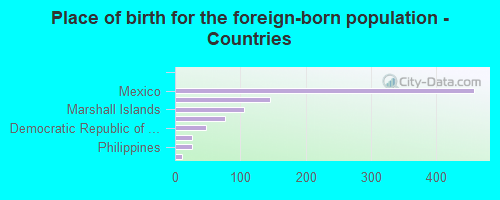
Place of birth for the foreign-born population - Philippines (%)
Place of birth for the foreign-born population - Singapore (%)
Place of birth for the foreign-born population - Thailand (%)
Place of birth for the foreign-born population - Vietnam (%)
Place of birth for the foreign-born population - Other South Eastern Asia (%)
Place of birth for the foreign-born population - Armenia (%)
Place of birth for the foreign-born population - Iraq (%)
Place of birth for the foreign-born population - Israel (%)
Place of birth for the foreign-born population - Jordan (%)
Place of birth for the foreign-born population - Kuwait (%)
Place of birth for the foreign-born population - Lebanon (%)
Place of birth for the foreign-born population - Saudi Arabia (%)
Place of birth for the foreign-born population - Syria (%)
Place of birth for the foreign-born population - Turkey (%)
Place of birth for the foreign-born population - Yemen (%)
Place of birth for the foreign-born population - Other Western Asia (%)
Place of birth for the foreign-born population - Eritrea (%)
Place of birth for the foreign-born population - Ethiopia (%)
Place of birth for the foreign-born population - Kenya (%)
Place of birth for the foreign-born population - Somalia (%)
Place of birth for the foreign-born population - Uganda (%)
Place of birth for the foreign-born population - Zimbabwe (%)
Place of birth for the foreign-born population - Other Eastern Africa (%)
Place of birth for the foreign-born population - Cameroon (%)
Place of birth for the foreign-born population - Congo (%)
Place of birth for the foreign-born population - Democratic Republic of Congo (Zaire) (%)
Place of birth for the foreign-born population - Other Middle Africa (%)
Place of birth for the foreign-born population - Egypt (%)
Place of birth for the foreign-born population - Morocco (%)
Place of birth for the foreign-born population - Sudan (%)
Place of birth for the foreign-born population - Other Northern Africa (%)
Place of birth for the foreign-born population - South Africa (%)
Place of birth for the foreign-born population - Other Southern Africa (%)
Place of birth for the foreign-born population - Cabo Verde (%)
Place of birth for the foreign-born population - Ghana (%)
Place of birth for the foreign-born population - Liberia (%)
Place of birth for the foreign-born population - Nigeria (%)
Place of birth for the foreign-born population - Senegal (%)
Place of birth for the foreign-born population - Sierra Leone (%)
Place of birth for the foreign-born population - Other Western Africa (%)
Place of birth for the foreign-born population - Australia (%)
Place of birth for the foreign-born population - New Zealand (%)
Place of birth for the foreign-born population - Fiji (%)
Place of birth for the foreign-born population - Micronesia (%)
Place of birth for the foreign-born population - Bahamas (%)
Place of birth for the foreign-born population - Barbados (%)
Place of birth for the foreign-born population - Cuba (%)
Place of birth for the foreign-born population - Dominica (%)
Place of birth for the foreign-born population - Dominican Republic (%)
Place of birth for the foreign-born population - Grenada (%)
Place of birth for the foreign-born population - Haiti (%)
Place of birth for the foreign-born population - Jamaica (%)
Place of birth for the foreign-born population - St. Vincent and the Grenadines (%)
Place of birth for the foreign-born population - Trinidad and Tobago (%)
Place of birth for the foreign-born population - West Indies (%)
Place of birth for the foreign-born population - Other Caribbean (%)
Place of birth for the foreign-born population - Belize (%)
Place of birth for the foreign-born population - Costa Rica (%)
Place of birth for the foreign-born population - El Salvador (%)
Place of birth for the foreign-born population - Guatemala (%)
Place of birth for the foreign-born population - Honduras (%)
Place of birth for the foreign-born population - Mexico (%)
Place of birth for the foreign-born population - Nicaragua (%)
Place of birth for the foreign-born population - Panama (%)
Place of birth for the foreign-born population - Other Central America (%)
Place of birth for the foreign-born population - Argentina (%)
Place of birth for the foreign-born population - Bolivia (%)
Place of birth for the foreign-born population - Brazil (%)
Place of birth for the foreign-born population - Chile (%)
Place of birth for the foreign-born population - Colombia (%)
Place of birth for the foreign-born population - Ecuador (%)
Place of birth for the foreign-born population - Guyana (%)
Place of birth for the foreign-born population - Peru (%)
Place of birth for the foreign-born population - Uruguay (%)
Place of birth for the foreign-born population - Venezuela (%)
Place of birth for the foreign-born population - Other South America (%)
Place of birth for the foreign-born population - Canada (%)
Place of birth for the foreign-born population - Other Northern America (%)
Place of birth for the foreign-born population - Other (%)
Latest news about races in Manchester, TN collected exclusively by city-data.com from local newspapers, TV, and radio stations
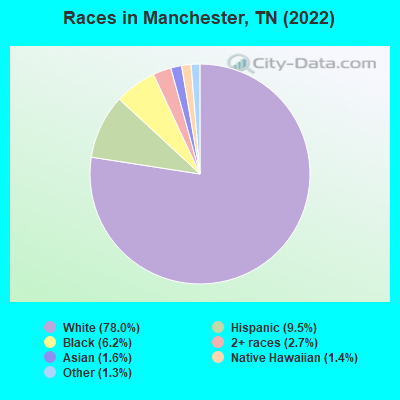
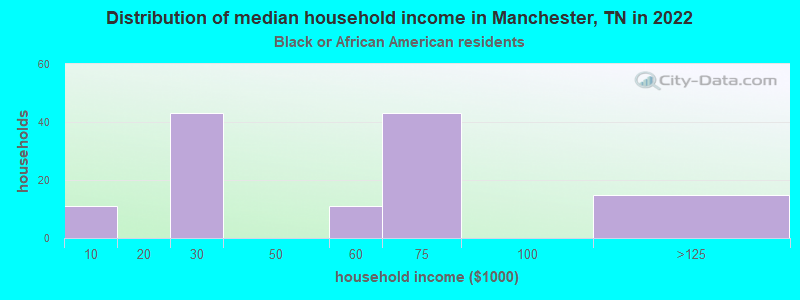
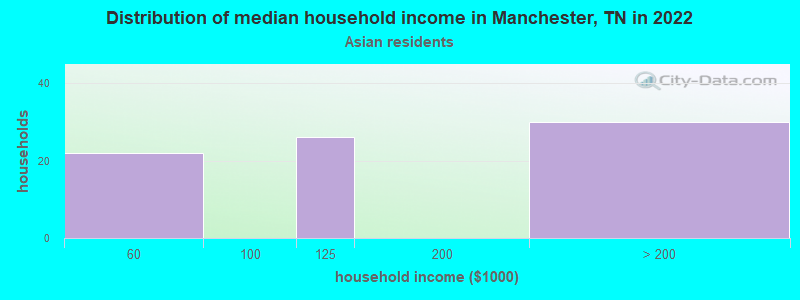
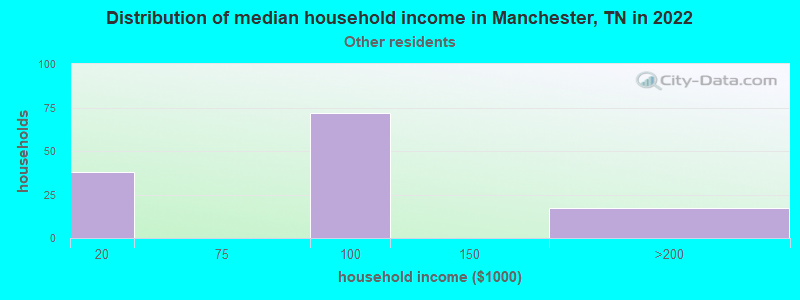
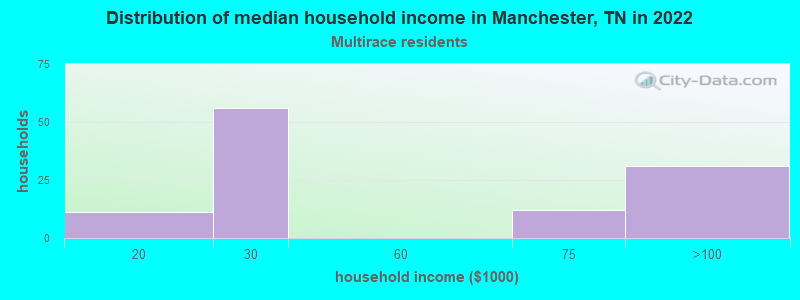
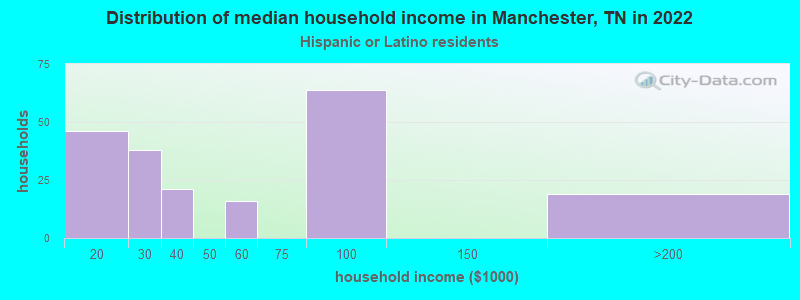
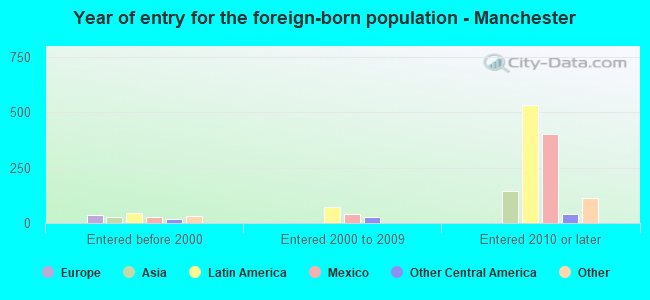
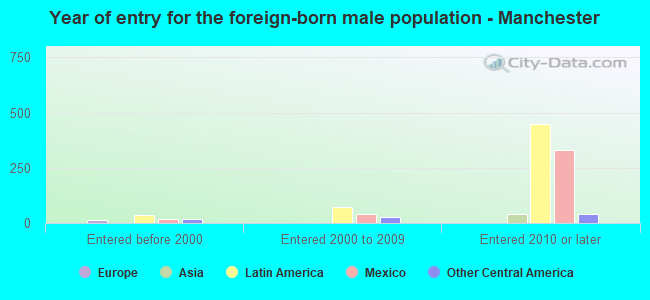
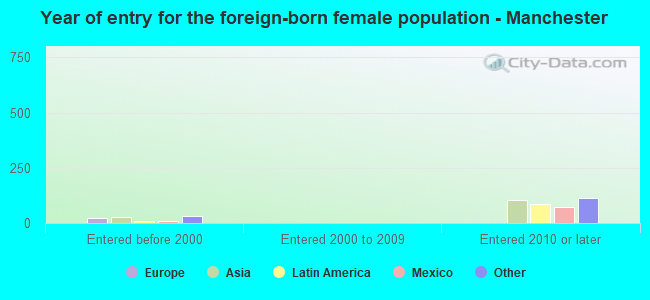
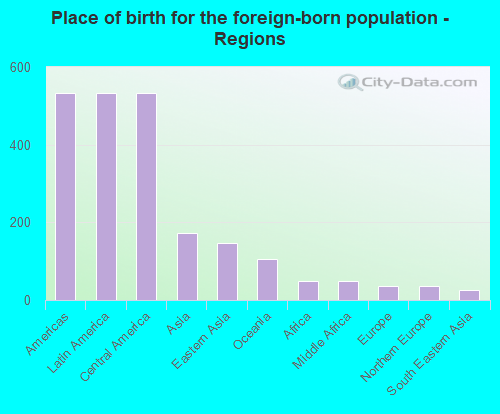
According to 2022 data, the most numerous races in Manchester, TN are White alone (9,796 residents), Black alone (777 residents), and Hispanic (1,197 residents). 92.4% of Manchester residents speak English at home. 7.2% of Manchester, TN residents are foreign-born (4.2% born in Latin America, 1.3% born in Asia, 0.8% born in Oceania), which is 30.2% greater than the foreign-born rate of 5.0% across the entire state of Tennessee.
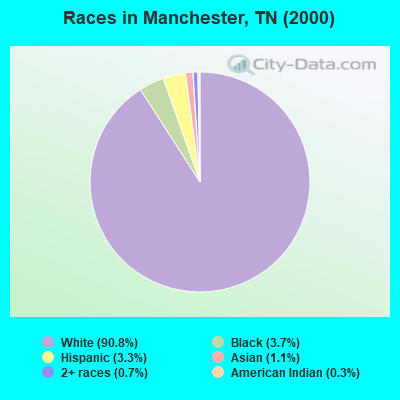
Race distribution in Manchester
2000 2022
4,505,930 79.2% White alone 928,204 16.3% Black alone 123,838 2.2% Hispanic 54,824 1.0% Two or more races 56,077 1.0% Asian alone 13,820 0.2% American Indian alone 4,780 0.08% Other race alone 1,810 0.03% Native Hawaiian and Other
5,070,026 71.9% White alone 1,089,738 15.5% Black alone 442,629 6.3% Hispanic 279,381 4.0% Two or more races 131,817 1.9% Asian alone 26,972 0.4% Other race alone 6,387 0.09% American Indian alone 4,389 0.06% Native Hawaiian and Other
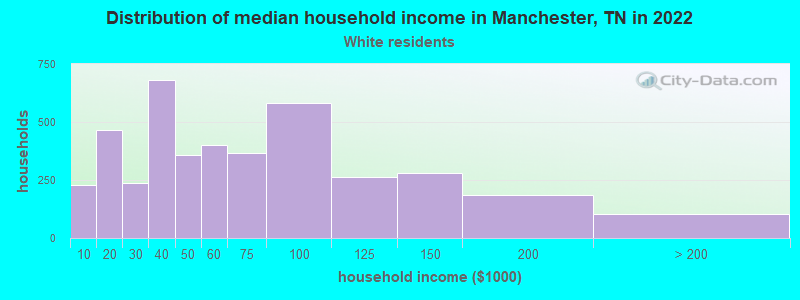
Income and house value in Manchester Median household income in 2022 $53,873 White non-Hispanic householders$76,398 Some other race householdersMedian 2022 house value $255,854 White Non-Hispanic householders$193,584 Black or African American householders $362,971 Asian householders$200,037 Some other race householders$274,244 Two or more races householders$188,099 Hispanic or Latino householders
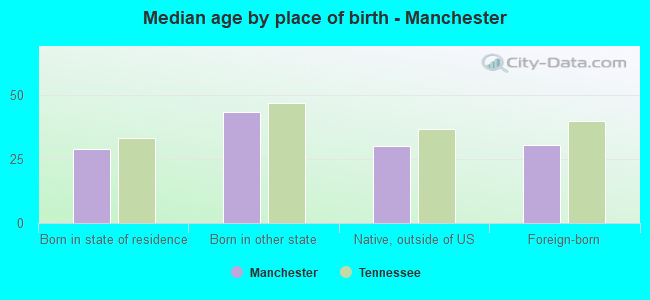
Median age by race in Manchester
35.6 Median age for White residents32.6 37.0 20.8 Median age for Black or African American residents17.2 23.0 -681,948,423.4 Median age for American Indian / Alaska Native residents-633,911,367.4 -801,477,376.9 36.7 Median age for Asian residents35.5 36.8 45.3 Median age for Native Hawaiian / Pacific Islander residents-951,707,890.7 37.6 31.5 Median age for Other race residents29.6 49.4 20.7 Median age for Two or more races residents24.4 19.9 36.1 Median age for White alone residents32.6 40.6 21.2 Median age for Hispanic or Latino residents29.1 11.9
Owner/renter occupied households by race in Manchester
House owners and renters - White residents 2,159 51.5% Owner occupied2,030 48.5% Renter occupiedHouse owners and renters - Black or African American residents 46 37.4% Owner occupied77 62.6% Renter occupiedHouse owners and renters - Asian residents 65 79.5% Owner occupied17 20.5% Renter occupiedHouse owners and renters - Native Hawaiian / Pacific Islander residents 40 100.0% Owner occupiedHouse owners and renters - Other race residents 103 69.0% Owner occupied46 31.0% Renter occupiedHouse owners and renters - Two or more races residents 41 32.0% Owner occupied88 68.0% Renter occupiedHouse owners and renters - White alone residents 2,126 50.9% Owner occupied2,051 49.1% Renter occupiedHouse owners and renters - Hispanic or Latino residents 87 41.4% Owner occupied124 58.6% Renter occupied
Language usage in Manchester
English speakers - Total 92.4% of residents of Manchester speak English at home.
5.6% of residents speak Spanish at home 146 22.5% Speak English very well504 77.5% Speak English less than very well2.2% of residents speak other language at home 164 64.8% Speak English very well89 35.2% Speak English less than very well
English speakers - Born in the United States 98.3% of residents of Manchester speak English at home.
1.4% of residents speak Spanish at home 46 78.0% Speak English very well13 22.0% Speak English less than very well0.3% of residents speak other language at home 12 100.0% Speak English very well
English speakers - Native, born elsewhere 71.9% of residents of Manchester speak English at home.
28.8% of residents speak Spanish at home 34 29.1% Speak English very well83 70.9% Speak English less than very well
English speakers - Foreign-born 17.5% of residents of Manchester speak English at home.
55.0% of residents speak Spanish at home 30 7.2% Speak English very well389 92.8% Speak English less than very well29.3% of residents speak other language at home 135 60.5% Speak English very well88 39.5% Speak English less than very well
White (Caucasian) - Speak only English Native:
99.3% (9,269)Foreign-born:
100.0% (32)
White (Caucasian) - Speak another language Native:
0.9% (80)Foreign-born:
14.7% (5)
Black or African American - Speak only English Native:
99.9% (729)Foreign-born:
100.0% (47)
Asian - Speak only English Native:
97.6% (26)Foreign-born:
20.6% (30)
Native Hawaiian / Pacific Islander - Speak only English Native:
100.0% (25)Foreign-born:
0.7% (1)
Other race - Speak only English Native:
60.7% (139)Foreign-born:
7.7% (14)
Other race - Speak another language Native:
40.4% (93)Foreign-born:
91.7% (172)
Two or more races - Speak another language Native:
19.9% (111)Foreign-born:
99.8% (416)
White alone - Speak only English Native:
99.5% (8,957)Foreign-born:
96.7% (35)
Hispanic or Latino - Speak another language Native:
27.6% (187)Foreign-born:
100.0% (410)
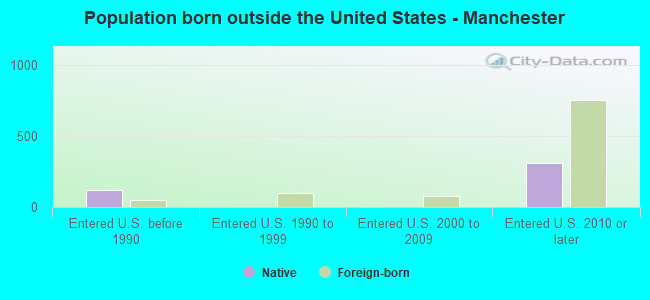
Foreign-born residents in Manchester 899 residents are foreign born (4.2% Latin America , 1.3% Asia , 0.8% Oceania ).
This city:
7.2%Tennessee:
5.4%
Marital status for residents in Manchester Marital status - White (Caucasian) population 15 years and over
Males 37.9% Never married37.7% Now married2.2% Separated5.9% Widowed16.3% DivorcedFemales 22.0% Never married42.9% Now married0.9% Separated8.8% Widowed25.3% DivorcedWomen who gave birth in the past 12 months Now married:
73.1% (38)Unmarried:
26.9% (14)
Women who did not give birth in the past 12 months Now married:
40.5% (849)Unmarried:
59.5% (1,245)
Marital status - Black or African American population 15 years and over
Males 66.8% Never married18.0% Now married0.0% Separated0.0% Widowed15.2% DivorcedFemales 70.3% Never married4.4% Now married3.5% Separated2.9% Widowed18.8% DivorcedWomen who did not give birth in the past 12 months Now married:
9.2% (26)Unmarried:
90.8% (257)
Marital status - Asian population 15 years and over
Males 0.0% Never married100.0% Now married0.0% Separated0.0% Widowed0.0% DivorcedFemales 0.0% Never married65.1% Now married0.0% Separated0.0% Widowed34.9% DivorcedWomen who did not give birth in the past 12 months Now married:
100.0% (32)Unmarried:
0.0% (0)
Marital status - Native Hawaiian / Pacific Islander population 15 years and over
Males 100.0% Never married0.0% Now married0.0% Separated0.0% Widowed0.0% DivorcedFemales 46.8% Never married34.7% Now married0.0% Separated0.0% Widowed18.5% DivorcedWomen who did not give birth in the past 12 months Now married:
42.6% (40)Unmarried:
57.4% (54)
Marital status - Other race population 15 years and over
Males 26.0% Never married65.7% Now married0.0% Separated0.0% Widowed8.3% DivorcedFemales 39.4% Never married47.5% Now married0.0% Separated0.0% Widowed13.1% DivorcedWomen who did not give birth in the past 12 months Now married:
29.1% (36)Unmarried:
70.9% (87)
Marital status - Two or more races population 15 years and over
Males 18.1% Never married73.2% Now married5.7% Separated0.0% Widowed3.0% DivorcedFemales 72.8% Never married27.2% Now married0.0% Separated0.0% Widowed0.0% DivorcedWomen who did not give birth in the past 12 months Now married:
27.2% (65)Unmarried:
72.8% (176)
Marital status - White alone, not Hispanic / Latino population 15 years and over
Males 37.9% Never married37.5% Now married2.3% Separated6.0% Widowed16.3% DivorcedFemales 21.7% Never married42.3% Now married0.9% Separated9.1% Widowed26.0% DivorcedWomen who gave birth in the past 12 months Now married:
73.1% (38)Unmarried:
26.9% (14)
Women who did not give birth in the past 12 months Now married:
40.0% (821)Unmarried:
60.0% (1,232)
Marital status - Hispanic or Latino population 15 years and over
Males 16.7% Never married79.6% Now married0.0% Separated0.0% Widowed3.7% DivorcedFemales 36.5% Never married58.7% Now married0.0% Separated0.0% Widowed4.8% DivorcedWomen who did not give birth in the past 12 months Now married:
53.6% (108)Unmarried:
46.4% (94)
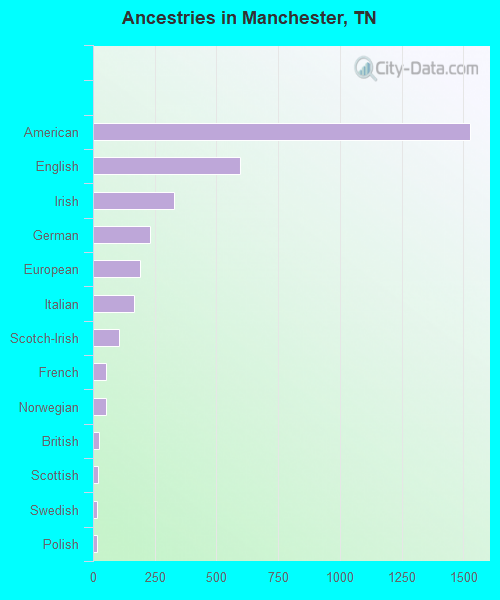
Ancestries in Manchester
1,528 26.5% American597 10.4% English329 5.7% Irish232 4.0% German190 3.3% European166 2.9% Italian107 1.9% Scotch-Irish52 0.9% French52 0.9% Norwegian23 0.4% British20 0.3% Scottish16 0.3% Swedish15 0.3% Polish
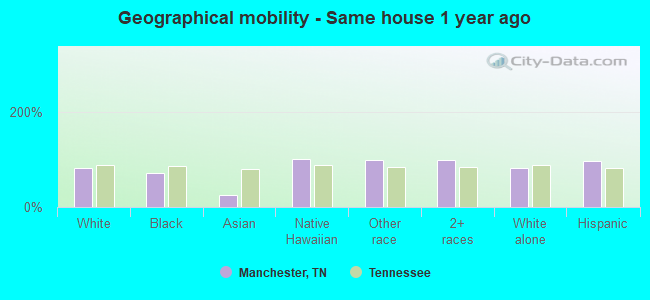
Geographical mobility in Manchester Same house 1 year ago 8,078 82.1% White (Caucasian)563 72.4% Black or African American50 25.2% Asian134 100.0% Native Hawaiian / Pacific Islander405 99.0% Other race1,111 97.7% Two or more races7,827 81.6% White alone, not Hispanic / Latino1,150 96.0% Hispanic or LatinoMoved within same county 1,015 10.3% White / Caucasian7 0.9% Black or African American24 2.1% Two or more races1,028 10.7% White alone, not Hispanic / LatinoMoved within same state 275 2.8% White / Caucasian203 26.1% Black or African American250 2.6% White alone, not Hispanic / Latino40 3.4% Hispanic or LatinoMoved from different state 327 3.3% White / Caucasian2 0.3% Black or African American1 0.1% Two or more races333 3.5% White alone, not Hispanic / LatinoMoved from abroad 21 0.2% White258 100.0% Asian25 0.3% White alone, not Hispanic / Latino
Children Nativity (place of birth) in Manchester
Children under 6 years - Living with two parents Both parents native 509 100.0% NativeBoth parents foreign-born 170 100.0% Foreign-bornOne native, one foreign-born parent 104 100.0% NativeChildren under 6 years - Living with one parent Native parent 419 100.0% NativeChildren 6 to 17 years - Living with two parents Both parents native 843 95.3% Native42 4.7% Foreign-bornBoth parents foreign-born 170 100.0% Foreign-bornOne native, one foreign-born parent 79 100.0% NativeChildren 6 to 17 years - Living with one parent Native parent 896 100.0% Native
Grandparents responsible for own grandchildren in Manchester
Grandparents (30 to 59 years) White / Caucasian 51 39.5% Responsible for grandchildren78 60.5% Not responsible for grandchildrenOther race 40 100.0% Not responsible for grandchildrenWhite alone, not Hispanic / Latino 51 39.0% Responsible for grandchildren80 61.0% Not responsible for grandchildrenHispanic or Latino 18 100.0% Not responsible for grandchildren
Grandparents (60 years and over) White / Caucasian 58 100.0% Responsible for grandchildrenWhite alone, not Hispanic / Latino 59 100.0% Responsible for grandchildren