Races in Lynbrook, New York (NY) Detailed Stats
Data:
Races - White alone (%)
Races - White alone (% change since 2000)
Races - Black alone (%)
Races - Black alone (% change since 2000)
Races - American Indian alone (%)
Races - American Indian alone (% change since 2000)
Races - Asian alone (%)
Races - Asian alone (% change since 2000)
Races - Hispanic (%)
Races - Hispanic (% change since 2000)
Races - Native Hawaiian and Other Pacific Islander alone (%)
Races - Native Hawaiian and Other Pacific Islander alone (% change since 2000)
Races - Two or more races(%)
Races - Two or more races(% change since 2000)
Races - Other race alone (%)
Races - Other race alone (% change since 2000)
Racial diversity
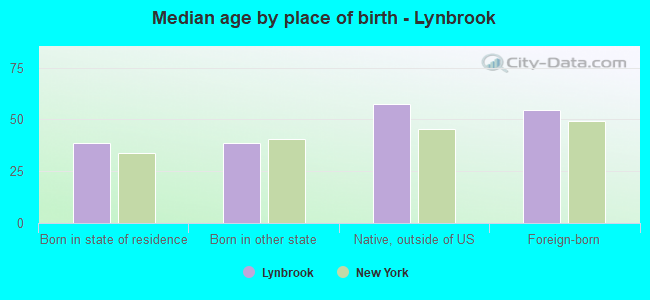
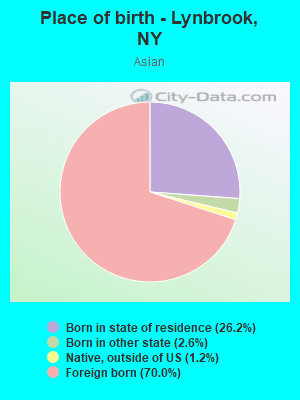
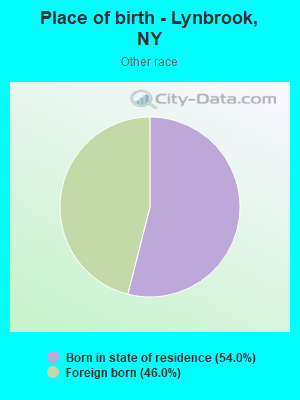
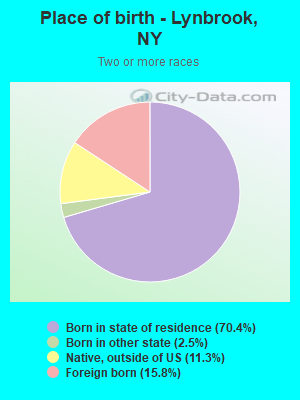
Place of birth - Born in state of residence (%)
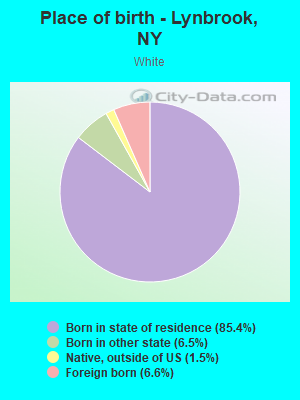
Place of birth - Born in state of residence (%) - White
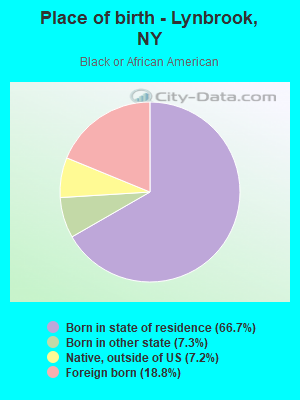
Place of birth - Born in state of residence (%) - Black or African American
Place of birth - Born in state of residence (%) - Asian
Place of birth - Born in state of residence (%) - Hispanic or Latino
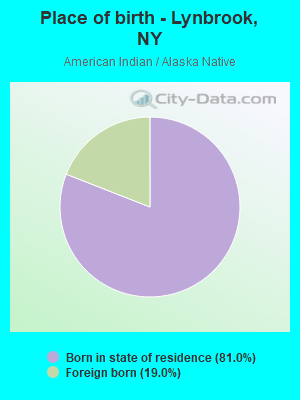
Place of birth - Born in state of residence (%) - American Indian and Alaska Native
Place of birth - Born in state of residence (%) - Multirace
Place of birth - Born in state of residence (%) - Other Race
Place of birth - Born in other state (%)
Place of birth - Born in other state (%) - White
Place of birth - Born in other state (%) - Black or African American
Place of birth - Born in other state (%) - Asian
Place of birth - Born in other state (%) - Hispanic or Latino
Place of birth - Born in other state (%) - American Indian and Alaska Native
Place of birth - Born in other state (%) - Multirace
Place of birth - Born in other state (%) - Other Race
Place of birth - Native, outside of US (%)
Place of birth - Native, outside of US (%) - White
Place of birth - Native, outside of US (%) - Black or African American
Place of birth - Native, outside of US (%) - Asian
Place of birth - Native, outside of US (%) - Hispanic or Latino
Place of birth - Native, outside of US (%) - American Indian and Alaska Native
Place of birth - Native, outside of US (%) - Multirace
Place of birth - Native, outside of US (%) - Other Race
Place of birth - Foreign born (%)
Place of birth - Foreign born (%) - White
Place of birth - Foreign born (%) - Black or African American
Place of birth - Foreign born (%) - Asian
Place of birth - Foreign born (%) - Hispanic or Latino
Place of birth - Foreign born (%) - American Indian and Alaska Native
Place of birth - Foreign born (%) - Multirace
Place of birth - Foreign born (%) - Other Race
Residents speaking English at home (%)
Residents speaking English at home - Born in the United States (%)
Residents speaking English at home - Native, born elsewhere (%)
Residents speaking English at home - Foreign born (%)
Residents speaking Spanish at home (%)
Residents speaking Spanish at home - Born in the United States (%)
Residents speaking Spanish at home - Native, born elsewhere (%)
Residents speaking Spanish at home - Foreign born (%)
Residents speaking other language at home (%)
Residents speaking other language at home - Born in the United States (%)
Residents speaking other language at home - Native, born elsewhere (%)
Residents speaking other language at home - Foreign born (%)
Marital status - Never married (%)
Marital status - Now married (%)
Marital status - Separated (%)
Marital status - Widowed (%)
Marital status - Divorced (%)
Ancestries Reported - Arab (%)
Ancestries Reported - Czech (%)
Ancestries Reported - Danish (%)
Ancestries Reported - Dutch (%)
Ancestries Reported - English (%)
Ancestries Reported - French (%)
Ancestries Reported - French Canadian (%)
Ancestries Reported - German (%)
Ancestries Reported - Greek (%)
Ancestries Reported - Hungarian (%)
Ancestries Reported - Irish (%)
Ancestries Reported - Italian (%)
Ancestries Reported - Lithuanian (%)
Ancestries Reported - Norwegian (%)
Ancestries Reported - Polish (%)
Ancestries Reported - Portuguese (%)
Ancestries Reported - Russian (%)
Ancestries Reported - Scotch-Irish (%)
Ancestries Reported - Scottish (%)
Ancestries Reported - Slovak (%)
Ancestries Reported - Subsaharan African (%)
Ancestries Reported - Swedish (%)
Ancestries Reported - Swiss (%)
Ancestries Reported - Ukrainian (%)
Ancestries Reported - United States (%)
Ancestries Reported - Welsh (%)
Ancestries Reported - West Indian (%)
Ancestries Reported - Other (%)
Geographical mobility - Same house 1 year ago (%)
Geographical mobility - Same house 1 year ago (%) - White
Geographical mobility - Same house 1 year ago (%) - Black or African American
Geographical mobility - Same house 1 year ago (%) - Asian
Geographical mobility - Same house 1 year ago (%) - Hispanic or Latino
Geographical mobility - Same house 1 year ago (%) - American Indian and Alaska Native
Geographical mobility - Same house 1 year ago (%) - Multirace
Geographical mobility - Same house 1 year ago (%) - Other Race
Geographical mobility - Moved within same county (%)
Geographical mobility - Moved within same county (%) - White
Geographical mobility - Moved within same county (%) - Black or African American
Geographical mobility - Moved within same county (%) - Asian
Geographical mobility - Moved within same county (%) - Hispanic or Latino
Geographical mobility - Moved within same county (%) - American Indian and Alaska Native
Geographical mobility - Moved within same county (%) - Multirace
Geographical mobility - Moved within same county (%) - Other Race
Geographical mobility - Moved from different county within same state (%)
Geographical mobility - Moved from different county within same state (%) - White
Geographical mobility - Moved from different county within same state (%) - Black or African American
Geographical mobility - Moved from different county within same state (%) - Asian
Geographical mobility - Moved from different county within same state (%) - Hispanic or Latino
Geographical mobility - Moved from different county within same state (%) - American Indian and Alaska Native
Geographical mobility - Moved from different county within same state (%) - Multirace
Geographical mobility - Moved from different county within same state (%) - Other Race
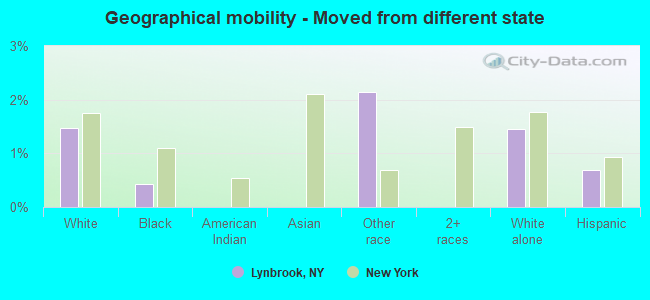
Geographical mobility - Moved from different state (%)
Geographical mobility - Moved from different state (%) - White
Geographical mobility - Moved from different state (%) - Black or African American
Geographical mobility - Moved from different state (%) - Asian
Geographical mobility - Moved from different state (%) - Hispanic or Latino
Geographical mobility - Moved from different state (%) - American Indian and Alaska Native
Geographical mobility - Moved from different state (%) - Multirace
Geographical mobility - Moved from different state (%) - Other Race
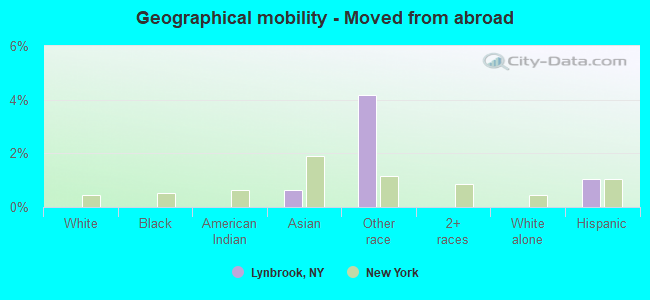
Geographical mobility - Moved from abroad (%)
Geographical mobility - Moved from abroad (%) - White
Geographical mobility - Moved from abroad (%) - Black or African American
Geographical mobility - Moved from abroad (%) - Asian
Geographical mobility - Moved from abroad (%) - Hispanic or Latino
Geographical mobility - Moved from abroad (%) - American Indian and Alaska Native
Geographical mobility - Moved from abroad (%) - Multirace
Geographical mobility - Moved from abroad (%) - Other Race
Place of birth for the foreign-born population - Ireland (%)
Place of birth for the foreign-born population - Denmark (%)
Place of birth for the foreign-born population - Norway (%)
Place of birth for the foreign-born population - Sweden (%)
Place of birth for the foreign-born population - United Kingdom (%)
Place of birth for the foreign-born population - England (%)
Place of birth for the foreign-born population - Scotland (%)
Place of birth for the foreign-born population - Other Northern Europe (%)
Place of birth for the foreign-born population - Austria (%)
Place of birth for the foreign-born population - Belgium (%)
Place of birth for the foreign-born population - France (%)
Place of birth for the foreign-born population - Germany (%)
Place of birth for the foreign-born population - Netherlands (%)
Place of birth for the foreign-born population - Switzerland (%)
Place of birth for the foreign-born population - Other Western Europe (%)
Place of birth for the foreign-born population - Greece (%)
Place of birth for the foreign-born population - Italy (%)
Place of birth for the foreign-born population - Portugal (%)
Place of birth for the foreign-born population - Spain (%)
Place of birth for the foreign-born population - Other Southern Europe (%)
Place of birth for the foreign-born population - Albania (%)
Place of birth for the foreign-born population - Belarus (%)
Place of birth for the foreign-born population - Bosnia and Herzegovina (%)
Place of birth for the foreign-born population - Bulgaria (%)
Place of birth for the foreign-born population - Croatia (%)
Place of birth for the foreign-born population - Czechoslovakia (%)
Place of birth for the foreign-born population - Hungary (%)
Place of birth for the foreign-born population - Latvia (%)
Place of birth for the foreign-born population - Lithuania (%)
Place of birth for the foreign-born population - North Macedonia (Macedonia) (%)
Place of birth for the foreign-born population - Moldova (%)
Place of birth for the foreign-born population - Poland (%)
Place of birth for the foreign-born population - Romania (%)
Place of birth for the foreign-born population - Russia (%)
Place of birth for the foreign-born population - Serbia (%)
Place of birth for the foreign-born population - Ukraine (%)
Place of birth for the foreign-born population - Other Eastern Europe (%)
Place of birth for the foreign-born population - China (%)
Place of birth for the foreign-born population - Hong Kong (%)
Place of birth for the foreign-born population - Taiwan (%)
Place of birth for the foreign-born population - Japan (%)
Place of birth for the foreign-born population - Korea (%)
Place of birth for the foreign-born population - Other Eastern Asia (%)
Place of birth for the foreign-born population - Afghanistan (%)
Place of birth for the foreign-born population - Bangladesh (%)
Place of birth for the foreign-born population - India (%)
Place of birth for the foreign-born population - Iran (%)
Place of birth for the foreign-born population - Kazakhstan (%)
Place of birth for the foreign-born population - Nepal (%)
Place of birth for the foreign-born population - Pakistan (%)
Place of birth for the foreign-born population - Sri Lanka (%)
Place of birth for the foreign-born population - Uzbekistan (%)
Place of birth for the foreign-born population - Other South Central Asia (%)
Place of birth for the foreign-born population - Burma (%)
Place of birth for the foreign-born population - Cambodia (%)
Place of birth for the foreign-born population - Indonesia (%)
Place of birth for the foreign-born population - Laos (%)
Place of birth for the foreign-born population - Malaysia (%)
Place of birth for the foreign-born population - Philippines (%)
Place of birth for the foreign-born population - Singapore (%)
Place of birth for the foreign-born population - Thailand (%)
Place of birth for the foreign-born population - Vietnam (%)
Place of birth for the foreign-born population - Other South Eastern Asia (%)
Place of birth for the foreign-born population - Armenia (%)
Place of birth for the foreign-born population - Iraq (%)
Place of birth for the foreign-born population - Israel (%)
Place of birth for the foreign-born population - Jordan (%)
Place of birth for the foreign-born population - Kuwait (%)
Place of birth for the foreign-born population - Lebanon (%)
Place of birth for the foreign-born population - Saudi Arabia (%)
Place of birth for the foreign-born population - Syria (%)
Place of birth for the foreign-born population - Turkey (%)
Place of birth for the foreign-born population - Yemen (%)
Place of birth for the foreign-born population - Other Western Asia (%)
Place of birth for the foreign-born population - Eritrea (%)
Place of birth for the foreign-born population - Ethiopia (%)
Place of birth for the foreign-born population - Kenya (%)
Place of birth for the foreign-born population - Somalia (%)
Place of birth for the foreign-born population - Uganda (%)
Place of birth for the foreign-born population - Zimbabwe (%)
Place of birth for the foreign-born population - Other Eastern Africa (%)
Place of birth for the foreign-born population - Cameroon (%)
Place of birth for the foreign-born population - Congo (%)
Place of birth for the foreign-born population - Democratic Republic of Congo (Zaire) (%)
Place of birth for the foreign-born population - Other Middle Africa (%)
Place of birth for the foreign-born population - Egypt (%)
Place of birth for the foreign-born population - Morocco (%)
Place of birth for the foreign-born population - Sudan (%)
Place of birth for the foreign-born population - Other Northern Africa (%)
Place of birth for the foreign-born population - South Africa (%)
Place of birth for the foreign-born population - Other Southern Africa (%)
Place of birth for the foreign-born population - Cabo Verde (%)
Place of birth for the foreign-born population - Ghana (%)
Place of birth for the foreign-born population - Liberia (%)
Place of birth for the foreign-born population - Nigeria (%)
Place of birth for the foreign-born population - Senegal (%)
Place of birth for the foreign-born population - Sierra Leone (%)
Place of birth for the foreign-born population - Other Western Africa (%)
Place of birth for the foreign-born population - Australia (%)
Place of birth for the foreign-born population - New Zealand (%)
Place of birth for the foreign-born population - Fiji (%)
Place of birth for the foreign-born population - Micronesia (%)
Place of birth for the foreign-born population - Bahamas (%)
Place of birth for the foreign-born population - Barbados (%)
Place of birth for the foreign-born population - Cuba (%)
Place of birth for the foreign-born population - Dominica (%)
Place of birth for the foreign-born population - Dominican Republic (%)
Place of birth for the foreign-born population - Grenada (%)
Place of birth for the foreign-born population - Haiti (%)
Place of birth for the foreign-born population - Jamaica (%)
Place of birth for the foreign-born population - St. Vincent and the Grenadines (%)
Place of birth for the foreign-born population - Trinidad and Tobago (%)
Place of birth for the foreign-born population - West Indies (%)
Place of birth for the foreign-born population - Other Caribbean (%)
Place of birth for the foreign-born population - Belize (%)
Place of birth for the foreign-born population - Costa Rica (%)
Place of birth for the foreign-born population - El Salvador (%)
Place of birth for the foreign-born population - Guatemala (%)
Place of birth for the foreign-born population - Honduras (%)
Place of birth for the foreign-born population - Mexico (%)
Place of birth for the foreign-born population - Nicaragua (%)
Place of birth for the foreign-born population - Panama (%)
Place of birth for the foreign-born population - Other Central America (%)
Place of birth for the foreign-born population - Argentina (%)
Place of birth for the foreign-born population - Bolivia (%)
Place of birth for the foreign-born population - Brazil (%)
Place of birth for the foreign-born population - Chile (%)
Place of birth for the foreign-born population - Colombia (%)
Place of birth for the foreign-born population - Ecuador (%)
Place of birth for the foreign-born population - Guyana (%)
Place of birth for the foreign-born population - Peru (%)
Place of birth for the foreign-born population - Uruguay (%)
Place of birth for the foreign-born population - Venezuela (%)
Place of birth for the foreign-born population - Other South America (%)
Place of birth for the foreign-born population - Canada (%)
Place of birth for the foreign-born population - Other Northern America (%)
Place of birth for the foreign-born population - Other (%)
Is buying an old Tudor house in Lynbrook, Nassau County a good idea? (13 replies)Looking to buy within a ~45min commute to Penn Station (Port W, Lynbrook, Rockeville Center, Baldwin,Freeport, Merrick) (109 replies)Termites in Perspective House: Lynbrook, NY (12 replies)Lynbrook/Merrick Woods Young Couple (54 replies)Lynbrook - Cost of Living (46 replies)Considering moving to Valley Stream,Lynbrook, East Rockaway, Oceanside etc. (1 reply)
Latest news about races in Lynbrook, NY collected exclusively by city-data.com from local newspapers, TV, and radio stations
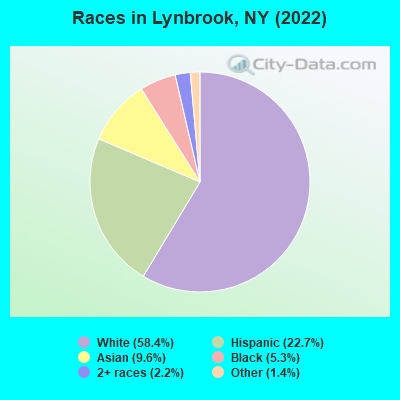
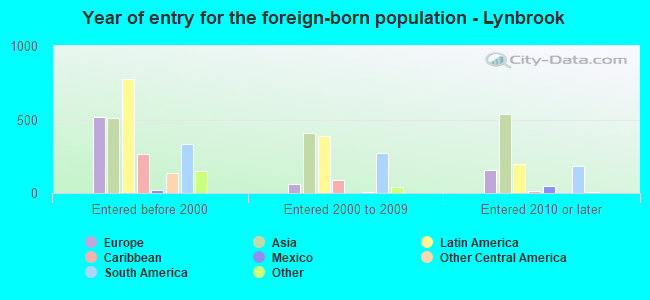
According to 2022 data, the most numerous races in Lynbrook, NY are White alone (11,798 residents), Hispanic (4,592 residents), and Black alone (1,078 residents). 73.6% of Lynbrook residents speak English at home. 17.2% of Lynbrook, NY residents are foreign-born (7.0% born in Latin America, 6.1% born in Asia, 3.5% born in Europe), which is 27.9% less than the foreign-born rate of 22.0% across the entire state of New York.
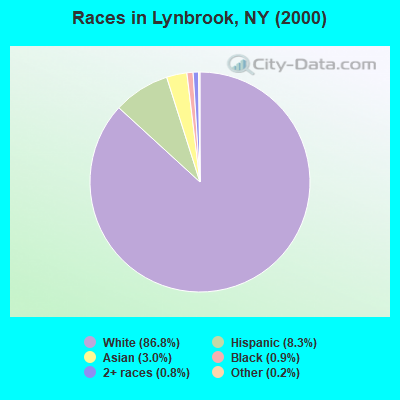
Race distribution in Lynbrook
2000 2022
11,760,981 62.0% White alone 2,867,583 15.1% Hispanic 2,812,623 14.8% Black alone 1,035,926 5.5% Asian alone 366,116 1.9% Two or more races 75,499 0.4% Other race alone 52,499 0.3% American Indian alone 5,230 0.03% Native Hawaiian and Other
10,408,933 52.9% White alone 3,867,299 19.7% Hispanic 2,633,840 13.4% Black alone 1,776,286 9.0% Asian alone 732,670 3.7% Two or more races 216,110 1.1% Other race alone 35,082 0.2% American Indian alone 6,931 0.04% Native Hawaiian and Other
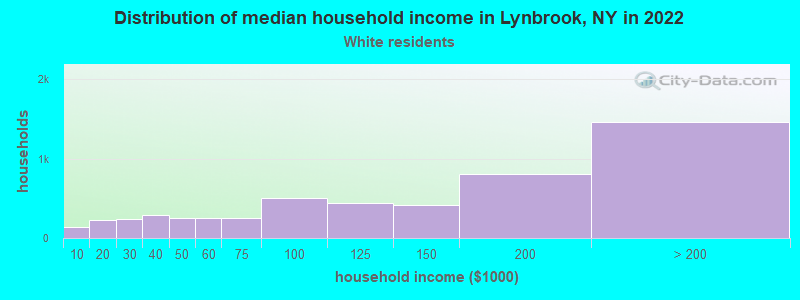
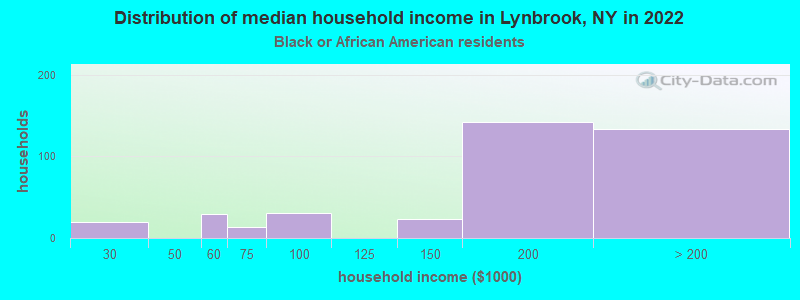
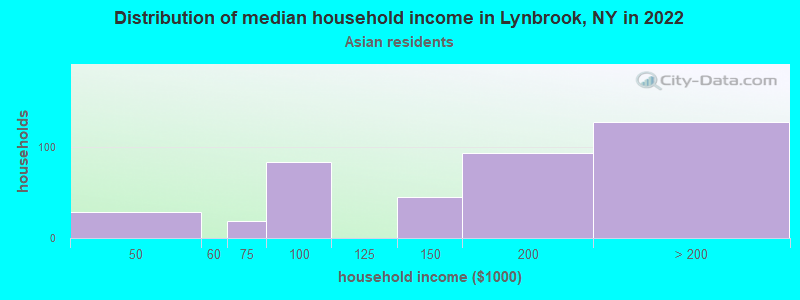
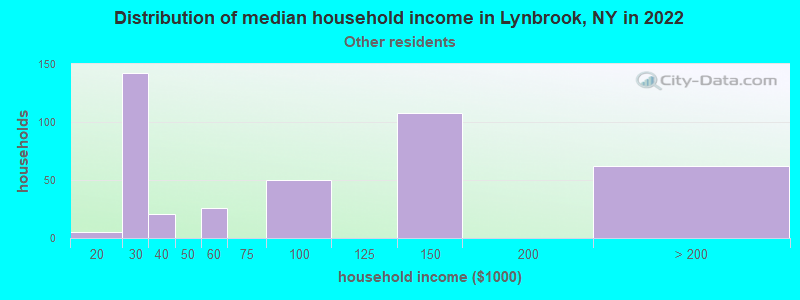
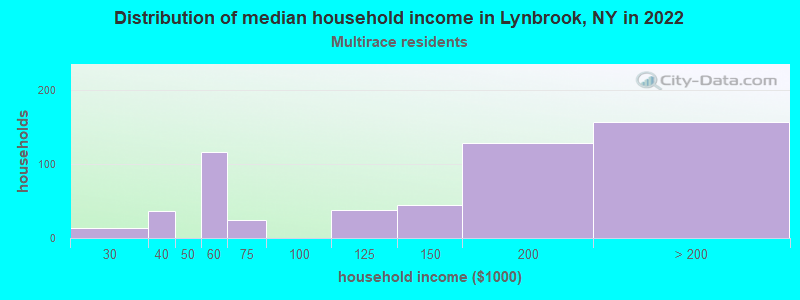
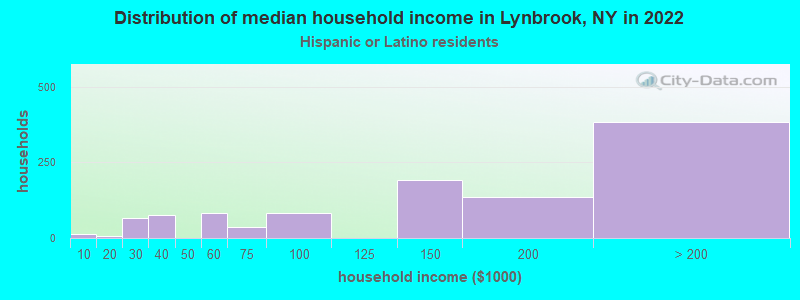
Income and house value in Lynbrook Median household income in 2022 $123,058 White non-Hispanic householders$199,414 Black householders$165,694 Asian householders$83,143 Some other race householders$160,113 Two or more races householders$155,847 Hispanic or Latino race householdersMedian 2022 house value $615,721 White Non-Hispanic householders$552,216 Black or African American householders$621,243 American Indian or Alaska Native householders $592,804 Asian householders$694,136 Some other race householders$644,160 Two or more races householders$614,893 Hispanic or Latino householders
Median age by race in Lynbrook
49.8 Median age for White residents49.3 50.5 36.5 Median age for Black or African American residents37.1 37.0 30.1 Median age for American Indian / Alaska Native residents21.4 33.9 38.3 Median age for Asian residents34.6 45.9 -487,992,314.6 Median age for Native Hawaiian / Pacific Islander residents-477,502,295.2 -497,387,669.3 34.3 Median age for Other race residents37.0 27.4 34.0 Median age for Two or more races residents34.3 32.6 51.4 Median age for White alone residents50.4 52.1 36.4 Median age for Hispanic or Latino residents38.4 34.2
Owner/renter occupied households by race in Lynbrook
House owners and renters - White residents 3,793 71.3% Owner occupied1,528 28.7% Renter occupiedHouse owners and renters - Black or African American residents 257 71.2% Owner occupied104 28.8% Renter occupiedHouse owners and renters - American Indian / Alaska Native residents 41 100.0% Owner occupiedHouse owners and renters - Asian residents 357 88.4% Owner occupied47 11.6% Renter occupiedHouse owners and renters - Other race residents 193 52.7% Owner occupied173 47.3% Renter occupiedHouse owners and renters - Two or more races residents 522 100.0% Owner occupiedHouse owners and renters - White alone residents 3,677 70.1% Owner occupied1,570 29.9% Renter occupiedHouse owners and renters - Hispanic or Latino residents 877 79.3% Owner occupied229 20.7% Renter occupied
Language usage in Lynbrook
English speakers - Total 73.6% of residents of Lynbrook speak English at home.
12.9% of residents speak Spanish at home 1,890 77.0% Speak English very well563 23.0% Speak English less than very well13.1% of residents speak other language at home 1,473 59.1% Speak English very well1,021 40.9% Speak English less than very well
English speakers - Born in the United States 83.9% of residents of Lynbrook speak English at home.
10.1% of residents speak Spanish at home 106 100.0% Speak English very well7.5% of residents speak other language at home 73 92.4% Speak English very well6 7.6% Speak English less than very well
English speakers - Native, born elsewhere 49.4% of residents of Lynbrook speak English at home.
41.5% of residents speak Spanish at home 233 95.9% Speak English very well10 4.1% Speak English less than very well5.0% of residents speak other language at home 29 100.0% Speak English very well
English speakers - Foreign-born 19.5% of residents of Lynbrook speak English at home.
27.2% of residents speak Spanish at home 435 44.5% Speak English very well542 55.5% Speak English less than very well52.7% of residents speak other language at home 896 47.3% Speak English very well998 52.7% Speak English less than very well
White (Caucasian) - Speak only English Native:
95.9% (10,470)Foreign-born:
47.7% (390)
White (Caucasian) - Speak another language Native:
4.7% (509)Foreign-born:
56.3% (461)
Black or African American - Speak only English Native:
88.1% (846)Foreign-born:
41.1% (103)
Black or African American - Speak another language Native:
12.1% (116)Foreign-born:
59.4% (148)
American Indian / Alaska Native - Speak another language Native:
36.6% (52)Foreign-born:
100.0% (30)
Asian - Speak only English Native:
60.9% (310)Foreign-born:
7.8% (107)
Asian - Speak another language Native:
39.8% (203)Foreign-born:
93.3% (1,279)
Other race - Speak only English Native:
34.7% (248)Foreign-born:
3.7% (24)
Other race - Speak another language Native:
64.5% (461)Foreign-born:
97.4% (643)
Two or more races - Speak only English Native:
59.0% (1,421)Foreign-born:
14.7% (72)
Two or more races - Speak another language Native:
42.7% (1,027)Foreign-born:
85.8% (422)
White alone - Speak only English Native:
96.6% (9,822)Foreign-born:
42.7% (400)
White alone - Speak another language Native:
3.5% (360)Foreign-born:
56.9% (533)
Hispanic or Latino - Speak only English Native:
58.7% (1,978)Foreign-born:
4.2% (44)
Hispanic or Latino - Speak another language Native:
41.0% (1,383)Foreign-born:
95.8% (994)
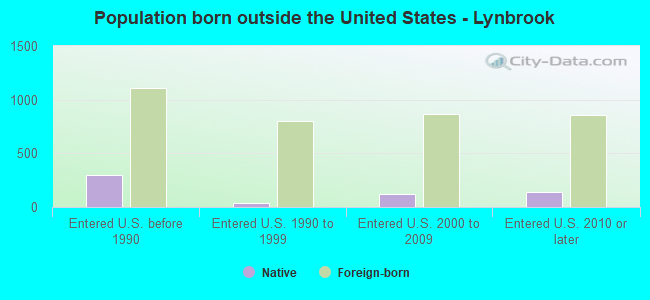
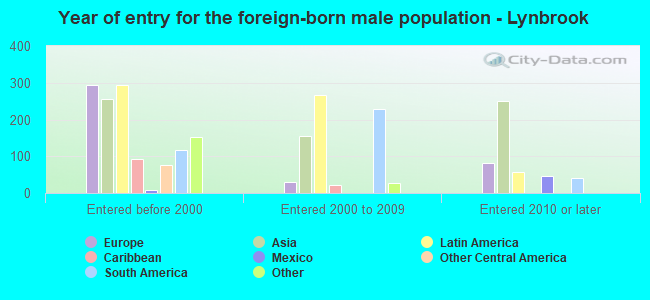
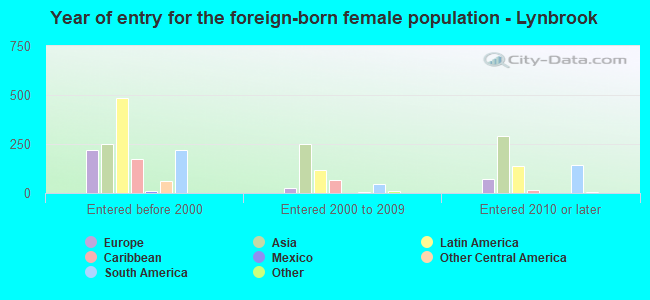
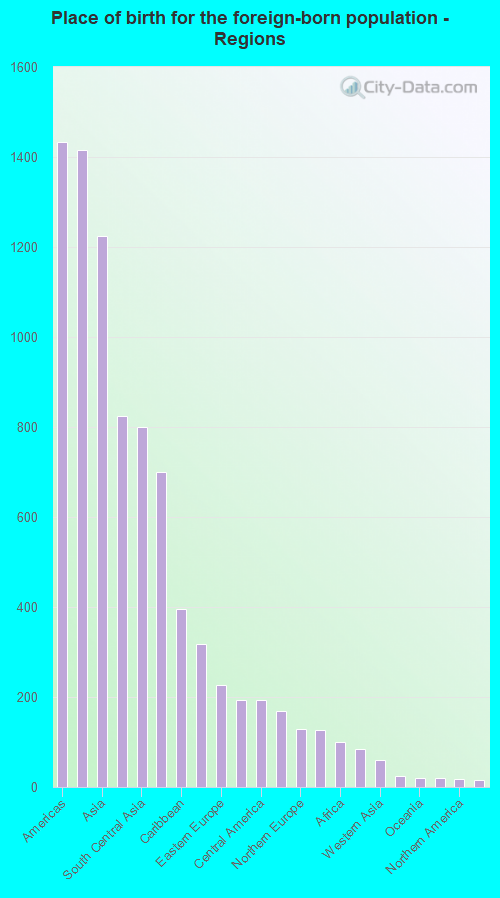
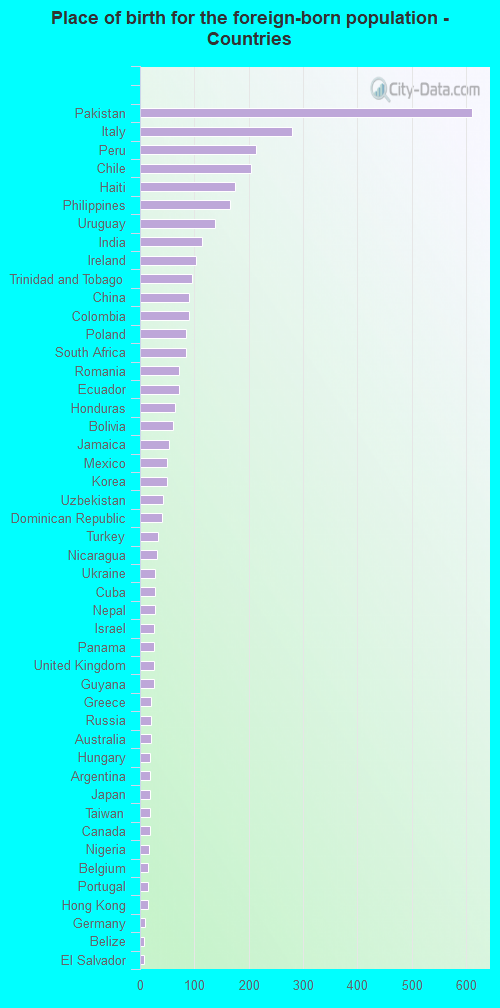
Foreign-born residents in Lynbrook 3,479 residents are foreign born (7.0% Latin America , 6.1% Asia , 3.5% Europe ).
This city:
17.2%New York:
22.6%
Marital status for residents in Lynbrook Marital status - White (Caucasian) population 15 years and over
Males 27.2% Never married60.7% Now married1.1% Separated2.4% Widowed8.7% DivorcedFemales 25.0% Never married51.2% Now married1.7% Separated13.1% Widowed8.9% DivorcedWomen who gave birth in the past 12 months Now married:
95.2% (246)Unmarried:
4.8% (13)
Women who did not give birth in the past 12 months Now married:
45.9% (946)Unmarried:
54.1% (1,114)
Marital status - Black or African American population 15 years and over
Males 38.1% Never married57.6% Now married0.0% Separated4.3% Widowed0.0% DivorcedFemales 40.1% Never married40.3% Now married5.6% Separated11.6% Widowed2.4% DivorcedWomen who did not give birth in the past 12 months Now married:
43.9% (152)Unmarried:
56.1% (194)
Marital status - American Indian / Alaska Native population 15 years and over
Males 65.9% Never married34.1% Now married0.0% Separated0.0% Widowed0.0% DivorcedFemales 36.9% Never married63.1% Now married0.0% Separated0.0% Widowed0.0% DivorcedWomen who did not give birth in the past 12 months Now married:
38.5% (21)Unmarried:
61.5% (34)
Marital status - Asian population 15 years and over
Males 34.8% Never married65.2% Now married0.0% Separated0.0% Widowed0.0% DivorcedFemales 22.4% Never married64.9% Now married0.0% Separated7.0% Widowed5.7% DivorcedWomen who gave birth in the past 12 months Now married:
100.0% (33)Unmarried:
0.0% (0)
Women who did not give birth in the past 12 months Now married:
55.8% (285)Unmarried:
44.2% (226)
Marital status - Other race population 15 years and over
Males 35.3% Never married47.0% Now married7.7% Separated0.0% Widowed10.0% DivorcedFemales 40.3% Never married51.2% Now married0.0% Separated0.0% Widowed8.5% DivorcedWomen who gave birth in the past 12 months Now married:
100.0% (8)Unmarried:
0.0% (0)
Women who did not give birth in the past 12 months Now married:
48.3% (189)Unmarried:
51.7% (202)
Marital status - Two or more races population 15 years and over
Males 35.9% Never married60.6% Now married0.0% Separated0.0% Widowed3.5% DivorcedFemales 39.3% Never married38.7% Now married0.8% Separated9.0% Widowed12.2% DivorcedWomen who gave birth in the past 12 months Now married:
100.0% (29)Unmarried:
0.0% (0)
Women who did not give birth in the past 12 months Now married:
30.1% (246)Unmarried:
69.9% (571)
Marital status - White alone, not Hispanic / Latino population 15 years and over
Males 25.8% Never married61.5% Now married1.2% Separated2.3% Widowed9.2% DivorcedFemales 24.6% Never married50.7% Now married1.6% Separated13.9% Widowed9.2% DivorcedWomen who gave birth in the past 12 months Now married:
95.2% (262)Unmarried:
4.8% (13)
Women who did not give birth in the past 12 months Now married:
46.1% (863)Unmarried:
53.9% (1,011)
Marital status - Hispanic or Latino population 15 years and over
Males 35.1% Never married56.8% Now married2.1% Separated0.9% Widowed5.1% DivorcedFemales 35.8% Never married49.0% Now married1.2% Separated5.1% Widowed8.9% DivorcedWomen who gave birth in the past 12 months Now married:
100.0% (26)Unmarried:
0.0% (0)
Women who did not give birth in the past 12 months Now married:
41.9% (534)Unmarried:
58.1% (739)
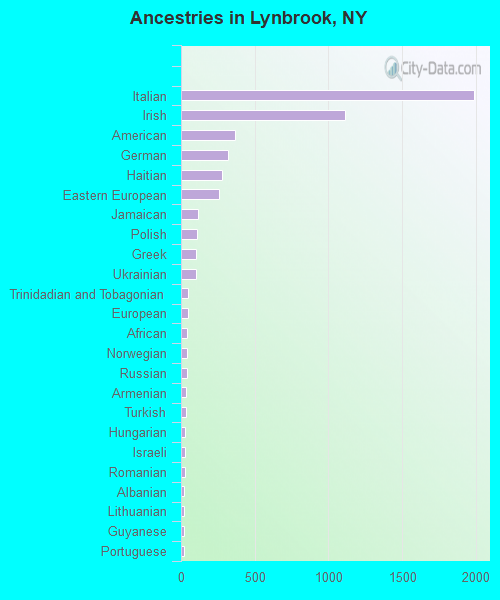
Ancestries in Lynbrook
1,990 21.5% Italian1,112 12.0% Irish364 3.9% American316 3.4% German277 3.0% Haitian261 2.8% Eastern European116 1.3% Jamaican110 1.2% Polish103 1.1% Greek99 1.1% Ukrainian50 0.5% Trinidadian and Tobagonian46 0.5% European44 0.5% African39 0.4% Norwegian38 0.4% Russian34 0.4% Armenian34 0.4% Turkish29 0.3% Hungarian28 0.3% Israeli26 0.3% Romanian21 0.2% Albanian20 0.2% Lithuanian19 0.2% Guyanese19 0.2% Portuguese13 0.1% Finnish9 0.10% Belizean7 0.08% Austrian5 0.05% British5 0.05% Czech
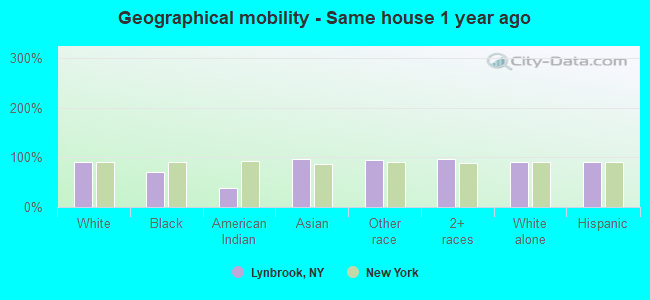
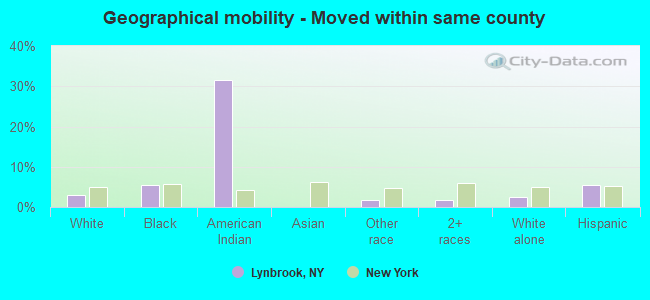
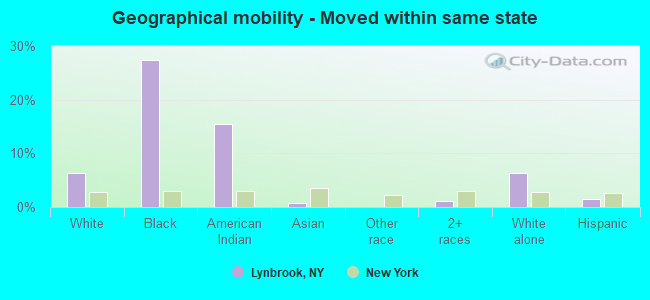
Geographical mobility in Lynbrook Same house 1 year ago 10,934 90.1% White (Caucasian)951 70.5% Black or African American83 37.3% American Indian / Alaska Native1,872 96.6% Asian1,353 93.9% Other race2,861 96.5% Two or more races10,443 90.4% White alone, not Hispanic / Latino4,168 91.5% Hispanic or LatinoMoved within same county 354 2.9% White / Caucasian74 5.5% Black or African American71 31.6% American Indian / Alaska Native26 1.8% Other race49 1.7% Two or more races277 2.4% White alone, not Hispanic / Latino247 5.4% Hispanic or LatinoMoved within same state 760 6.3% White / Caucasian369 27.4% Black or African American35 15.5% American Indian / Alaska Native16 0.8% Asian34 1.2% Two or more races736 6.4% White alone, not Hispanic / Latino66 1.5% Hispanic or LatinoMoved from different state 179 1.5% White / Caucasian6 0.4% Black or African American31 2.1% Other race168 1.5% White alone, not Hispanic / Latino32 0.7% Hispanic or LatinoMoved from abroad 13 0.7% Asian60 4.2% Other race48 1.0% Hispanic or Latino
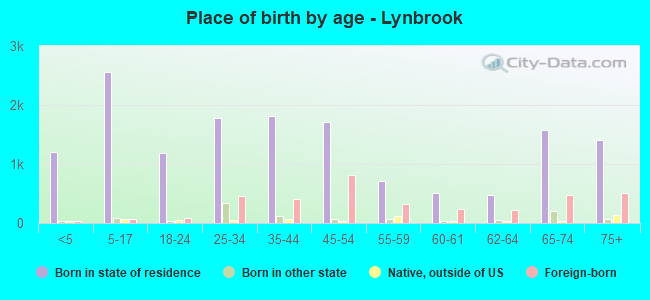
Children Nativity (place of birth) in Lynbrook
Children under 6 years - Living with two parents Both parents native 968 100.0% NativeBoth parents foreign-born 201 100.0% NativeOne native, one foreign-born parent 88 100.0% NativeChildren under 6 years - Living with one parent Native parent 137 100.0% NativeChildren 6 to 17 years - Living with two parents Both parents native 1,061 100.0% NativeBoth parents foreign-born 403 96.1% Native16 3.9% Foreign-bornOne native, one foreign-born parent 368 100.0% NativeChildren 6 to 17 years - Living with one parent Native parent 445 100.0% NativeForeign-born parent 146 47.9% Native159 52.1% Foreign-born
Grandparents responsible for own grandchildren in Lynbrook
Grandparents (30 to 59 years) Two or more races 23 100.0% Not responsible for grandchildrenHispanic or Latino 18 100.0% Not responsible for grandchildren
Grandparents (60 years and over) Two or more races 69 100.0% Not responsible for grandchildrenHispanic or Latino 65 100.0% Not responsible for grandchildren