Races in Ludlow, Massachusetts (MA) Detailed Stats
Ancestries, Foreign-born residents, place of birth

Recent posts about races in Ludlow, Massachusetts on our local forum with over 2,400,000 registered users:
 | Big MA Ancestry Data Thread by Town (31 replies) |
| Coronavirus in Massachusetts (18048 replies) |
| Are there signs of people leaving Boston for cheaper parts of the state yet? (233 replies) |
| Favorite local breweries and craft beers (171 replies) |
| Old school small New. England cities with a working class, european vibe (23 replies) |
| Cambridge Carnival cancelled Citing Gun Violence in Boston (25 replies) |
Latest news about races in Ludlow, MA collected exclusively by city-data.com from local newspapers, TV, and radio stations
14.7% of Ludlow, MA residents are foreign-born (12.9% born in Europe), which is 22.5% less than the foreign-born rate of 18.0% across the entire state of Massachusetts.
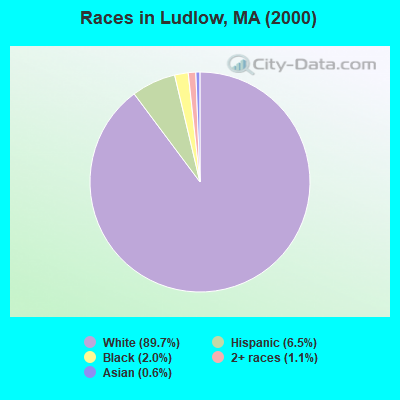
Race distribution in Ludlow

- 19,02889.7%White alone
- 1,3726.5%Hispanic
- 4232.0%Black alone
- 2361.1%Two or more races
- 1250.6%Asian alone
- 160.08%American Indian alone
- 70.03%Other race alone
- 20.01%Native Hawaiian and Other
Pacific Islander alone
2000
2022
-
- 5,198,35981.9%White alone
- 428,7296.8%Hispanic
- 318,3295.0%Black alone
- 236,7863.7%Asian alone
- 110,3381.7%Two or more races
- 43,5860.7%Other race alone
- 11,2640.2%American Indian alone
- 1,7060.03%Native Hawaiian and Other
Pacific Islander alone

-
- 4,676,62767.0%White alone
- 911,03813.0%Hispanic
- 501,4637.2%Asian alone
- 459,7406.6%Black alone
- 341,8894.9%Two or more races
- 84,4031.2%Other race alone
- 5,8380.08%American Indian alone
- 9760.01%Native Hawaiian and Other
Pacific Islander alone

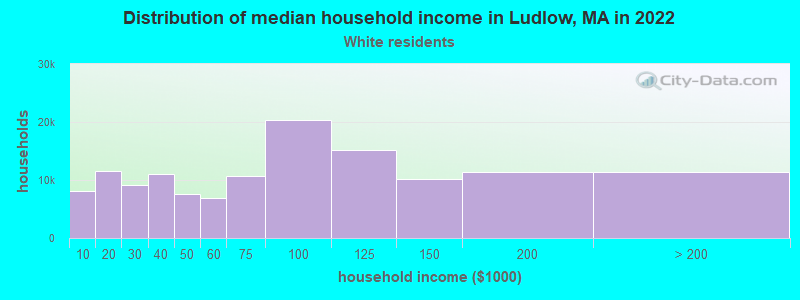
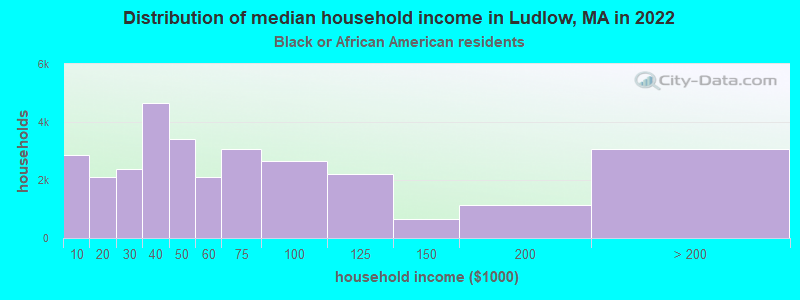
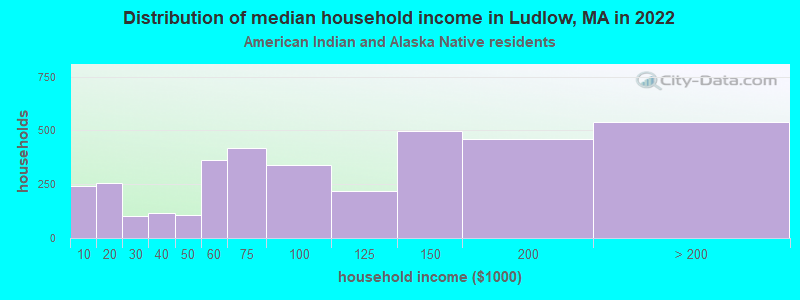
Income and house value in Ludlow
- Median household income in 2022
- $82,228White non-Hispanic householders
- $97,245Black householders
- $44,569American Indian and Alaska Native householders
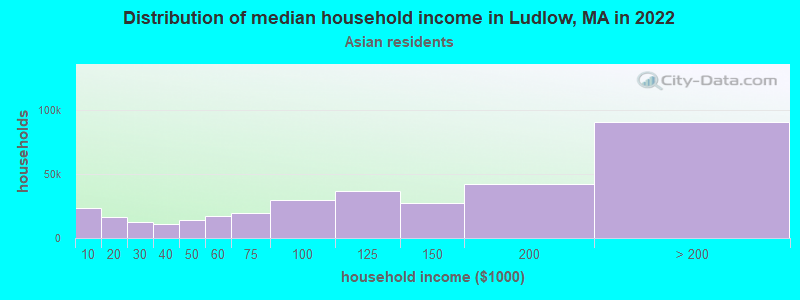
- $133,837Asian householders
- $170,143Some other race householders
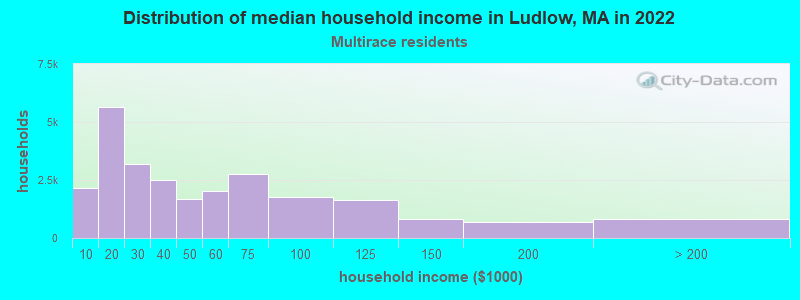
- $35,882Two or more races householders
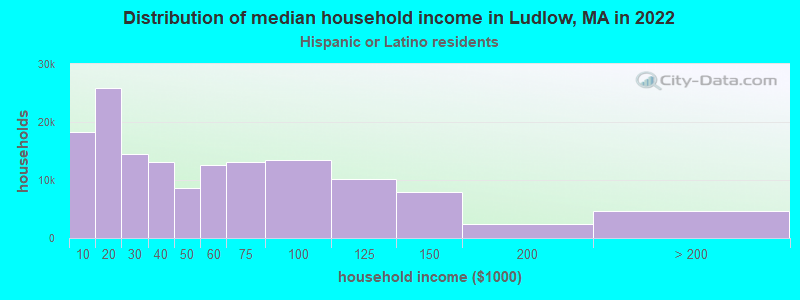
- $136,375Hispanic or Latino race householders
- Median 2022 house value
- $316,090White Non-Hispanic householders
- $327,255Black or African American householders
- $235,703American Indian or Alaska Native householders
- $247,364Asian householders
- $235,703Some other race householders
- $319,564Two or more races householders
- $296,738Hispanic or Latino householders
Household income for White non-Hispanic householders
Household income for Black householders
Household income for American Indian and Alaska Native householders
Household income for Asian householders
Household income for Two or more races householders
Household income for Hispanic or Latino race householders
Foreign-born residents in Ludlow
3,116 residents are foreign born (12.9% Europe).
| This city: | 14.7% |
| Massachusetts: | 12.2% |
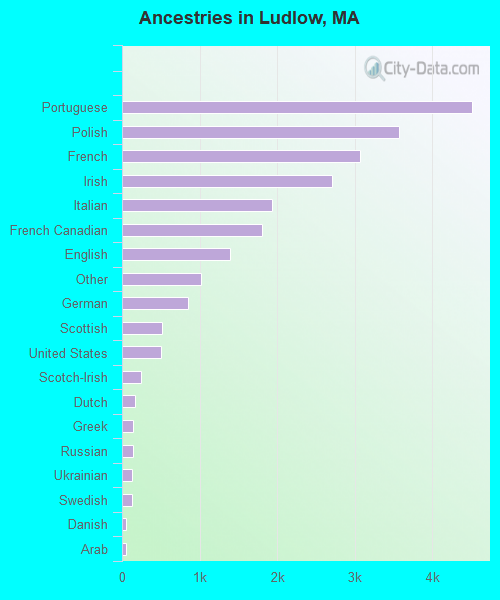
Ancestries in Ludlow

- 4,50619.5%Portuguese
- 3,57215.5%Polish
- 3,06813.3%French
- 2,70111.7%Irish
- 1,9398.4%Italian
- 1,7997.8%French Canadian
- 1,3966.0%English
- 1,0194.4%Other
- 8493.7%German
- 5152.2%Scottish
- 5002.2%United States
- 2401.0%Scotch-Irish
- 1710.7%Dutch
- 1400.6%Greek
- 1400.6%Russian
- 1350.6%Ukrainian
- 1290.6%Swedish
- 520.2%Danish
- 460.2%Arab
- 360.2%Lithuanian
- 330.1%Czech
- 250.1%West Indian
- 220.10%Norwegian
- 220.10%Slovak
- 130.06%Swiss
- 90.04%Subsaharan African
- 60.03%Hungarian
- 60.03%Welsh
Zip codes: 01056.