Races in Loxahatchee Groves, Florida (FL) Detailed Stats
Data:
Races - White alone (%)
Races - White alone (% change since 2000)
Races - Black alone (%)
Races - Black alone (% change since 2000)
Races - American Indian alone (%)
Races - American Indian alone (% change since 2000)
Races - Asian alone (%)
Races - Asian alone (% change since 2000)
Races - Hispanic (%)
Races - Hispanic (% change since 2000)
Races - Native Hawaiian and Other Pacific Islander alone (%)
Races - Native Hawaiian and Other Pacific Islander alone (% change since 2000)
Races - Two or more races(%)
Races - Two or more races(% change since 2000)
Races - Other race alone (%)
Races - Other race alone (% change since 2000)
Racial diversity
Place of birth - Born in state of residence (%)
Place of birth - Born in state of residence (%) - White
Place of birth - Born in state of residence (%) - Black or African American
Place of birth - Born in state of residence (%) - Asian
Place of birth - Born in state of residence (%) - Hispanic or Latino
Place of birth - Born in state of residence (%) - American Indian and Alaska Native
Place of birth - Born in state of residence (%) - Multirace
Place of birth - Born in state of residence (%) - Other Race
Place of birth - Born in other state (%)
Place of birth - Born in other state (%) - White
Place of birth - Born in other state (%) - Black or African American
Place of birth - Born in other state (%) - Asian
Place of birth - Born in other state (%) - Hispanic or Latino
Place of birth - Born in other state (%) - American Indian and Alaska Native
Place of birth - Born in other state (%) - Multirace
Place of birth - Born in other state (%) - Other Race
Place of birth - Native, outside of US (%)
Place of birth - Native, outside of US (%) - White
Place of birth - Native, outside of US (%) - Black or African American
Place of birth - Native, outside of US (%) - Asian
Place of birth - Native, outside of US (%) - Hispanic or Latino
Place of birth - Native, outside of US (%) - American Indian and Alaska Native
Place of birth - Native, outside of US (%) - Multirace
Place of birth - Native, outside of US (%) - Other Race
Place of birth - Foreign born (%)
Place of birth - Foreign born (%) - White
Place of birth - Foreign born (%) - Black or African American
Place of birth - Foreign born (%) - Asian
Place of birth - Foreign born (%) - Hispanic or Latino
Place of birth - Foreign born (%) - American Indian and Alaska Native
Place of birth - Foreign born (%) - Multirace
Place of birth - Foreign born (%) - Other Race
Residents speaking English at home (%)
Residents speaking English at home - Born in the United States (%)
Residents speaking English at home - Native, born elsewhere (%)
Residents speaking English at home - Foreign born (%)
Residents speaking Spanish at home (%)
Residents speaking Spanish at home - Born in the United States (%)
Residents speaking Spanish at home - Native, born elsewhere (%)
Residents speaking Spanish at home - Foreign born (%)
Residents speaking other language at home (%)
Residents speaking other language at home - Born in the United States (%)
Residents speaking other language at home - Native, born elsewhere (%)
Residents speaking other language at home - Foreign born (%)
Marital status - Never married (%)
Marital status - Now married (%)
Marital status - Separated (%)
Marital status - Widowed (%)
Marital status - Divorced (%)
Ancestries Reported - Arab (%)
Ancestries Reported - Czech (%)
Ancestries Reported - Danish (%)
Ancestries Reported - Dutch (%)
Ancestries Reported - English (%)
Ancestries Reported - French (%)
Ancestries Reported - French Canadian (%)
Ancestries Reported - German (%)
Ancestries Reported - Greek (%)
Ancestries Reported - Hungarian (%)
Ancestries Reported - Irish (%)
Ancestries Reported - Italian (%)
Ancestries Reported - Lithuanian (%)
Ancestries Reported - Norwegian (%)
Ancestries Reported - Polish (%)
Ancestries Reported - Portuguese (%)
Ancestries Reported - Russian (%)
Ancestries Reported - Scotch-Irish (%)
Ancestries Reported - Scottish (%)
Ancestries Reported - Slovak (%)
Ancestries Reported - Subsaharan African (%)
Ancestries Reported - Swedish (%)
Ancestries Reported - Swiss (%)
Ancestries Reported - Ukrainian (%)
Ancestries Reported - United States (%)
Ancestries Reported - Welsh (%)
Ancestries Reported - West Indian (%)
Ancestries Reported - Other (%)
Geographical mobility - Same house 1 year ago (%)
Geographical mobility - Same house 1 year ago (%) - White
Geographical mobility - Same house 1 year ago (%) - Black or African American
Geographical mobility - Same house 1 year ago (%) - Asian
Geographical mobility - Same house 1 year ago (%) - Hispanic or Latino
Geographical mobility - Same house 1 year ago (%) - American Indian and Alaska Native
Geographical mobility - Same house 1 year ago (%) - Multirace
Geographical mobility - Same house 1 year ago (%) - Other Race
Geographical mobility - Moved within same county (%)
Geographical mobility - Moved within same county (%) - White
Geographical mobility - Moved within same county (%) - Black or African American
Geographical mobility - Moved within same county (%) - Asian
Geographical mobility - Moved within same county (%) - Hispanic or Latino
Geographical mobility - Moved within same county (%) - American Indian and Alaska Native
Geographical mobility - Moved within same county (%) - Multirace
Geographical mobility - Moved within same county (%) - Other Race
Geographical mobility - Moved from different county within same state (%)
Geographical mobility - Moved from different county within same state (%) - White
Geographical mobility - Moved from different county within same state (%) - Black or African American
Geographical mobility - Moved from different county within same state (%) - Asian
Geographical mobility - Moved from different county within same state (%) - Hispanic or Latino
Geographical mobility - Moved from different county within same state (%) - American Indian and Alaska Native
Geographical mobility - Moved from different county within same state (%) - Multirace
Geographical mobility - Moved from different county within same state (%) - Other Race
Geographical mobility - Moved from different state (%)
Geographical mobility - Moved from different state (%) - White
Geographical mobility - Moved from different state (%) - Black or African American
Geographical mobility - Moved from different state (%) - Asian
Geographical mobility - Moved from different state (%) - Hispanic or Latino
Geographical mobility - Moved from different state (%) - American Indian and Alaska Native
Geographical mobility - Moved from different state (%) - Multirace
Geographical mobility - Moved from different state (%) - Other Race
Geographical mobility - Moved from abroad (%)
Geographical mobility - Moved from abroad (%) - White
Geographical mobility - Moved from abroad (%) - Black or African American
Geographical mobility - Moved from abroad (%) - Asian
Geographical mobility - Moved from abroad (%) - Hispanic or Latino
Geographical mobility - Moved from abroad (%) - American Indian and Alaska Native
Geographical mobility - Moved from abroad (%) - Multirace
Geographical mobility - Moved from abroad (%) - Other Race
Place of birth for the foreign-born population - Ireland (%)
Place of birth for the foreign-born population - Denmark (%)
Place of birth for the foreign-born population - Norway (%)
Place of birth for the foreign-born population - Sweden (%)
Place of birth for the foreign-born population - United Kingdom (%)
Place of birth for the foreign-born population - England (%)
Place of birth for the foreign-born population - Scotland (%)
Place of birth for the foreign-born population - Other Northern Europe (%)
Place of birth for the foreign-born population - Austria (%)
Place of birth for the foreign-born population - Belgium (%)
Place of birth for the foreign-born population - France (%)
Place of birth for the foreign-born population - Germany (%)
Place of birth for the foreign-born population - Netherlands (%)
Place of birth for the foreign-born population - Switzerland (%)
Place of birth for the foreign-born population - Other Western Europe (%)
Place of birth for the foreign-born population - Greece (%)
Place of birth for the foreign-born population - Italy (%)
Place of birth for the foreign-born population - Portugal (%)
Place of birth for the foreign-born population - Spain (%)
Place of birth for the foreign-born population - Other Southern Europe (%)
Place of birth for the foreign-born population - Albania (%)
Place of birth for the foreign-born population - Belarus (%)
Place of birth for the foreign-born population - Bosnia and Herzegovina (%)
Place of birth for the foreign-born population - Bulgaria (%)
Place of birth for the foreign-born population - Croatia (%)
Place of birth for the foreign-born population - Czechoslovakia (%)
Place of birth for the foreign-born population - Hungary (%)
Place of birth for the foreign-born population - Latvia (%)
Place of birth for the foreign-born population - Lithuania (%)
Place of birth for the foreign-born population - North Macedonia (Macedonia) (%)
Place of birth for the foreign-born population - Moldova (%)
Place of birth for the foreign-born population - Poland (%)
Place of birth for the foreign-born population - Romania (%)
Place of birth for the foreign-born population - Russia (%)
Place of birth for the foreign-born population - Serbia (%)
Place of birth for the foreign-born population - Ukraine (%)
Place of birth for the foreign-born population - Other Eastern Europe (%)
Place of birth for the foreign-born population - China (%)
Place of birth for the foreign-born population - Hong Kong (%)
Place of birth for the foreign-born population - Taiwan (%)
Place of birth for the foreign-born population - Japan (%)
Place of birth for the foreign-born population - Korea (%)
Place of birth for the foreign-born population - Other Eastern Asia (%)
Place of birth for the foreign-born population - Afghanistan (%)
Place of birth for the foreign-born population - Bangladesh (%)
Place of birth for the foreign-born population - India (%)
Place of birth for the foreign-born population - Iran (%)
Place of birth for the foreign-born population - Kazakhstan (%)
Place of birth for the foreign-born population - Nepal (%)
Place of birth for the foreign-born population - Pakistan (%)
Place of birth for the foreign-born population - Sri Lanka (%)
Place of birth for the foreign-born population - Uzbekistan (%)
Place of birth for the foreign-born population - Other South Central Asia (%)
Place of birth for the foreign-born population - Burma (%)
Place of birth for the foreign-born population - Cambodia (%)
Place of birth for the foreign-born population - Indonesia (%)
Place of birth for the foreign-born population - Laos (%)
Place of birth for the foreign-born population - Malaysia (%)
Place of birth for the foreign-born population - Philippines (%)
Place of birth for the foreign-born population - Singapore (%)
Place of birth for the foreign-born population - Thailand (%)
Place of birth for the foreign-born population - Vietnam (%)
Place of birth for the foreign-born population - Other South Eastern Asia (%)
Place of birth for the foreign-born population - Armenia (%)
Place of birth for the foreign-born population - Iraq (%)
Place of birth for the foreign-born population - Israel (%)
Place of birth for the foreign-born population - Jordan (%)
Place of birth for the foreign-born population - Kuwait (%)
Place of birth for the foreign-born population - Lebanon (%)
Place of birth for the foreign-born population - Saudi Arabia (%)
Place of birth for the foreign-born population - Syria (%)
Place of birth for the foreign-born population - Turkey (%)
Place of birth for the foreign-born population - Yemen (%)
Place of birth for the foreign-born population - Other Western Asia (%)
Place of birth for the foreign-born population - Eritrea (%)
Place of birth for the foreign-born population - Ethiopia (%)
Place of birth for the foreign-born population - Kenya (%)
Place of birth for the foreign-born population - Somalia (%)
Place of birth for the foreign-born population - Uganda (%)
Place of birth for the foreign-born population - Zimbabwe (%)
Place of birth for the foreign-born population - Other Eastern Africa (%)
Place of birth for the foreign-born population - Cameroon (%)
Place of birth for the foreign-born population - Congo (%)
Place of birth for the foreign-born population - Democratic Republic of Congo (Zaire) (%)
Place of birth for the foreign-born population - Other Middle Africa (%)
Place of birth for the foreign-born population - Egypt (%)
Place of birth for the foreign-born population - Morocco (%)
Place of birth for the foreign-born population - Sudan (%)
Place of birth for the foreign-born population - Other Northern Africa (%)
Place of birth for the foreign-born population - South Africa (%)
Place of birth for the foreign-born population - Other Southern Africa (%)
Place of birth for the foreign-born population - Cabo Verde (%)
Place of birth for the foreign-born population - Ghana (%)
Place of birth for the foreign-born population - Liberia (%)
Place of birth for the foreign-born population - Nigeria (%)
Place of birth for the foreign-born population - Senegal (%)
Place of birth for the foreign-born population - Sierra Leone (%)
Place of birth for the foreign-born population - Other Western Africa (%)
Place of birth for the foreign-born population - Australia (%)
Place of birth for the foreign-born population - New Zealand (%)
Place of birth for the foreign-born population - Fiji (%)
Place of birth for the foreign-born population - Micronesia (%)
Place of birth for the foreign-born population - Bahamas (%)
Place of birth for the foreign-born population - Barbados (%)
Place of birth for the foreign-born population - Cuba (%)
Place of birth for the foreign-born population - Dominica (%)
Place of birth for the foreign-born population - Dominican Republic (%)
Place of birth for the foreign-born population - Grenada (%)
Place of birth for the foreign-born population - Haiti (%)
Place of birth for the foreign-born population - Jamaica (%)
Place of birth for the foreign-born population - St. Vincent and the Grenadines (%)
Place of birth for the foreign-born population - Trinidad and Tobago (%)
Place of birth for the foreign-born population - West Indies (%)
Place of birth for the foreign-born population - Other Caribbean (%)
Place of birth for the foreign-born population - Belize (%)
Place of birth for the foreign-born population - Costa Rica (%)
Place of birth for the foreign-born population - El Salvador (%)
Place of birth for the foreign-born population - Guatemala (%)
Place of birth for the foreign-born population - Honduras (%)
Place of birth for the foreign-born population - Mexico (%)
Place of birth for the foreign-born population - Nicaragua (%)
Place of birth for the foreign-born population - Panama (%)
Place of birth for the foreign-born population - Other Central America (%)
Place of birth for the foreign-born population - Argentina (%)
Place of birth for the foreign-born population - Bolivia (%)
Place of birth for the foreign-born population - Brazil (%)
Place of birth for the foreign-born population - Chile (%)
Place of birth for the foreign-born population - Colombia (%)
Place of birth for the foreign-born population - Ecuador (%)
Place of birth for the foreign-born population - Guyana (%)
Place of birth for the foreign-born population - Peru (%)
Place of birth for the foreign-born population - Uruguay (%)
Place of birth for the foreign-born population - Venezuela (%)
Place of birth for the foreign-born population - Other South America (%)
Place of birth for the foreign-born population - Canada (%)
Place of birth for the foreign-born population - Other Northern America (%)
Place of birth for the foreign-born population - Other (%)
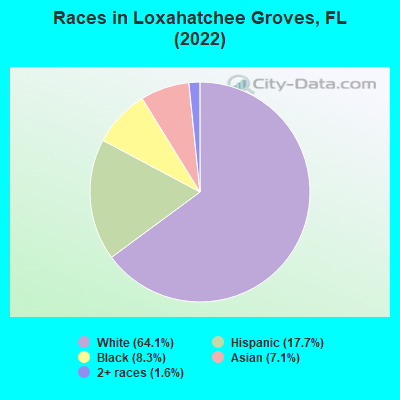
According to 2022 data, the most numerous races in Loxahatchee Groves, FL are White alone (2,203 residents), Hispanic (610 residents), and Black alone (285 residents). 84.7% of Loxahatchee Groves residents speak English at home.
Race distribution in Loxahatchee Groves 2,203 64.1% White alone 610 17.7% Hispanic 285 8.3% Black alone 243 7.1% Asian alone 56 1.6% Two or more races
2000 2022
10,458,509 65.4% White alone 2,682,715 16.8% Hispanic 2,264,268 14.2% Black alone 261,693 1.6% Asian alone 236,954 1.5% Two or more races 42,358 0.3% American Indian alone 28,994 0.2% Other race alone 6,887 0.04% Native Hawaiian and Other
11,309,403 50.8% White alone 6,025,039 27.1% Hispanic 3,241,015 14.6% Black alone 861,630 3.9% Two or more races 623,692 2.8% Asian alone 152,054 0.7% Other race alone 22,504 0.1% American Indian alone 9,486 0.04% Native Hawaiian and Other
Income and house value in Loxahatchee Groves Median household income in 2022 $125,349 White non-Hispanic householders$149,937 Black householders$93,305 Asian householders$115,849 Two or more races householders$116,269 Hispanic or Latino race householders
Median age by race in Loxahatchee Groves
61.5 Median age for White residents62.2 61.0 35.3 Median age for Black or African American residents42.2 35.0 16.0 Median age for American Indian / Alaska Native residents-806,112,702.2 -660,098,521.5 38.4 Median age for Asian residents41.1 37.7 -674,285,713.6 Median age for Native Hawaiian / Pacific Islander residents-674,264,006.9 -672,397,325.0 40.6 Median age for Other race residents49.0 8.7 31.5 Median age for Two or more races residents30.0 37.0 60.0 Median age for White alone residents61.3 59.7 33.4 Median age for Hispanic or Latino residents39.3 20.5
Owner/renter occupied households by race in Loxahatchee Groves
House owners and renters - White residents 907 90.7% Owner occupied93 9.3% Renter occupiedHouse owners and renters - Black or African American residents 75 100.0% Owner occupiedHouse owners and renters - Asian residents 80 100.0% Owner occupiedHouse owners and renters - Other race residents 5 100.0% Owner occupiedHouse owners and renters - Two or more races residents 84 84.5% Owner occupied15 15.5% Renter occupiedHouse owners and renters - White alone residents 882 91.0% Owner occupied87 9.0% Renter occupiedHouse owners and renters - Hispanic or Latino residents 121 78.7% Owner occupied33 21.3% Renter occupied
Language usage in Loxahatchee Groves
English speakers - Total 84.7% of residents of Loxahatchee Groves speak English at home.
8.8% of residents speak Spanish at home 127 43.1% Speak English very well168 56.9% Speak English less than very well6.1% of residents speak other language at home 186 90.7% Speak English very well19 9.3% Speak English less than very well
English speakers - Born in the United States 95.8% of residents of Loxahatchee Groves speak English at home.
2.9% of residents speak Spanish at home 16 38.1% Speak English very well26 61.9% Speak English less than very well1.8% of residents speak other language at home 26 100.0% Speak English very well
All residents speak only English at home
English speakers - Foreign-born 56.4% of residents of Loxahatchee Groves speak English at home.
23.7% of residents speak Spanish at home 41 24.6% Speak English very well126 75.4% Speak English less than very well17.9% of residents speak other language at home 117 92.9% Speak English very well9 7.1% Speak English less than very well
White (Caucasian) - Speak only English Native:
97.2% (1,980)Foreign-born:
100.0% (192)
White (Caucasian) - Speak another language Native:
4.2% (85)Foreign-born:
24.5% (47)
Black or African American - Speak only English Native:
90.9% (183)Foreign-born:
56.3% (28)
Black or African American - Speak another language Native:
8.7% (17)Foreign-born:
41.6% (21)
American Indian / Alaska Native - Speak another language Native:
55.2% (21)Foreign-born:
100.0% (20)
Asian - Speak only English Native:
100.0% (76)Foreign-born:
73.9% (123)
Other race - Speak another language Native:
61.7% (39)Foreign-born:
100.0% (25)
Two or more races - Speak only English Native:
89.6% (146)Foreign-born:
12.8% (21)
Two or more races - Speak another language Native:
7.1% (12)Foreign-born:
85.9% (144)
White alone - Speak only English Native:
96.5% (1,897)Foreign-born:
78.8% (156)
White alone - Speak another language Native:
3.6% (71)Foreign-born:
25.7% (51)
Hispanic or Latino - Speak only English Native:
68.4% (234)Foreign-born:
32.6% (83)
Hispanic or Latino - Speak another language Native:
32.7% (112)Foreign-born:
66.4% (169)
Foreign-born residents in Loxahatchee Groves
Marital status for residents in Loxahatchee Groves Marital status - White (Caucasian) population 15 years and over
Males 18.0% Never married61.3% Now married0.6% Separated7.8% Widowed12.4% DivorcedFemales 18.7% Never married46.7% Now married0.7% Separated16.0% Widowed17.8% DivorcedWomen who gave birth in the past 12 months Now married:
100.0% (11)Unmarried:
0.0% (0)
Women who did not give birth in the past 12 months Now married:
42.8% (125)Unmarried:
57.2% (167)
Marital status - Black or African American population 15 years and over
Males 69.4% Never married30.6% Now married0.0% Separated0.0% Widowed0.0% DivorcedFemales 37.3% Never married47.0% Now married0.0% Separated15.7% Widowed0.0% DivorcedWomen who did not give birth in the past 12 months Now married:
41.2% (35)Unmarried:
58.8% (50)
Marital status - Asian population 15 years and over
Males 18.2% Never married81.8% Now married0.0% Separated0.0% Widowed0.0% DivorcedFemales 31.8% Never married54.1% Now married14.2% Separated0.0% Widowed0.0% DivorcedWomen who did not give birth in the past 12 months Now married:
66.9% (95)Unmarried:
33.1% (47)
Marital status - Other race population 15 years and over
Males 11.4% Never married80.0% Now married0.0% Separated0.0% Widowed8.6% DivorcedFemales 0.0% Never married100.0% Now married0.0% Separated0.0% Widowed0.0% DivorcedWomen who gave birth in the past 12 months Now married:
100.0% (3)Unmarried:
0.0% (0)
Marital status - Two or more races population 15 years and over
Males 49.5% Never married50.5% Now married0.0% Separated0.0% Widowed0.0% DivorcedFemales 54.8% Never married39.1% Now married0.0% Separated6.1% Widowed0.0% DivorcedWomen who did not give birth in the past 12 months Now married:
34.2% (35)Unmarried:
65.8% (67)
Marital status - White alone, not Hispanic / Latino population 15 years and over
Males 15.3% Never married62.3% Now married0.7% Separated8.9% Widowed12.8% DivorcedFemales 17.3% Never married47.9% Now married0.8% Separated14.7% Widowed19.3% DivorcedWomen who gave birth in the past 12 months Now married:
100.0% (13)Unmarried:
0.0% (0)
Women who did not give birth in the past 12 months Now married:
45.2% (132)Unmarried:
54.8% (160)
Marital status - Hispanic or Latino population 15 years and over
Males 39.8% Never married54.3% Now married0.0% Separated0.0% Widowed5.9% DivorcedFemales 48.0% Never married36.4% Now married0.0% Separated15.7% Widowed0.0% DivorcedWomen who gave birth in the past 12 months Now married:
100.0% (2)Unmarried:
0.0% (0)
Women who did not give birth in the past 12 months Now married:
32.8% (40)Unmarried:
67.2% (82)
Ancestries in Loxahatchee Groves
184 11.9% German162 10.5% American161 10.4% Italian103 6.7% Irish73 4.7% English42 2.7% Jamaican35 2.3% Cajun27 1.7% Scottish23 1.5% Polish20 1.3% European19 1.2% Eastern European9 0.6% Danish9 0.6% Scotch-Irish7 0.5% Croatian6 0.4% Swedish5 0.3% Czech5 0.3% Russian4 0.3% British4 0.3% Guyanese4 0.3% Welsh1 0.06% Dutch
Children Nativity (place of birth) in Loxahatchee Groves
Children under 6 years - Living with two parents Both parents native 32 100.0% NativeBoth parents foreign-born 11 100.0% NativeOne native, one foreign-born parent 9 100.0% NativeChildren under 6 years - Living with one parent Native parent 45 100.0% NativeChildren 6 to 17 years - Living with two parents Both parents native 140 100.0% NativeBoth parents foreign-born 27 100.0% NativeOne native, one foreign-born parent 61 100.0% NativeChildren 6 to 17 years - Living with one parent Native parent 45 100.0% NativeForeign-born parent 28 50.8% Native28 49.2% Foreign-born
Grandparents responsible for own grandchildren in Loxahatchee Groves
Grandparents (30 to 59 years) White / Caucasian 3 100.0% Responsible for grandchildrenWhite alone, not Hispanic / Latino 4 100.0% Responsible for grandchildren
Grandparents (60 years and over) White / Caucasian 29 100.0% Not responsible for grandchildrenWhite alone, not Hispanic / Latino 33 100.0% Not responsible for grandchildren