Races in Los Alamos, New Mexico (NM) Detailed Stats
Data:
Races - White alone (%)
Races - White alone (% change since 2000)
Races - Black alone (%)
Races - Black alone (% change since 2000)
Races - American Indian alone (%)
Races - American Indian alone (% change since 2000)
Races - Asian alone (%)
Races - Asian alone (% change since 2000)
Races - Hispanic (%)
Races - Hispanic (% change since 2000)
Races - Native Hawaiian and Other Pacific Islander alone (%)
Races - Native Hawaiian and Other Pacific Islander alone (% change since 2000)
Races - Two or more races(%)
Races - Two or more races(% change since 2000)
Races - Other race alone (%)
Races - Other race alone (% change since 2000)
Racial diversity
Place of birth - Born in state of residence (%)
Place of birth - Born in state of residence (%) - White
Place of birth - Born in state of residence (%) - Black or African American
Place of birth - Born in state of residence (%) - Asian
Place of birth - Born in state of residence (%) - Hispanic or Latino
Place of birth - Born in state of residence (%) - American Indian and Alaska Native
Place of birth - Born in state of residence (%) - Multirace
Place of birth - Born in state of residence (%) - Other Race
Place of birth - Born in other state (%)
Place of birth - Born in other state (%) - White
Place of birth - Born in other state (%) - Black or African American
Place of birth - Born in other state (%) - Asian
Place of birth - Born in other state (%) - Hispanic or Latino
Place of birth - Born in other state (%) - American Indian and Alaska Native
Place of birth - Born in other state (%) - Multirace
Place of birth - Born in other state (%) - Other Race
Place of birth - Native, outside of US (%)
Place of birth - Native, outside of US (%) - White
Place of birth - Native, outside of US (%) - Black or African American
Place of birth - Native, outside of US (%) - Asian
Place of birth - Native, outside of US (%) - Hispanic or Latino
Place of birth - Native, outside of US (%) - American Indian and Alaska Native
Place of birth - Native, outside of US (%) - Multirace
Place of birth - Native, outside of US (%) - Other Race
Place of birth - Foreign born (%)
Place of birth - Foreign born (%) - White
Place of birth - Foreign born (%) - Black or African American
Place of birth - Foreign born (%) - Asian
Place of birth - Foreign born (%) - Hispanic or Latino
Place of birth - Foreign born (%) - American Indian and Alaska Native
Place of birth - Foreign born (%) - Multirace
Place of birth - Foreign born (%) - Other Race
Residents speaking English at home (%)
Residents speaking English at home - Born in the United States (%)
Residents speaking English at home - Native, born elsewhere (%)
Residents speaking English at home - Foreign born (%)
Residents speaking Spanish at home (%)
Residents speaking Spanish at home - Born in the United States (%)
Residents speaking Spanish at home - Native, born elsewhere (%)
Residents speaking Spanish at home - Foreign born (%)
Residents speaking other language at home (%)
Residents speaking other language at home - Born in the United States (%)
Residents speaking other language at home - Native, born elsewhere (%)
Residents speaking other language at home - Foreign born (%)
Marital status - Never married (%)
Marital status - Now married (%)
Marital status - Separated (%)
Marital status - Widowed (%)
Marital status - Divorced (%)
Ancestries Reported - Arab (%)
Ancestries Reported - Czech (%)
Ancestries Reported - Danish (%)
Ancestries Reported - Dutch (%)
Ancestries Reported - English (%)
Ancestries Reported - French (%)
Ancestries Reported - French Canadian (%)
Ancestries Reported - German (%)
Ancestries Reported - Greek (%)
Ancestries Reported - Hungarian (%)
Ancestries Reported - Irish (%)
Ancestries Reported - Italian (%)
Ancestries Reported - Lithuanian (%)
Ancestries Reported - Norwegian (%)
Ancestries Reported - Polish (%)
Ancestries Reported - Portuguese (%)
Ancestries Reported - Russian (%)
Ancestries Reported - Scotch-Irish (%)
Ancestries Reported - Scottish (%)
Ancestries Reported - Slovak (%)
Ancestries Reported - Subsaharan African (%)
Ancestries Reported - Swedish (%)
Ancestries Reported - Swiss (%)
Ancestries Reported - Ukrainian (%)
Ancestries Reported - United States (%)
Ancestries Reported - Welsh (%)
Ancestries Reported - West Indian (%)
Ancestries Reported - Other (%)
Geographical mobility - Same house 1 year ago (%)
Geographical mobility - Same house 1 year ago (%) - White
Geographical mobility - Same house 1 year ago (%) - Black or African American
Geographical mobility - Same house 1 year ago (%) - Asian
Geographical mobility - Same house 1 year ago (%) - Hispanic or Latino
Geographical mobility - Same house 1 year ago (%) - American Indian and Alaska Native
Geographical mobility - Same house 1 year ago (%) - Multirace
Geographical mobility - Same house 1 year ago (%) - Other Race
Geographical mobility - Moved within same county (%)
Geographical mobility - Moved within same county (%) - White
Geographical mobility - Moved within same county (%) - Black or African American
Geographical mobility - Moved within same county (%) - Asian
Geographical mobility - Moved within same county (%) - Hispanic or Latino
Geographical mobility - Moved within same county (%) - American Indian and Alaska Native
Geographical mobility - Moved within same county (%) - Multirace
Geographical mobility - Moved within same county (%) - Other Race
Geographical mobility - Moved from different county within same state (%)
Geographical mobility - Moved from different county within same state (%) - White
Geographical mobility - Moved from different county within same state (%) - Black or African American
Geographical mobility - Moved from different county within same state (%) - Asian
Geographical mobility - Moved from different county within same state (%) - Hispanic or Latino
Geographical mobility - Moved from different county within same state (%) - American Indian and Alaska Native
Geographical mobility - Moved from different county within same state (%) - Multirace
Geographical mobility - Moved from different county within same state (%) - Other Race
Geographical mobility - Moved from different state (%)
Geographical mobility - Moved from different state (%) - White
Geographical mobility - Moved from different state (%) - Black or African American
Geographical mobility - Moved from different state (%) - Asian
Geographical mobility - Moved from different state (%) - Hispanic or Latino
Geographical mobility - Moved from different state (%) - American Indian and Alaska Native
Geographical mobility - Moved from different state (%) - Multirace
Geographical mobility - Moved from different state (%) - Other Race
Geographical mobility - Moved from abroad (%)
Geographical mobility - Moved from abroad (%) - White
Geographical mobility - Moved from abroad (%) - Black or African American
Geographical mobility - Moved from abroad (%) - Asian
Geographical mobility - Moved from abroad (%) - Hispanic or Latino
Geographical mobility - Moved from abroad (%) - American Indian and Alaska Native
Geographical mobility - Moved from abroad (%) - Multirace
Geographical mobility - Moved from abroad (%) - Other Race
Place of birth for the foreign-born population - Ireland (%)
Place of birth for the foreign-born population - Denmark (%)
Place of birth for the foreign-born population - Norway (%)
Place of birth for the foreign-born population - Sweden (%)
Place of birth for the foreign-born population - United Kingdom (%)
Place of birth for the foreign-born population - England (%)
Place of birth for the foreign-born population - Scotland (%)
Place of birth for the foreign-born population - Other Northern Europe (%)
Place of birth for the foreign-born population - Austria (%)
Place of birth for the foreign-born population - Belgium (%)
Place of birth for the foreign-born population - France (%)
Place of birth for the foreign-born population - Germany (%)
Place of birth for the foreign-born population - Netherlands (%)
Place of birth for the foreign-born population - Switzerland (%)
Place of birth for the foreign-born population - Other Western Europe (%)
Place of birth for the foreign-born population - Greece (%)
Place of birth for the foreign-born population - Italy (%)
Place of birth for the foreign-born population - Portugal (%)
Place of birth for the foreign-born population - Spain (%)
Place of birth for the foreign-born population - Other Southern Europe (%)
Place of birth for the foreign-born population - Albania (%)
Place of birth for the foreign-born population - Belarus (%)
Place of birth for the foreign-born population - Bosnia and Herzegovina (%)
Place of birth for the foreign-born population - Bulgaria (%)
Place of birth for the foreign-born population - Croatia (%)
Place of birth for the foreign-born population - Czechoslovakia (%)
Place of birth for the foreign-born population - Hungary (%)
Place of birth for the foreign-born population - Latvia (%)
Place of birth for the foreign-born population - Lithuania (%)
Place of birth for the foreign-born population - North Macedonia (Macedonia) (%)
Place of birth for the foreign-born population - Moldova (%)
Place of birth for the foreign-born population - Poland (%)
Place of birth for the foreign-born population - Romania (%)
Place of birth for the foreign-born population - Russia (%)
Place of birth for the foreign-born population - Serbia (%)
Place of birth for the foreign-born population - Ukraine (%)
Place of birth for the foreign-born population - Other Eastern Europe (%)
Place of birth for the foreign-born population - China (%)
Place of birth for the foreign-born population - Hong Kong (%)
Place of birth for the foreign-born population - Taiwan (%)
Place of birth for the foreign-born population - Japan (%)
Place of birth for the foreign-born population - Korea (%)
Place of birth for the foreign-born population - Other Eastern Asia (%)
Place of birth for the foreign-born population - Afghanistan (%)
Place of birth for the foreign-born population - Bangladesh (%)
Place of birth for the foreign-born population - India (%)
Place of birth for the foreign-born population - Iran (%)
Place of birth for the foreign-born population - Kazakhstan (%)
Place of birth for the foreign-born population - Nepal (%)
Place of birth for the foreign-born population - Pakistan (%)
Place of birth for the foreign-born population - Sri Lanka (%)
Place of birth for the foreign-born population - Uzbekistan (%)
Place of birth for the foreign-born population - Other South Central Asia (%)
Place of birth for the foreign-born population - Burma (%)
Place of birth for the foreign-born population - Cambodia (%)
Place of birth for the foreign-born population - Indonesia (%)
Place of birth for the foreign-born population - Laos (%)
Place of birth for the foreign-born population - Malaysia (%)
Place of birth for the foreign-born population - Philippines (%)
Place of birth for the foreign-born population - Singapore (%)
Place of birth for the foreign-born population - Thailand (%)
Place of birth for the foreign-born population - Vietnam (%)
Place of birth for the foreign-born population - Other South Eastern Asia (%)
Place of birth for the foreign-born population - Armenia (%)
Place of birth for the foreign-born population - Iraq (%)
Place of birth for the foreign-born population - Israel (%)
Place of birth for the foreign-born population - Jordan (%)
Place of birth for the foreign-born population - Kuwait (%)
Place of birth for the foreign-born population - Lebanon (%)
Place of birth for the foreign-born population - Saudi Arabia (%)
Place of birth for the foreign-born population - Syria (%)
Place of birth for the foreign-born population - Turkey (%)
Place of birth for the foreign-born population - Yemen (%)
Place of birth for the foreign-born population - Other Western Asia (%)
Place of birth for the foreign-born population - Eritrea (%)
Place of birth for the foreign-born population - Ethiopia (%)
Place of birth for the foreign-born population - Kenya (%)
Place of birth for the foreign-born population - Somalia (%)
Place of birth for the foreign-born population - Uganda (%)
Place of birth for the foreign-born population - Zimbabwe (%)
Place of birth for the foreign-born population - Other Eastern Africa (%)
Place of birth for the foreign-born population - Cameroon (%)
Place of birth for the foreign-born population - Congo (%)
Place of birth for the foreign-born population - Democratic Republic of Congo (Zaire) (%)
Place of birth for the foreign-born population - Other Middle Africa (%)
Place of birth for the foreign-born population - Egypt (%)
Place of birth for the foreign-born population - Morocco (%)
Place of birth for the foreign-born population - Sudan (%)
Place of birth for the foreign-born population - Other Northern Africa (%)
Place of birth for the foreign-born population - South Africa (%)
Place of birth for the foreign-born population - Other Southern Africa (%)
Place of birth for the foreign-born population - Cabo Verde (%)
Place of birth for the foreign-born population - Ghana (%)
Place of birth for the foreign-born population - Liberia (%)
Place of birth for the foreign-born population - Nigeria (%)
Place of birth for the foreign-born population - Senegal (%)
Place of birth for the foreign-born population - Sierra Leone (%)
Place of birth for the foreign-born population - Other Western Africa (%)
Place of birth for the foreign-born population - Australia (%)
Place of birth for the foreign-born population - New Zealand (%)
Place of birth for the foreign-born population - Fiji (%)
Place of birth for the foreign-born population - Micronesia (%)
Place of birth for the foreign-born population - Bahamas (%)
Place of birth for the foreign-born population - Barbados (%)
Place of birth for the foreign-born population - Cuba (%)
Place of birth for the foreign-born population - Dominica (%)
Place of birth for the foreign-born population - Dominican Republic (%)
Place of birth for the foreign-born population - Grenada (%)
Place of birth for the foreign-born population - Haiti (%)
Place of birth for the foreign-born population - Jamaica (%)
Place of birth for the foreign-born population - St. Vincent and the Grenadines (%)
Place of birth for the foreign-born population - Trinidad and Tobago (%)
Place of birth for the foreign-born population - West Indies (%)
Place of birth for the foreign-born population - Other Caribbean (%)
Place of birth for the foreign-born population - Belize (%)
Place of birth for the foreign-born population - Costa Rica (%)
Place of birth for the foreign-born population - El Salvador (%)
Place of birth for the foreign-born population - Guatemala (%)
Place of birth for the foreign-born population - Honduras (%)
Place of birth for the foreign-born population - Mexico (%)
Place of birth for the foreign-born population - Nicaragua (%)
Place of birth for the foreign-born population - Panama (%)
Place of birth for the foreign-born population - Other Central America (%)
Place of birth for the foreign-born population - Argentina (%)
Place of birth for the foreign-born population - Bolivia (%)
Place of birth for the foreign-born population - Brazil (%)
Place of birth for the foreign-born population - Chile (%)
Place of birth for the foreign-born population - Colombia (%)
Place of birth for the foreign-born population - Ecuador (%)
Place of birth for the foreign-born population - Guyana (%)
Place of birth for the foreign-born population - Peru (%)
Place of birth for the foreign-born population - Uruguay (%)
Place of birth for the foreign-born population - Venezuela (%)
Place of birth for the foreign-born population - Other South America (%)
Place of birth for the foreign-born population - Canada (%)
Place of birth for the foreign-born population - Other Northern America (%)
Place of birth for the foreign-born population - Other (%)
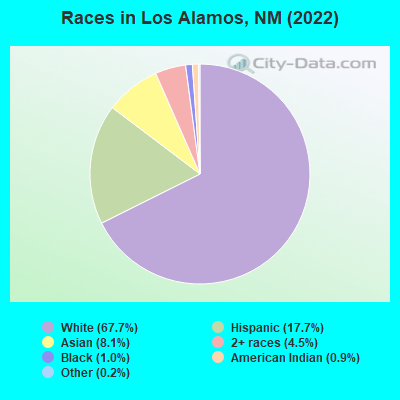
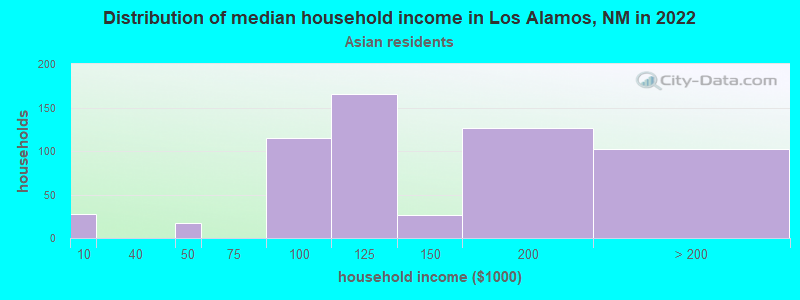
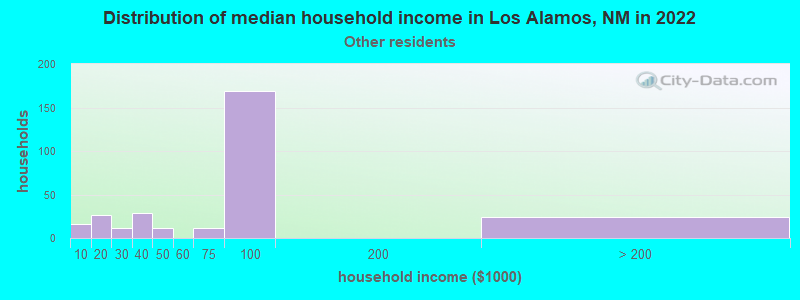
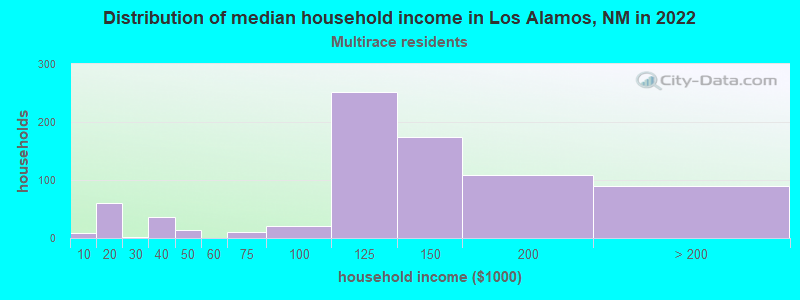
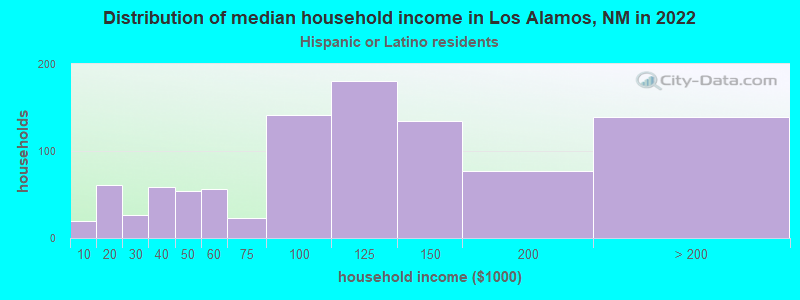
According to 2022 data, the most numerous races in Los Alamos, NM are Hispanic (2,389 residents), White alone (9,122 residents), and American Indian alone (127 residents). 84.4% of Los Alamos residents speak English at home. 11.7% of Los Alamos, NM residents are foreign-born (6.3% born in Asia, 2.7% born in Europe, 1.3% born in Latin America), which is 23.0% greater than the foreign-born rate of 9.0% across the entire state of New Mexico.
Race distribution in Los Alamos
2000 2022
813,495 44.7% White alone 765,386 42.1% Hispanic 161,460 8.9% American Indian alone 30,654 1.7% Black alone 25,793 1.4% Two or more races 18,257 1.0% Asian alone 3,009 0.2% Other race alone 992 0.05% Native Hawaiian and Other
1,059,867 50.2% Hispanic 735,478 34.8% White alone 171,808 8.1% American Indian alone 65,084 3.1% Two or more races 36,870 1.7% Black alone 35,870 1.7% Asian alone 7,582 0.4% Other race alone 785 0.04% Native Hawaiian and Other
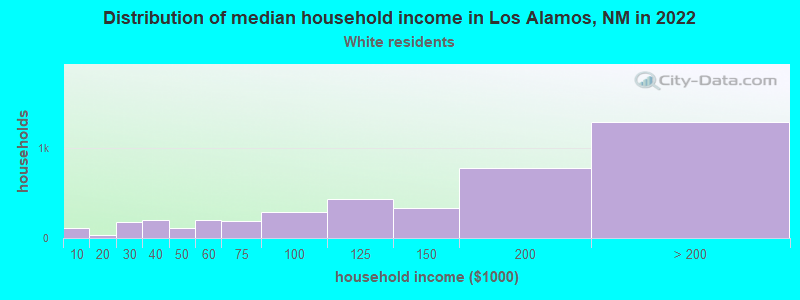
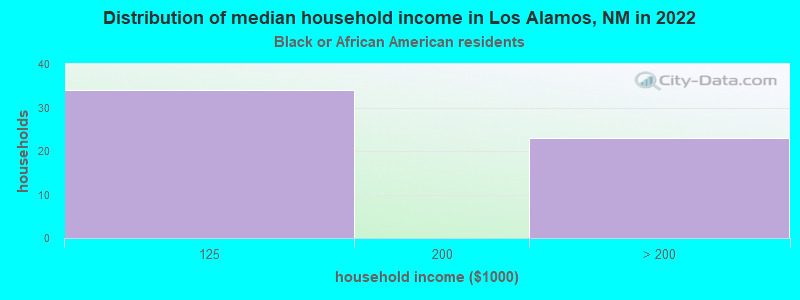
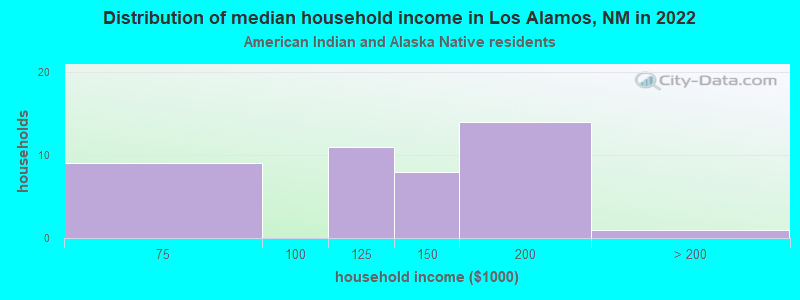
Income and house value in Los Alamos Median household income in 2022 $151,589 White non-Hispanic householders$147,123 American Indian and Alaska Native householders$105,779 Asian householders$81,150 Some other race householders$122,705 Two or more races householders$104,905 Hispanic or Latino race householdersMedian 2022 house value $521,872 White Non-Hispanic householders$428,342 American Indian or Alaska Native householders $445,512 Asian householders$455,226 Some other race householders$338,878 Two or more races householders$489,792 Hispanic or Latino householders
Median age by race in Los Alamos
46.8 Median age for White residents44.6 48.3 58.1 Median age for Black or African American residents65.9 35.7 56.8 Median age for American Indian / Alaska Native residents63.2 46.0 36.6 Median age for Asian residents35.5 39.1 -658,511,722.1 Median age for Native Hawaiian / Pacific Islander residents-685,897,435.2 -659,380,691.5 29.4 Median age for Other race residents28.6 29.8 35.1 Median age for Two or more races residents34.9 43.8 46.2 Median age for White alone residents43.8 47.7 33.6 Median age for Hispanic or Latino residents33.8 32.6
Owner/renter occupied households by race in Los Alamos
House owners and renters - White residents 2,921 73.4% Owner occupied1,060 26.6% Renter occupiedHouse owners and renters - Black or African American residents 64 100.0% Owner occupiedHouse owners and renters - American Indian / Alaska Native residents 10 23.4% Owner occupied32 76.6% Renter occupiedHouse owners and renters - Asian residents 177 31.1% Owner occupied393 68.9% Renter occupiedHouse owners and renters - Other race residents 100 39.6% Owner occupied153 60.4% Renter occupiedHouse owners and renters - Two or more races residents 567 72.4% Owner occupied217 27.6% Renter occupiedHouse owners and renters - White alone residents 3,217 74.6% Owner occupied1,093 25.4% Renter occupiedHouse owners and renters - Hispanic or Latino residents 577 60.5% Owner occupied376 39.5% Renter occupied
Language usage in Los Alamos
English speakers - Total 84.4% of residents of Los Alamos speak English at home.
7.1% of residents speak Spanish at home 802 86.6% Speak English very well124 13.4% Speak English less than very well8.7% of residents speak other language at home 777 68.8% Speak English very well352 31.2% Speak English less than very well
English speakers - Born in the United States 90.2% of residents of Los Alamos speak English at home.
7.4% of residents speak Spanish at home 499 87.9% Speak English very well69 12.1% Speak English less than very well1.7% of residents speak other language at home 129 100.0% Speak English very well
English speakers - Native, born elsewhere 33.8% of residents of Los Alamos speak English at home.
10.5% of residents speak Spanish at home 14 100.0% Speak English very well35.3% of residents speak other language at home 47 100.0% Speak English very well
English speakers - Foreign-born 31.2% of residents of Los Alamos speak English at home.
6.8% of residents speak Spanish at home 74 70.5% Speak English very well31 29.5% Speak English less than very well67.7% of residents speak other language at home 682 65.0% Speak English very well368 35.0% Speak English less than very well
White (Caucasian) - Speak only English Native:
100.0% (7,675)Foreign-born:
100.0% (220)
White (Caucasian) - Speak another language Native:
3.4% (260)Foreign-born:
68.7% (151)
Asian - Speak only English Native:
50.6% (98)Foreign-born:
8.9% (77)
Asian - Speak another language Native:
48.9% (94)Foreign-born:
90.2% (783)
Other race - Speak another language Native:
51.8% (290)Foreign-born:
98.8% (72)
Two or more races - Speak only English Native:
76.4% (1,463)Foreign-born:
70.0% (88)
Two or more races - Speak another language Native:
22.9% (439)Foreign-born:
39.4% (50)
White alone - Speak only English Native:
95.9% (8,033)Foreign-born:
54.8% (256)
White alone - Speak another language Native:
3.9% (328)Foreign-born:
45.4% (212)
Hispanic or Latino - Speak only English Native:
71.7% (1,508)Foreign-born:
56.6% (110)
Hispanic or Latino - Speak another language Native:
28.8% (605)Foreign-born:
58.4% (113)
Foreign-born residents in Los Alamos 1,573 residents are foreign born (6.3% Asia , 2.7% Europe , 1.3% Latin America ).
This city:
11.7%New Mexico:
9.2%
Marital status for residents in Los Alamos Marital status - White (Caucasian) population 15 years and over
Males 32.0% Never married55.9% Now married0.0% Separated1.5% Widowed10.6% DivorcedFemales 25.4% Never married54.5% Now married0.8% Separated4.2% Widowed15.1% DivorcedWomen who gave birth in the past 12 months Now married:
48.5% (73)Unmarried:
51.5% (77)
Women who did not give birth in the past 12 months Now married:
49.1% (708)Unmarried:
50.9% (734)
Marital status - Black or African American population 15 years and over
Males 5.8% Never married94.2% Now married0.0% Separated0.0% Widowed0.0% DivorcedFemales 22.5% Never married77.5% Now married0.0% Separated0.0% Widowed0.0% DivorcedWomen who did not give birth in the past 12 months Now married:
69.0% (39)Unmarried:
31.0% (18)
Marital status - American Indian / Alaska Native population 15 years and over
Males 5.9% Never married61.8% Now married0.0% Separated32.4% Widowed0.0% DivorcedFemales 31.6% Never married12.7% Now married20.3% Separated15.2% Widowed20.3% DivorcedWomen who gave birth in the past 12 months Now married:
100.0% (1)Unmarried:
0.0% (0)
Women who did not give birth in the past 12 months Now married:
29.0% (9)Unmarried:
71.0% (22)
Marital status - Asian population 15 years and over
Males 15.5% Never married75.7% Now married0.0% Separated2.4% Widowed6.4% DivorcedFemales 10.5% Never married73.5% Now married0.0% Separated0.0% Widowed15.9% DivorcedWomen who gave birth in the past 12 months Now married:
100.0% (24)Unmarried:
0.0% (0)
Women who did not give birth in the past 12 months Now married:
81.5% (227)Unmarried:
18.5% (51)
Marital status - Other race population 15 years and over
Males 44.3% Never married46.0% Now married0.0% Separated9.7% Widowed0.0% DivorcedFemales 38.2% Never married44.6% Now married0.0% Separated0.4% Widowed16.9% DivorcedWomen who did not give birth in the past 12 months Now married:
46.7% (133)Unmarried:
53.3% (152)
Marital status - Two or more races population 15 years and over
Males 30.5% Never married45.8% Now married0.0% Separated2.2% Widowed21.5% DivorcedFemales 16.1% Never married76.1% Now married0.0% Separated3.3% Widowed4.5% DivorcedWomen who did not give birth in the past 12 months Now married:
70.1% (257)Unmarried:
29.9% (110)
Marital status - White alone, not Hispanic / Latino population 15 years and over
Males 29.8% Never married57.9% Now married0.0% Separated1.6% Widowed10.6% DivorcedFemales 24.2% Never married55.1% Now married0.3% Separated4.7% Widowed15.7% DivorcedWomen who gave birth in the past 12 months Now married:
48.7% (94)Unmarried:
51.3% (99)
Women who did not give birth in the past 12 months Now married:
48.1% (745)Unmarried:
51.9% (804)
Marital status - Hispanic or Latino population 15 years and over
Males 42.5% Never married42.4% Now married0.0% Separated1.3% Widowed13.8% DivorcedFemales 29.3% Never married59.5% Now married2.4% Separated0.1% Widowed8.8% DivorcedWomen who gave birth in the past 12 months Now married:
50.0% (1)Unmarried:
50.0% (1)
Women who did not give birth in the past 12 months Now married:
57.4% (414)Unmarried:
42.6% (307)
Ancestries in Los Alamos
851 12.6% English558 8.3% German467 6.9% European342 5.1% American274 4.1% Italian261 3.9% Irish126 1.9% Polish106 1.6% Scottish72 1.1% Eastern European69 1.0% Swedish60 0.9% Belgian59 0.9% Greek53 0.8% Russian49 0.7% French46 0.7% Ethiopian42 0.6% Norwegian41 0.6% Serbian38 0.6% Ukrainian33 0.5% British33 0.5% Canadian33 0.5% Nigerian28 0.4% Northern European28 0.4% Scotch-Irish23 0.3% Dutch20 0.3% Welsh20 0.3% French Canadian17 0.3% Danish12 0.2% Hungarian11 0.2% Slavic9 0.1% Latvian9 0.1% Swiss8 0.1% Slovene8 0.1% Scandinavian8 0.1% New Zealander6 0.09% Slovak4 0.06% Croatian1 0.01% African
Children Nativity (place of birth) in Los Alamos
Children under 6 years - Living with two parents Both parents native 363 100.0% NativeBoth parents foreign-born 48 77.1% Native14 22.9% Foreign-bornOne native, one foreign-born parent 30 100.0% NativeChildren under 6 years - Living with one parent Native parent 80 100.0% NativeChildren 6 to 17 years - Living with two parents Both parents native 1,243 98.7% Native17 1.3% Foreign-bornBoth parents foreign-born 70 62.5% Native42 37.5% Foreign-bornOne native, one foreign-born parent 55 94.0% Native4 6.0% Foreign-bornChildren 6 to 17 years - Living with one parent Native parent 413 100.0% NativeForeign-born parent 73 66.4% Native37 33.6% Foreign-born
Grandparents responsible for own grandchildren in Los Alamos
Grandparents (30 to 59 years) White / Caucasian 70 100.0% Not responsible for grandchildrenOther race 12 37.8% Responsible for grandchildren20 62.2% Not responsible for grandchildrenWhite alone, not Hispanic / Latino 109 100.0% Not responsible for grandchildrenHispanic or Latino 6 35.6% Responsible for grandchildren11 64.4% Not responsible for grandchildrenGrandparents (60 years and over) White / Caucasian 49 57.2% Responsible for grandchildren37 42.8% Not responsible for grandchildrenWhite alone, not Hispanic / Latino 62 56.4% Responsible for grandchildren48 43.6% Not responsible for grandchildrenHispanic or Latino 8 100.0% Not responsible for grandchildren