Races in Long Beach, New York (NY) Detailed Stats
Data:
Races - White alone (%)
Races - White alone (% change since 2000)
Races - Black alone (%)
Races - Black alone (% change since 2000)
Races - American Indian alone (%)
Races - American Indian alone (% change since 2000)
Races - Asian alone (%)
Races - Asian alone (% change since 2000)
Races - Hispanic (%)
Races - Hispanic (% change since 2000)
Races - Native Hawaiian and Other Pacific Islander alone (%)
Races - Native Hawaiian and Other Pacific Islander alone (% change since 2000)
Races - Two or more races(%)
Races - Two or more races(% change since 2000)
Races - Other race alone (%)
Races - Other race alone (% change since 2000)
Racial diversity
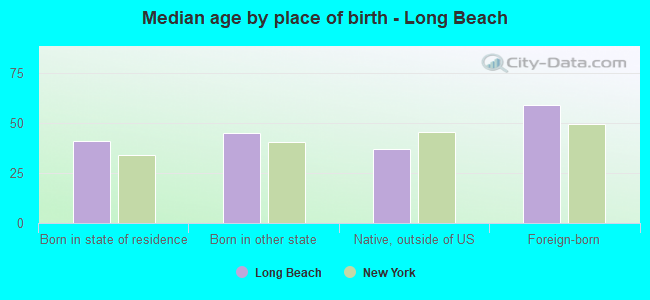
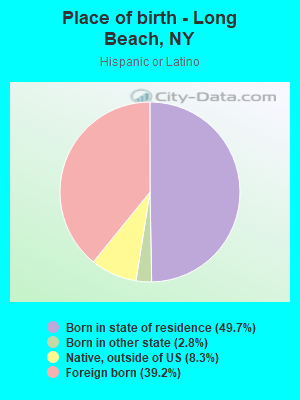
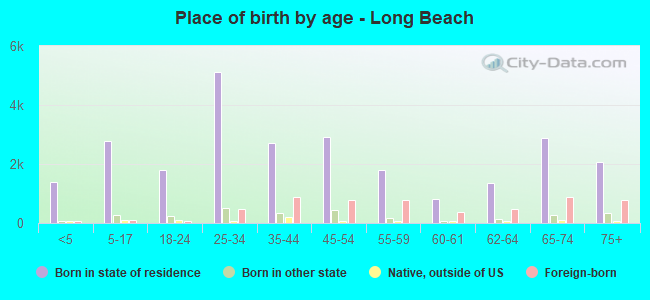
Place of birth - Born in state of residence (%)
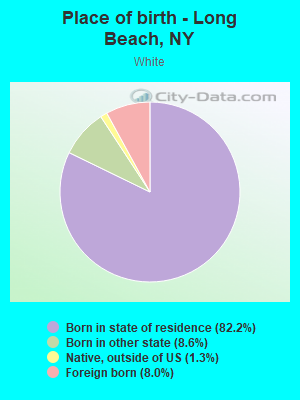
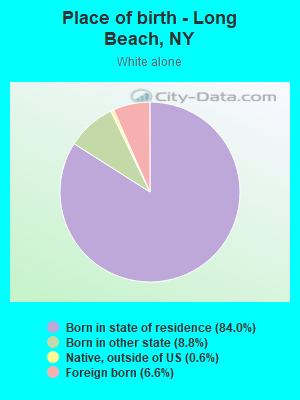
Place of birth - Born in state of residence (%) - White
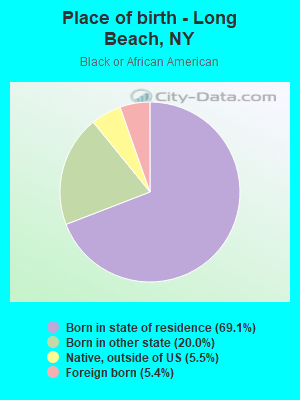
Place of birth - Born in state of residence (%) - Black or African American
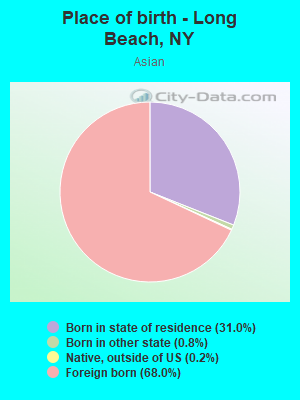
Place of birth - Born in state of residence (%) - Asian
Place of birth - Born in state of residence (%) - Hispanic or Latino
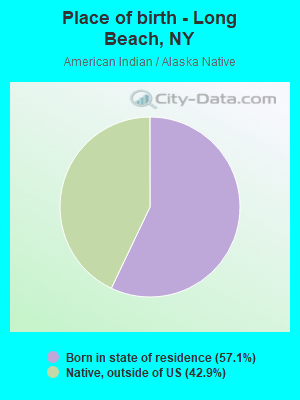
Place of birth - Born in state of residence (%) - American Indian and Alaska Native
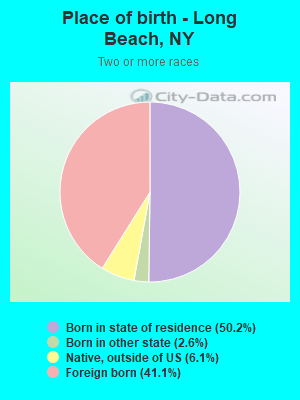
Place of birth - Born in state of residence (%) - Multirace
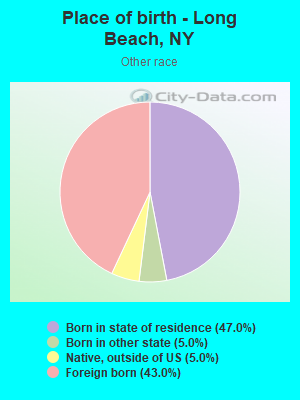
Place of birth - Born in state of residence (%) - Other Race
Place of birth - Born in other state (%)
Place of birth - Born in other state (%) - White
Place of birth - Born in other state (%) - Black or African American
Place of birth - Born in other state (%) - Asian
Place of birth - Born in other state (%) - Hispanic or Latino
Place of birth - Born in other state (%) - American Indian and Alaska Native
Place of birth - Born in other state (%) - Multirace
Place of birth - Born in other state (%) - Other Race
Place of birth - Native, outside of US (%)
Place of birth - Native, outside of US (%) - White
Place of birth - Native, outside of US (%) - Black or African American
Place of birth - Native, outside of US (%) - Asian
Place of birth - Native, outside of US (%) - Hispanic or Latino
Place of birth - Native, outside of US (%) - American Indian and Alaska Native
Place of birth - Native, outside of US (%) - Multirace
Place of birth - Native, outside of US (%) - Other Race
Place of birth - Foreign born (%)
Place of birth - Foreign born (%) - White
Place of birth - Foreign born (%) - Black or African American
Place of birth - Foreign born (%) - Asian
Place of birth - Foreign born (%) - Hispanic or Latino
Place of birth - Foreign born (%) - American Indian and Alaska Native
Place of birth - Foreign born (%) - Multirace
Place of birth - Foreign born (%) - Other Race
Residents speaking English at home (%)
Residents speaking English at home - Born in the United States (%)
Residents speaking English at home - Native, born elsewhere (%)
Residents speaking English at home - Foreign born (%)
Residents speaking Spanish at home (%)
Residents speaking Spanish at home - Born in the United States (%)
Residents speaking Spanish at home - Native, born elsewhere (%)
Residents speaking Spanish at home - Foreign born (%)
Residents speaking other language at home (%)
Residents speaking other language at home - Born in the United States (%)
Residents speaking other language at home - Native, born elsewhere (%)
Residents speaking other language at home - Foreign born (%)
Marital status - Never married (%)
Marital status - Now married (%)
Marital status - Separated (%)
Marital status - Widowed (%)
Marital status - Divorced (%)
Ancestries Reported - Arab (%)
Ancestries Reported - Czech (%)
Ancestries Reported - Danish (%)
Ancestries Reported - Dutch (%)
Ancestries Reported - English (%)
Ancestries Reported - French (%)
Ancestries Reported - French Canadian (%)
Ancestries Reported - German (%)
Ancestries Reported - Greek (%)
Ancestries Reported - Hungarian (%)
Ancestries Reported - Irish (%)
Ancestries Reported - Italian (%)
Ancestries Reported - Lithuanian (%)
Ancestries Reported - Norwegian (%)
Ancestries Reported - Polish (%)
Ancestries Reported - Portuguese (%)
Ancestries Reported - Russian (%)
Ancestries Reported - Scotch-Irish (%)
Ancestries Reported - Scottish (%)
Ancestries Reported - Slovak (%)
Ancestries Reported - Subsaharan African (%)
Ancestries Reported - Swedish (%)
Ancestries Reported - Swiss (%)
Ancestries Reported - Ukrainian (%)
Ancestries Reported - United States (%)
Ancestries Reported - Welsh (%)
Ancestries Reported - West Indian (%)
Ancestries Reported - Other (%)
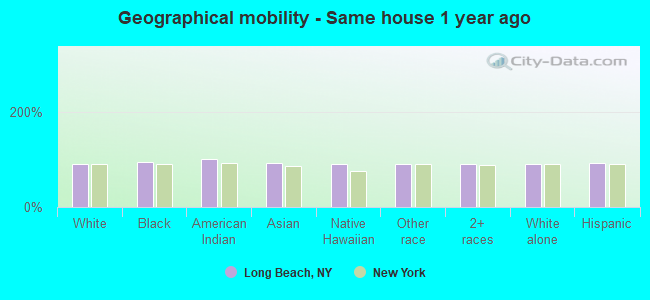
Geographical mobility - Same house 1 year ago (%)
Geographical mobility - Same house 1 year ago (%) - White
Geographical mobility - Same house 1 year ago (%) - Black or African American
Geographical mobility - Same house 1 year ago (%) - Asian
Geographical mobility - Same house 1 year ago (%) - Hispanic or Latino
Geographical mobility - Same house 1 year ago (%) - American Indian and Alaska Native
Geographical mobility - Same house 1 year ago (%) - Multirace
Geographical mobility - Same house 1 year ago (%) - Other Race
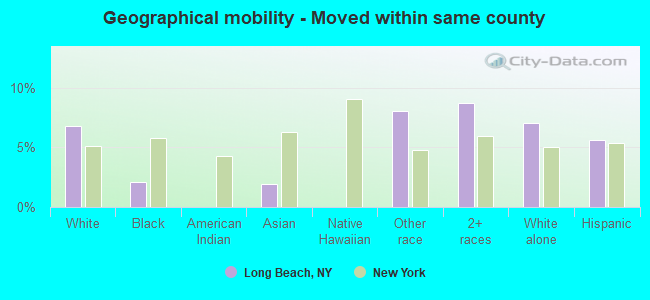
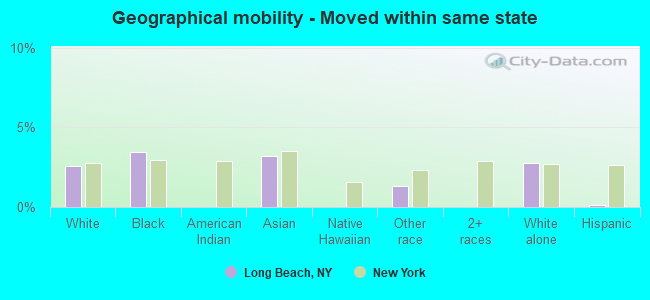
Geographical mobility - Moved within same county (%)
Geographical mobility - Moved within same county (%) - White
Geographical mobility - Moved within same county (%) - Black or African American
Geographical mobility - Moved within same county (%) - Asian
Geographical mobility - Moved within same county (%) - Hispanic or Latino
Geographical mobility - Moved within same county (%) - American Indian and Alaska Native
Geographical mobility - Moved within same county (%) - Multirace
Geographical mobility - Moved within same county (%) - Other Race
Geographical mobility - Moved from different county within same state (%)
Geographical mobility - Moved from different county within same state (%) - White
Geographical mobility - Moved from different county within same state (%) - Black or African American
Geographical mobility - Moved from different county within same state (%) - Asian
Geographical mobility - Moved from different county within same state (%) - Hispanic or Latino
Geographical mobility - Moved from different county within same state (%) - American Indian and Alaska Native
Geographical mobility - Moved from different county within same state (%) - Multirace
Geographical mobility - Moved from different county within same state (%) - Other Race
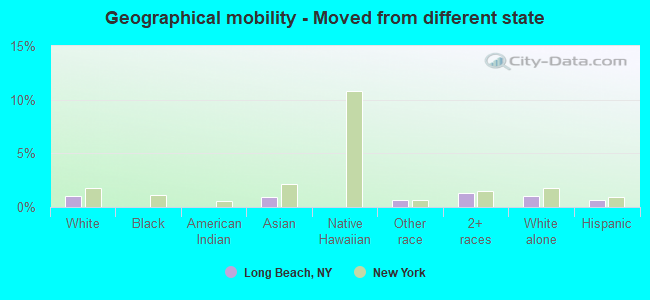
Geographical mobility - Moved from different state (%)
Geographical mobility - Moved from different state (%) - White
Geographical mobility - Moved from different state (%) - Black or African American
Geographical mobility - Moved from different state (%) - Asian
Geographical mobility - Moved from different state (%) - Hispanic or Latino
Geographical mobility - Moved from different state (%) - American Indian and Alaska Native
Geographical mobility - Moved from different state (%) - Multirace
Geographical mobility - Moved from different state (%) - Other Race
Geographical mobility - Moved from abroad (%)
Geographical mobility - Moved from abroad (%) - White
Geographical mobility - Moved from abroad (%) - Black or African American
Geographical mobility - Moved from abroad (%) - Asian
Geographical mobility - Moved from abroad (%) - Hispanic or Latino
Geographical mobility - Moved from abroad (%) - American Indian and Alaska Native
Geographical mobility - Moved from abroad (%) - Multirace
Geographical mobility - Moved from abroad (%) - Other Race
Place of birth for the foreign-born population - Ireland (%)
Place of birth for the foreign-born population - Denmark (%)
Place of birth for the foreign-born population - Norway (%)
Place of birth for the foreign-born population - Sweden (%)
Place of birth for the foreign-born population - United Kingdom (%)
Place of birth for the foreign-born population - England (%)
Place of birth for the foreign-born population - Scotland (%)
Place of birth for the foreign-born population - Other Northern Europe (%)
Place of birth for the foreign-born population - Austria (%)
Place of birth for the foreign-born population - Belgium (%)
Place of birth for the foreign-born population - France (%)
Place of birth for the foreign-born population - Germany (%)
Place of birth for the foreign-born population - Netherlands (%)
Place of birth for the foreign-born population - Switzerland (%)
Place of birth for the foreign-born population - Other Western Europe (%)
Place of birth for the foreign-born population - Greece (%)
Place of birth for the foreign-born population - Italy (%)
Place of birth for the foreign-born population - Portugal (%)
Place of birth for the foreign-born population - Spain (%)
Place of birth for the foreign-born population - Other Southern Europe (%)
Place of birth for the foreign-born population - Albania (%)
Place of birth for the foreign-born population - Belarus (%)
Place of birth for the foreign-born population - Bosnia and Herzegovina (%)
Place of birth for the foreign-born population - Bulgaria (%)
Place of birth for the foreign-born population - Croatia (%)
Place of birth for the foreign-born population - Czechoslovakia (%)
Place of birth for the foreign-born population - Hungary (%)
Place of birth for the foreign-born population - Latvia (%)
Place of birth for the foreign-born population - Lithuania (%)
Place of birth for the foreign-born population - North Macedonia (Macedonia) (%)
Place of birth for the foreign-born population - Moldova (%)
Place of birth for the foreign-born population - Poland (%)
Place of birth for the foreign-born population - Romania (%)
Place of birth for the foreign-born population - Russia (%)
Place of birth for the foreign-born population - Serbia (%)
Place of birth for the foreign-born population - Ukraine (%)
Place of birth for the foreign-born population - Other Eastern Europe (%)
Place of birth for the foreign-born population - China (%)
Place of birth for the foreign-born population - Hong Kong (%)
Place of birth for the foreign-born population - Taiwan (%)
Place of birth for the foreign-born population - Japan (%)
Place of birth for the foreign-born population - Korea (%)
Place of birth for the foreign-born population - Other Eastern Asia (%)
Place of birth for the foreign-born population - Afghanistan (%)
Place of birth for the foreign-born population - Bangladesh (%)
Place of birth for the foreign-born population - India (%)
Place of birth for the foreign-born population - Iran (%)
Place of birth for the foreign-born population - Kazakhstan (%)
Place of birth for the foreign-born population - Nepal (%)
Place of birth for the foreign-born population - Pakistan (%)
Place of birth for the foreign-born population - Sri Lanka (%)
Place of birth for the foreign-born population - Uzbekistan (%)
Place of birth for the foreign-born population - Other South Central Asia (%)
Place of birth for the foreign-born population - Burma (%)
Place of birth for the foreign-born population - Cambodia (%)
Place of birth for the foreign-born population - Indonesia (%)
Place of birth for the foreign-born population - Laos (%)
Place of birth for the foreign-born population - Malaysia (%)
Place of birth for the foreign-born population - Philippines (%)
Place of birth for the foreign-born population - Singapore (%)
Place of birth for the foreign-born population - Thailand (%)
Place of birth for the foreign-born population - Vietnam (%)
Place of birth for the foreign-born population - Other South Eastern Asia (%)
Place of birth for the foreign-born population - Armenia (%)
Place of birth for the foreign-born population - Iraq (%)
Place of birth for the foreign-born population - Israel (%)
Place of birth for the foreign-born population - Jordan (%)
Place of birth for the foreign-born population - Kuwait (%)
Place of birth for the foreign-born population - Lebanon (%)
Place of birth for the foreign-born population - Saudi Arabia (%)
Place of birth for the foreign-born population - Syria (%)
Place of birth for the foreign-born population - Turkey (%)
Place of birth for the foreign-born population - Yemen (%)
Place of birth for the foreign-born population - Other Western Asia (%)
Place of birth for the foreign-born population - Eritrea (%)
Place of birth for the foreign-born population - Ethiopia (%)
Place of birth for the foreign-born population - Kenya (%)
Place of birth for the foreign-born population - Somalia (%)
Place of birth for the foreign-born population - Uganda (%)
Place of birth for the foreign-born population - Zimbabwe (%)
Place of birth for the foreign-born population - Other Eastern Africa (%)
Place of birth for the foreign-born population - Cameroon (%)
Place of birth for the foreign-born population - Congo (%)
Place of birth for the foreign-born population - Democratic Republic of Congo (Zaire) (%)
Place of birth for the foreign-born population - Other Middle Africa (%)
Place of birth for the foreign-born population - Egypt (%)
Place of birth for the foreign-born population - Morocco (%)
Place of birth for the foreign-born population - Sudan (%)
Place of birth for the foreign-born population - Other Northern Africa (%)
Place of birth for the foreign-born population - South Africa (%)
Place of birth for the foreign-born population - Other Southern Africa (%)
Place of birth for the foreign-born population - Cabo Verde (%)
Place of birth for the foreign-born population - Ghana (%)
Place of birth for the foreign-born population - Liberia (%)
Place of birth for the foreign-born population - Nigeria (%)
Place of birth for the foreign-born population - Senegal (%)
Place of birth for the foreign-born population - Sierra Leone (%)
Place of birth for the foreign-born population - Other Western Africa (%)
Place of birth for the foreign-born population - Australia (%)
Place of birth for the foreign-born population - New Zealand (%)
Place of birth for the foreign-born population - Fiji (%)
Place of birth for the foreign-born population - Micronesia (%)
Place of birth for the foreign-born population - Bahamas (%)
Place of birth for the foreign-born population - Barbados (%)
Place of birth for the foreign-born population - Cuba (%)
Place of birth for the foreign-born population - Dominica (%)
Place of birth for the foreign-born population - Dominican Republic (%)
Place of birth for the foreign-born population - Grenada (%)
Place of birth for the foreign-born population - Haiti (%)
Place of birth for the foreign-born population - Jamaica (%)
Place of birth for the foreign-born population - St. Vincent and the Grenadines (%)
Place of birth for the foreign-born population - Trinidad and Tobago (%)
Place of birth for the foreign-born population - West Indies (%)
Place of birth for the foreign-born population - Other Caribbean (%)
Place of birth for the foreign-born population - Belize (%)
Place of birth for the foreign-born population - Costa Rica (%)
Place of birth for the foreign-born population - El Salvador (%)
Place of birth for the foreign-born population - Guatemala (%)
Place of birth for the foreign-born population - Honduras (%)
Place of birth for the foreign-born population - Mexico (%)
Place of birth for the foreign-born population - Nicaragua (%)
Place of birth for the foreign-born population - Panama (%)
Place of birth for the foreign-born population - Other Central America (%)
Place of birth for the foreign-born population - Argentina (%)
Place of birth for the foreign-born population - Bolivia (%)
Place of birth for the foreign-born population - Brazil (%)
Place of birth for the foreign-born population - Chile (%)
Place of birth for the foreign-born population - Colombia (%)
Place of birth for the foreign-born population - Ecuador (%)
Place of birth for the foreign-born population - Guyana (%)
Place of birth for the foreign-born population - Peru (%)
Place of birth for the foreign-born population - Uruguay (%)
Place of birth for the foreign-born population - Venezuela (%)
Place of birth for the foreign-born population - Other South America (%)
Place of birth for the foreign-born population - Canada (%)
Place of birth for the foreign-born population - Other Northern America (%)
Place of birth for the foreign-born population - Other (%)
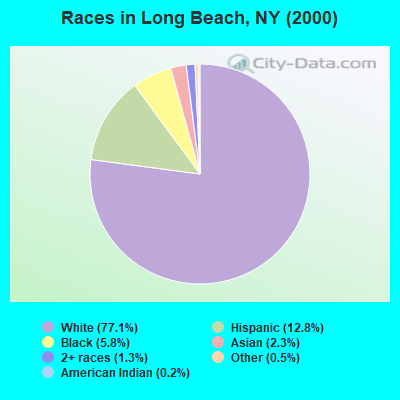
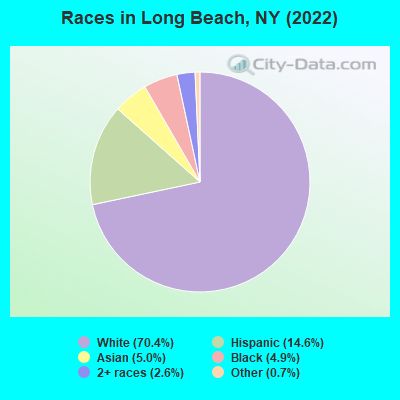
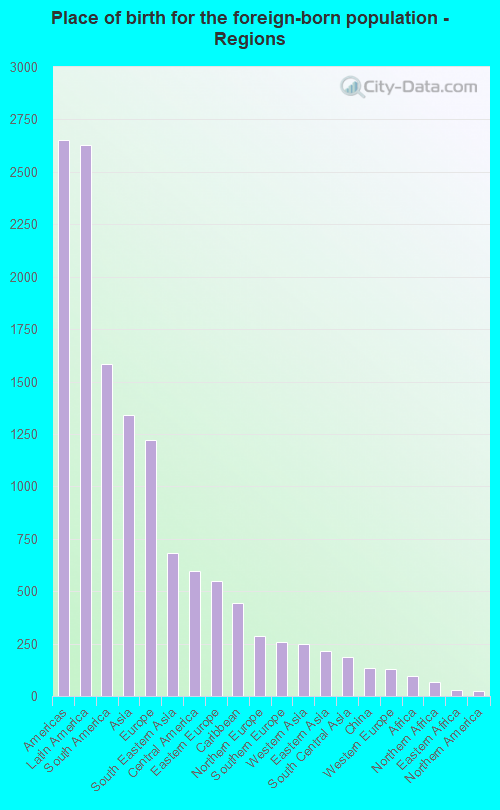
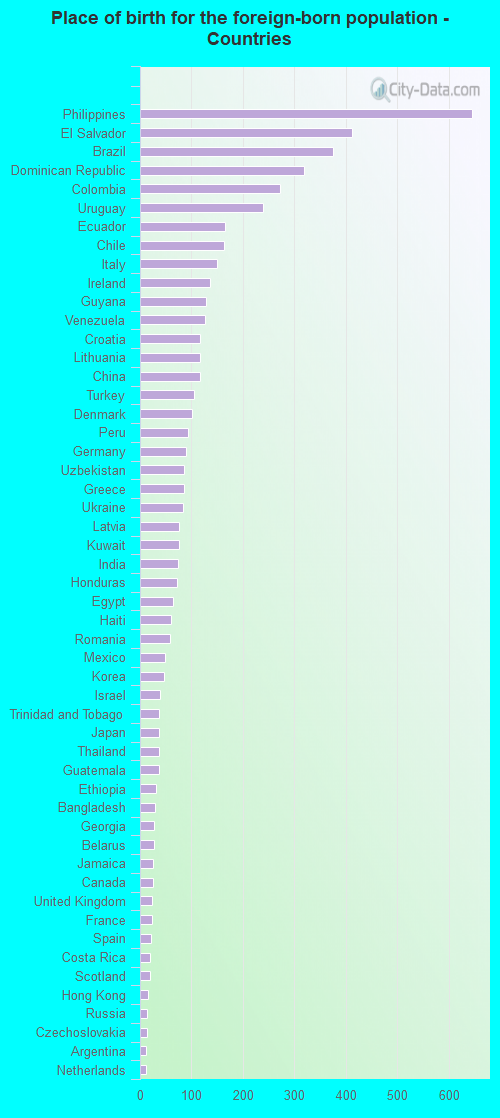
According to 2022 data, the most numerous races in Long Beach, NY are White alone (24,340 residents), Hispanic (5,064 residents), and Black alone (1,711 residents). 80.7% of Long Beach residents speak English at home. 15.3% of Long Beach, NY residents are foreign-born (7.6% born in Latin America, 3.9% born in Asia, 3.6% born in Europe), which is 43.3% less than the foreign-born rate of 22.0% across the entire state of New York.
Race distribution in Long Beach
2000 2022
11,760,981 62.0% White alone 2,867,583 15.1% Hispanic 2,812,623 14.8% Black alone 1,035,926 5.5% Asian alone 366,116 1.9% Two or more races 75,499 0.4% Other race alone 52,499 0.3% American Indian alone 5,230 0.03% Native Hawaiian and Other
10,408,933 52.9% White alone 3,867,299 19.7% Hispanic 2,633,840 13.4% Black alone 1,776,286 9.0% Asian alone 732,670 3.7% Two or more races 216,110 1.1% Other race alone 35,082 0.2% American Indian alone 6,931 0.04% Native Hawaiian and Other
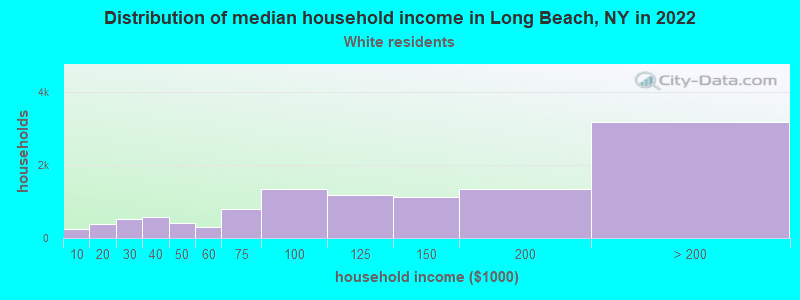
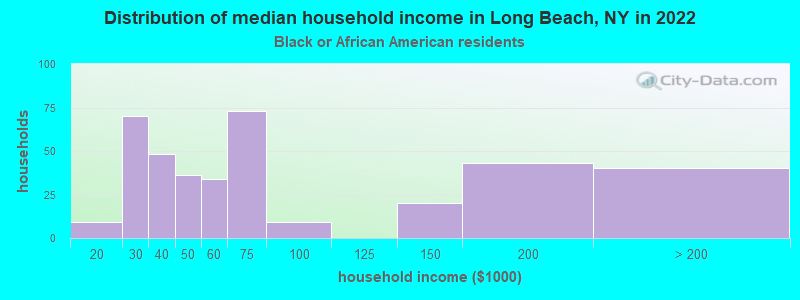
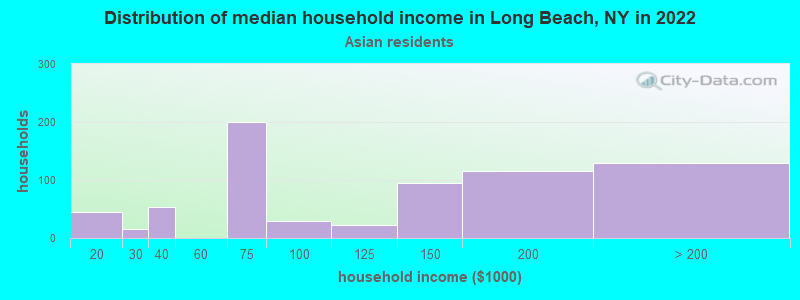
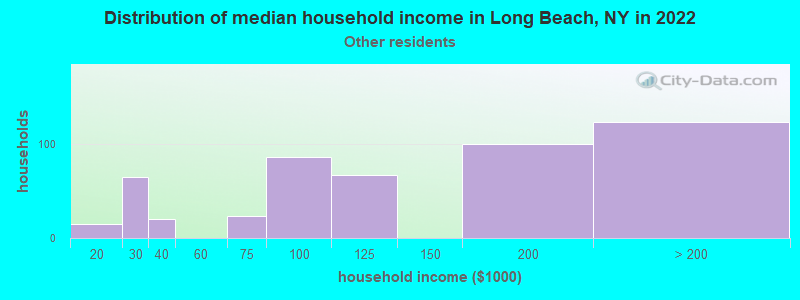
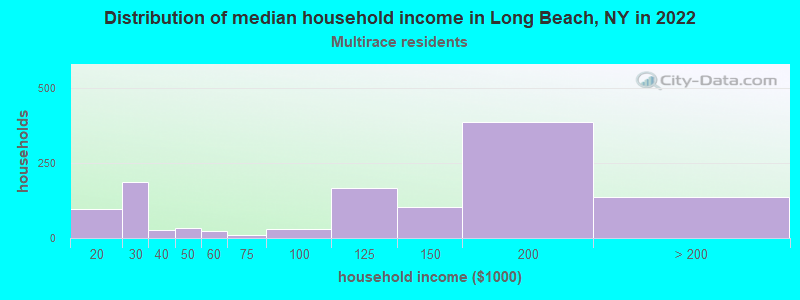
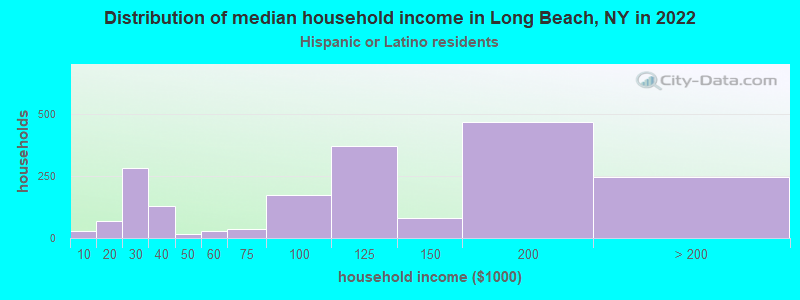
Income and house value in Long Beach Median household income in 2022 $128,469 White non-Hispanic householders$61,530 Black householders$108,681 Asian householders$120,608 Some other race householders$140,285 Two or more races householders$112,936 Hispanic or Latino race householdersMedian 2022 house value $674,564 White Non-Hispanic householders$574,324 Black or African American householders $952,129 Asian householders$529,231 Some other race householders$672,736 Two or more races householders$629,166 Hispanic or Latino householders
Median age by race in Long Beach
47.5 Median age for White residents45.1 50.8 32.1 Median age for Black or African American residents29.8 39.7 33.4 Median age for American Indian / Alaska Native residents-607,543,322.5 -837,121,211.3 39.1 Median age for Asian residents32.9 49.1 -487,992,314.6 Median age for Native Hawaiian / Pacific Islander residents-477,502,295.2 -497,387,669.3 44.7 Median age for Other race residents45.3 42.4 52.7 Median age for Two or more races residents53.4 52.3 47.7 Median age for White alone residents44.8 51.1 41.1 Median age for Hispanic or Latino residents40.4 41.9
Owner/renter occupied households by race in Long Beach
House owners and renters - White residents 7,357 63.7% Owner occupied4,188 36.3% Renter occupiedHouse owners and renters - Black or African American residents 25 7.4% Owner occupied311 92.6% Renter occupiedHouse owners and renters - American Indian / Alaska Native residents 24 100.0% Owner occupiedHouse owners and renters - Asian residents 334 49.1% Owner occupied346 50.9% Renter occupiedHouse owners and renters - Other race residents 174 37.8% Owner occupied287 62.2% Renter occupiedHouse owners and renters - Two or more races residents 810 76.3% Owner occupied251 23.7% Renter occupiedHouse owners and renters - White alone residents 7,256 64.7% Owner occupied3,956 35.3% Renter occupiedHouse owners and renters - Hispanic or Latino residents 976 54.1% Owner occupied829 45.9% Renter occupied
Language usage in Long Beach
English speakers - Total 80.7% of residents of Long Beach speak English at home.
8.5% of residents speak Spanish at home 1,868 66.1% Speak English very well956 33.9% Speak English less than very well10.2% of residents speak other language at home 2,047 60.3% Speak English very well1,346 39.7% Speak English less than very well
English speakers - Born in the United States 91.9% of residents of Long Beach speak English at home.
1.6% of residents speak Spanish at home 38 86.4% Speak English very well6 13.6% Speak English less than very well5.1% of residents speak other language at home 140 100.0% Speak English very well
English speakers - Native, born elsewhere 48.0% of residents of Long Beach speak English at home.
48.5% of residents speak Spanish at home 139 43.3% Speak English very well182 56.7% Speak English less than very well1.2% of residents speak other language at home 8 100.0% Speak English very well
English speakers - Foreign-born 24.4% of residents of Long Beach speak English at home.
28.9% of residents speak Spanish at home 848 53.7% Speak English very well731 46.3% Speak English less than very well44.8% of residents speak other language at home 1,248 51.0% Speak English very well1,200 49.0% Speak English less than very well
White (Caucasian) - Speak only English Native:
96.1% (21,673)Foreign-born:
38.5% (777)
White (Caucasian) - Speak another language Native:
4.4% (1,003)Foreign-born:
63.4% (1,279)
Black or African American - Speak only English Native:
96.0% (1,508)Foreign-born:
75.0% (72)
Black or African American - Speak another language Native:
3.4% (54)Foreign-born:
24.6% (24)
Asian - Speak only English Native:
71.0% (346)Foreign-born:
18.9% (241)
Asian - Speak another language Native:
30.5% (149)Foreign-born:
79.3% (1,012)
Other race - Speak only English Native:
57.4% (580)Foreign-born:
10.4% (85)
Other race - Speak another language Native:
45.3% (458)Foreign-born:
88.6% (721)
Two or more races - Speak only English Native:
77.3% (1,003)Foreign-born:
13.7% (140)
Two or more races - Speak another language Native:
19.9% (258)Foreign-born:
87.0% (891)
White alone - Speak only English Native:
97.0% (21,305)Foreign-born:
44.0% (703)
White alone - Speak another language Native:
3.2% (710)Foreign-born:
55.6% (890)
Hispanic or Latino - Speak only English Native:
54.6% (1,387)Foreign-born:
11.5% (229)
Hispanic or Latino - Speak another language Native:
45.2% (1,149)Foreign-born:
88.5% (1,766)
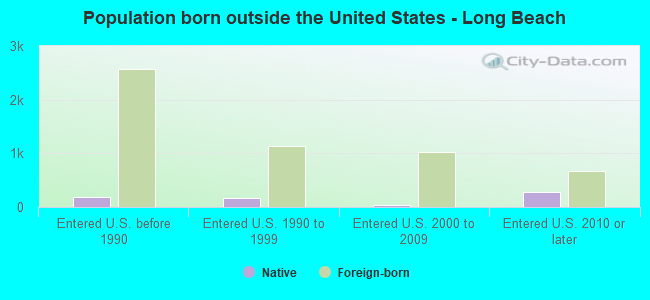
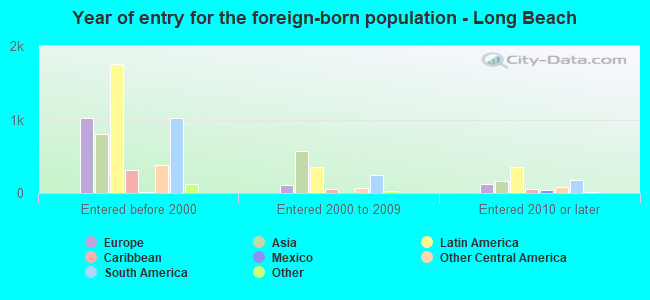
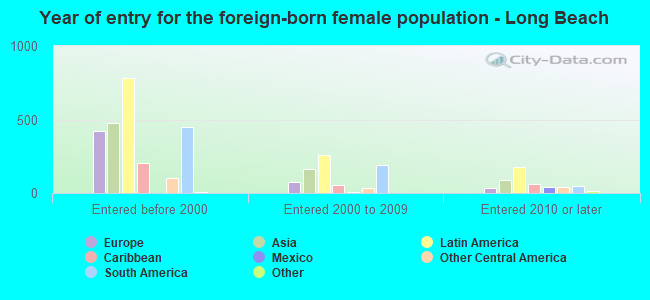
Foreign-born residents in Long Beach 5,310 residents are foreign born (7.6% Latin America , 3.9% Asia , 3.6% Europe ).
This city:
15.3%New York:
22.6%
Marital status for residents in Long Beach Marital status - White (Caucasian) population 15 years and over
Males 38.3% Never married48.1% Now married1.9% Separated2.3% Widowed9.4% DivorcedFemales 30.0% Never married43.4% Now married1.5% Separated11.4% Widowed13.8% DivorcedWomen who gave birth in the past 12 months Now married:
97.1% (237)Unmarried:
2.9% (7)
Women who did not give birth in the past 12 months Now married:
36.5% (1,917)Unmarried:
63.5% (3,331)
Marital status - Black or African American population 15 years and over
Males 83.3% Never married12.7% Now married0.0% Separated3.5% Widowed0.5% DivorcedFemales 50.9% Never married8.2% Now married6.6% Separated20.6% Widowed13.6% DivorcedWomen who gave birth in the past 12 months Now married:
0.0% (0)Unmarried:
100.0% (36)
Women who did not give birth in the past 12 months Now married:
10.9% (45)Unmarried:
89.1% (372)
Marital status - American Indian / Alaska Native population 15 years and over
Males 0.0% Never married0.0% Now married0.0% Separated0.0% Widowed100.0% DivorcedFemales 100.0% Never married0.0% Now married0.0% Separated0.0% Widowed0.0% DivorcedWomen who did not give birth in the past 12 months Now married:
0.0% (0)Unmarried:
100.0% (36)
Marital status - Asian population 15 years and over
Males 40.8% Never married55.6% Now married0.0% Separated3.6% Widowed0.0% DivorcedFemales 27.7% Never married49.0% Now married3.1% Separated7.6% Widowed12.6% DivorcedWomen who gave birth in the past 12 months Now married:
100.0% (20)Unmarried:
0.0% (0)
Women who did not give birth in the past 12 months Now married:
56.0% (209)Unmarried:
44.0% (164)
Marital status - Other race population 15 years and over
Males 36.7% Never married42.2% Now married8.7% Separated3.2% Widowed9.3% DivorcedFemales 38.2% Never married43.0% Now married2.4% Separated2.8% Widowed13.6% DivorcedWomen who gave birth in the past 12 months Now married:
41.5% (19)Unmarried:
58.5% (27)
Women who did not give birth in the past 12 months Now married:
34.3% (127)Unmarried:
65.7% (244)
Marital status - Two or more races population 15 years and over
Males 66.6% Never married28.6% Now married0.0% Separated0.0% Widowed4.8% DivorcedFemales 20.5% Never married44.6% Now married8.8% Separated6.2% Widowed19.9% DivorcedWomen who gave birth in the past 12 months Now married:
100.0% (36)Unmarried:
0.0% (0)
Women who did not give birth in the past 12 months Now married:
42.6% (125)Unmarried:
57.4% (169)
Marital status - White alone, not Hispanic / Latino population 15 years and over
Males 37.8% Never married48.8% Now married1.7% Separated2.3% Widowed9.5% DivorcedFemales 28.7% Never married44.6% Now married1.0% Separated11.2% Widowed14.5% DivorcedWomen who gave birth in the past 12 months Now married:
96.9% (240)Unmarried:
3.1% (8)
Women who did not give birth in the past 12 months Now married:
36.5% (1,754)Unmarried:
63.5% (3,050)
Marital status - Hispanic or Latino population 15 years and over
Males 44.0% Never married41.0% Now married4.2% Separated2.7% Widowed8.1% DivorcedFemales 35.1% Never married40.0% Now married4.4% Separated8.0% Widowed12.5% DivorcedWomen who gave birth in the past 12 months Now married:
69.6% (55)Unmarried:
30.4% (24)
Women who did not give birth in the past 12 months Now married:
37.0% (444)Unmarried:
63.0% (756)
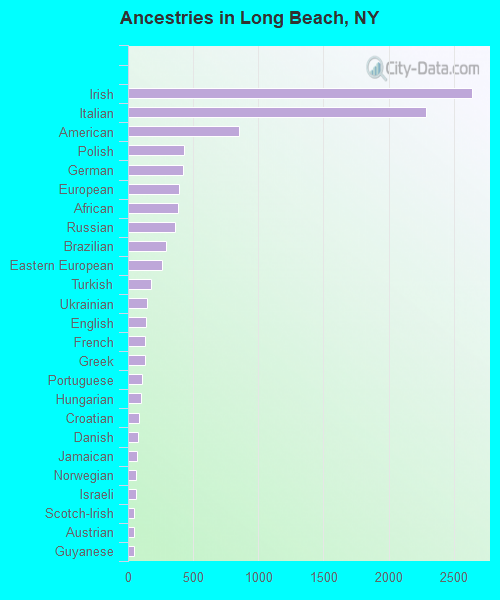
Ancestries in Long Beach
2,638 17.1% Irish2,284 14.8% Italian848 5.5% American430 2.8% Polish422 2.7% German388 2.5% European382 2.5% African364 2.4% Russian289 1.9% Brazilian262 1.7% Eastern European174 1.1% Turkish145 0.9% Ukrainian136 0.9% English133 0.9% French128 0.8% Greek111 0.7% Portuguese100 0.6% Hungarian85 0.6% Croatian74 0.5% Danish66 0.4% Jamaican65 0.4% Norwegian65 0.4% Israeli49 0.3% Scotch-Irish48 0.3% Austrian45 0.3% Guyanese35 0.2% Trinidadian and Tobagonian28 0.2% Welsh24 0.2% Czechoslovakian21 0.1% Czech19 0.1% Lithuanian18 0.1% Scottish17 0.1% Latvian17 0.1% Maltese15 0.10% Cypriot14 0.09% Armenian12 0.08% Palestinian12 0.08% Soviet Union10 0.06% Romanian9 0.06% Haitian7 0.05% Albanian7 0.05% Swiss2 0.01% Scandinavian
Geographical mobility in Long Beach Same house 1 year ago 22,544 89.9% White (Caucasian)1,684 94.2% Black or African American57 100.0% American Indian / Alaska Native1,665 92.7% Asian4 89.7% Native Hawaiian / Pacific Islander1,669 90.1% Other race2,209 90.4% Two or more races21,575 89.5% White alone, not Hispanic / Latino4,585 93.4% Hispanic or LatinoMoved within same county 1,694 6.8% White / Caucasian38 2.1% Black or African American34 1.9% Asian148 8.0% Other race213 8.7% Two or more races1,695 7.0% White alone, not Hispanic / Latino274 5.6% Hispanic or LatinoMoved within same state 653 2.6% White / Caucasian62 3.5% Black or African American58 3.2% Asian24 1.3% Other race664 2.8% White alone, not Hispanic / Latino6 0.1% Hispanic or LatinoMoved from different state 247 1.0% White / Caucasian17 0.9% Asian13 0.7% Other race32 1.3% Two or more races250 1.0% White alone, not Hispanic / Latino34 0.7% Hispanic or Latino
Children Nativity (place of birth) in Long Beach
Children under 6 years - Living with two parents Both parents native 925 100.0% NativeBoth parents foreign-born 22 53.3% Native19 46.7% Foreign-bornOne native, one foreign-born parent 219 100.0% NativeChildren under 6 years - Living with one parent Native parent 463 100.0% NativeForeign-born parent 35 100.0% NativeChildren 6 to 17 years - Living with two parents Both parents native 1,082 99.5% Native5 0.5% Foreign-bornBoth parents foreign-born 316 95.7% Native14 4.3% Foreign-bornOne native, one foreign-born parent 148 100.0% NativeChildren 6 to 17 years - Living with one parent Native parent 840 100.0% NativeForeign-born parent 348 51.7% Native325 48.3% Foreign-born
Grandparents responsible for own grandchildren in Long Beach
Grandparents (30 to 59 years) White / Caucasian 48 100.0% Not responsible for grandchildrenBlack or African American 37 49.4% Responsible for grandchildren38 50.6% Not responsible for grandchildrenWhite alone, not Hispanic / Latino 30 100.0% Not responsible for grandchildrenGrandparents (60 years and over) White / Caucasian 150 40.7% Responsible for grandchildren219 59.3% Not responsible for grandchildrenBlack or African American 72 100.0% Not responsible for grandchildrenWhite alone, not Hispanic / Latino 141 51.3% Responsible for grandchildren134 48.7% Not responsible for grandchildren